 ISSN: 2822-0838 Online

Significant Contribution of C3 - Type Forest Plants’ Burning to Airborne PM2.5 Pollutions in Chiang Mai Province, Northern Thailand
Sawaeng Kawichai, Tippawan Prapamontol*, Fang Cao, Xiao - Yan Liu, Wen - Huai Song, Suchart Kiatwattanacharoen, and Yan - Lin Zhang**Published Date : 2021-09-13
DOI : https://doi.org/10.12982/CMUJNS.2021.088
Journal Issues : Number 4, October-December 2021
Abstract This study aimed to identify the contributing sources of PM2.5 in Chiang Mai Province during February to April 2016. We therefore investigated the chemical compositions of PM2.5 at two different sites. An urban site is in Chiang Mai University (CMU) while a rural site is in Mae Chaem (MC) District where frequent intensive biomass burning was reported. Thirty pair samples of 24-h PM2.5 were analyzed for organic carbon (OC), elemental carbon (EC), levoglucosan and stable carbon isotope (δ13C). The mean concentrations (Mean ± SD) of PM2.5, OC and EC at the CMU vs MC sites were not significant different (P >0.05) including 44.5 ± 32.1 vs 40.5 ± 21.2 µg/m3; 14.9 ± 12.5 vs 14.8 ± 10.0 µg/m3; and 1.80 ± 1.60 vs 1.62 ± 0.80 µg/m3, respectively. Levoglucosan concentrations, a tracer of biomass burning from both sites were not significant different (P >0.05) and the mean ± SD concentrations at CMU vs MC sites were 0.46 ± 0.56 µg/m3 vs 0.55 ± 0.67 µg/m3, respectively. Meanwhile, the mean values of δ13C in total carbon (TC) at CMU vs MC sites were -27.9 ± 0.68 vs -27.6 ± 0.60‰, respectively which major data (n = 48, 85.4%) fell within the ranged of C3-type plants and minor data (n = 48, 14.6%) in C3-type plants and motor vehicle sources. This finding corresponds to the vast biomass burning area from satellite data. Forest plants in northern Thailand, Chiang Mai particular are mostly mixed deciduous forest i.e. C3-type plants which falling leaves in dry season and easily causing fire. The results of this study therefore strongly suggest that the burning of C3-type forest plants attribute to airborne PM2.5 pollutants in Chiang Mai Province.
Keywords: Air pollution, Biomass burning, C3-type plants, Levoglucosan, Stable carbon isotope
Funding: The authors are grateful for the research funding provided by the Research Institute for Health Sciences, Chiang Mai University, Chiang Mai, Thailand and with funding from Thailand Science Research and Innovation (TSRI, formerly the Thailand Research Fund (TRF) (RDG6030019) and the National Natural Science Foundation of China (NSFC), grant number 41761144056.
Citation: Kawichai, S., Prapamontol, T., Cao, F., Liu, X.-Y., Song, W.-H., Kiatwattanacharoen, S., and Zhang, Y.-L. 2021. Significant contribution of C3 - type forest plants’ burning to airborne PM2.5 pollutions in Chiang Mai Province, Northern Thailand. CMU J. Nat. Sci. 20(4): e2021088.
INTRODUCTION
Keywords: Since 2007, air pollution has become a serious problem in upper northern Thailand. The major sources of air pollution in this area are mostly from open burning of agricultural waste and forest fires from February to April (Pengchai et al., 2008; Chantara et al., 2012; Chuang et al., 2013; Pani et al., 2019; Punsompong and Chantara, 2019). Chiang Mai Province is in the Chiang Mai-Lamphun Basin which is a flat plain surrounded by high mountain ranges. Forest area data from the Royal Forest Department indicate that forested areas are abundant, consisting of mixed deciduous, deciduous dipterocarp, dry evergreen, and hill evergreen forests. The geographical feature of high mountains surrounding a large valley basin often results in limited ventilation and dispersion of air pollution. Biomass burning (BB) can either occur naturally or from human activity. Open burning of forest fires and grassland, agriculture residue and residential combustion of biofuel for cooking is a significant contributor to trace gases and particulate matter (PM) in the troposphere (Chang et al., 2015). In this area, high number of hotspots were reported and the dominant sources of PM2.5 were contributed from the biomass burning especially in dry season. According to a previous study in Chiang Mai, the primary sources of air pollution in this area indicated biomass burning emissions (agricultural and forest fires), as well as transportation emissions (Pongpiachan, Pongnailert, Ho, & Cao, 2014; Janta et al., 2019; ChooChuay et al., 2020)
In Southeast Asia, the main source of biomass burning includes forest fires and burning of agricultural waste products (Yadav et al., 2017). A previous study found that large amounts of fine PM or PM2.5 (particulate matter with an aerodynamic diameter less than 2.5 µm) in Chiang Mai were emitted from biomass burning, with an average ambient PM2.5 concentration of 45.5 ± 8.8 μg/m3 (Chuang et al., 2013). The daily average values of PM2.5 in ambient air in Chiang Mai Province have exceeded Thailand’s national ambient air quality standard of 50 μg/m3 during 2014 - 2016. Khamkaew et al., (2016) reported that the mean PM2.5 concentrations collected at Chiang Mai University (CMU) between March and April 2014 were largely attributed to local open burning of agricultural matter and forest fires (Khamkaew et al., 2016). Air pollution in Chiang Mai City studied in the dry season of 2010 suggested that open burning of plants was the predominant contributor to air pollution in this area and was found to be highly correlated with element concentrations in ambient PM10 (particulate matter with an aerodynamic diameter less than 10 µm) and the combustion of teak, yangna, and corn stalks (Kiatwattanacharoen et al., 2017). Mae Chaem (MC) is a rural district in Chiang Mai Province and the terrain consists of mostly foothills and mountain ridges surrounding a small basin approximately 350 m above mean sea level. MC has had the highest number of hotspots and smoke haze pollution during the dry season for more than a decade (Arunrat et al., 2018).
Prapamontol and colleagues reported that in February to March in 2012, the maximum ambient 24-hour average PM10 in MC was 191.5 µg/m3, about 1.5 times higher than the standard PM10, 24-h average, in Thailand (120 µg/m3). Moreover, particles of PM2.5 often contain a variety of chemical species, organic carbon (OC) and elemental carbon (EC) and numbers of studies regarding the chemical characterization of fine particles were carried out in the southern part of Thailand such as in Hat Yai city (Pongpiachan, 2014; Pongpiachan, Pongnailert, Ho, & Cao, 2014). Carbonaceous particles emitted from biomass burning can be categorized into elemental carbon (EC) and organic carbon (OC) based on their thermal, chemical, and optical properties (Nunes and Pio, 1993; Saarikoski et al., 2008). In general, EC is released from primary combustion, emitting directly from incomplete combustion of fossil combustion (coal, fuel oil and petrol) and biomass burning, agricultural residue, and forest fire (Schwarz et al., 2008). EC is referred to as black carbon (BC) aerosol, and arises from incomplete combustion of biomass, motor vehicle fuel and residential coal (Watson, 2002). Thus, EC is frequently used as a primary tracer element due to its inert physiochemical properties in the atmosphere. In contrast, OC is the result of secondary combustion and is comprised of a complex mixture of many compounds including primary source emissions (biogenic source, biomass burning, traffic, cooking and industry) and secondary organic carbon (SOC) which is formed by the atmospheric oxidation of gaseous precursors. OC usually consists of a mixture of many organic compounds, such as polycyclic aromatic hydrocarbons (PAHs), polychlorinated dibenzo-d-dioxin and dibenzofuran (PCDD/F), which have mutagenic and/or carcinogenic characteristics (Feng et al., 2009; Kanakidou et al., 2012). Levoglucosan (1,6-anhydro-β-D-glucopyranose) is a tracer of biomass burning and one of the most studied sugar compounds produced by thermal decomposition of cellulose and hemicellulose. It is emitted during the combustion of biomass such as that used in residential heating and wild/agriculture fires and has been a useful molecular marker of biomass (Simoneit et al., 1999; Křůmal et al., 2015). Recent studies (Hennigan et al., 2010; Hu et al., 2013; Zhao et al., 2014) have suggested that levoglucosan is prone to degradation by OH radicals in the atmosphere. Thus, its concentration during long-range transport may be underestimated, especially in summer (Fraser and Lakshmanan, 2000; Simoneit, 2002; Simoneit et al., 2004, 1999). Detailed characterization of the proportional yield of levoglucosan to its isomers and particularly to mannosan in fuel source emissions has further permitted discrimination by specific types of fuel combustion (Ward et al., 2006). In addition, studies of stable carbon isotopes in atmospheric particulate matter are potentially useful for identifying sources of carbonaceous particles and this approach may be a useful new tool for studies of air pollution composition (Wang et al., 2013; Mkoma et al., 2014; Bikkina et al., 2016). Stable carbon isotopes (δ13C) measurement values can be used to trace carbon sources in atmospheric studies by taking advantage of the different stable carbon isotope ratios of C4- and C3- type plants (Kawashima and Haneishi, 2012; Cao et al., 2017). Due to their different photosynthetic pathways, C4-type plants, such as corn and warm-climate grasses, are enriched in stable carbon isotopes compared to C3-type plants, which include most other plants, trees, and cool-climate grasses (DeNiro and Epstein, 1978). Kawashima and Haneishi (2012) employed stable carbon isotopes (δ13C) measurement to study aerosol carbon from various sources such as gasoline and diesel vehicle exhaust, fireplace soot, open biomass burning emissions, street dust, soils, charcoal, and coal. They found that δ13C values of fuel combustion ranged from −20.6‰ to −20.5‰, whereas, the values obtained from C3-type plants (-34.7‰ to -28.0‰) were lighter than obtained from C4-type plants (-19.3‰ to -16.1‰) (Kawashima and Haneishi, 2012).
This study aimed to identify the contributing sources of airborne particulate matter with an aerodynamic diameter less than 2.5 µm (PM2.5) in Chiang Mai Province where severe smoke-haze pollution occurred almost every dry season (February to April). So, we determined chemical compositions including carbonaceous carbons (EC and OC), levoglucosan and stable carbon isotopes in ambient PM2.5 samples collected from urban and rural sites in Chiang Mai Province during February to August 2016. The chemical compositions were then used to characterize and identify sources contributing to ambient PM2.5 in Chiang Mai Province.
MATERIALS AND METHODS
Sampling sits and sample collection
The study had two sampling sites located in Chiang Mai Province as shown in Figure 1. The first sampling site was in urban area located on the rooftop of the four–story building at the Research Institute for Health Science (RIHES), Chiang Mai University (called CMU site; 18°47ꞌ43.63ꞌꞌN, 98°57ꞌ28.17ꞌꞌE, 331 m mean sea level; MSL). The second sampling site was a rural area located in Mae Chaem District, where PM2.5 was collected at the Debaratana Vejjanukula Hospital (MC site; 18°29'52.94"N, 98°22'45.38"E 535 m MSL). PM2.5 samples were collected from February to August 2016 using MiniVol air samplers (Air metric, USA) with a flow rate of 5 L/min. PM2.5 samples were collected for 24 hours starting at 9.00 a.m., on quartz fiber filters (Whatman’s, UK, Ø 47 mm). The filters were stored in desiccators filled with silica gel before and after sampling for 24 hours prior to being weighed using a 5-place microbalance (Mettler Toledo, AB135-S/FACT, Switzerland). Each filter was weighed three times in a controlled room (25 ± 2°C and 40 ± 5% RH). The collected filters were covered with aluminum foil to protect the samples from sunlight and kept in a -20 °C freezer until analysis.
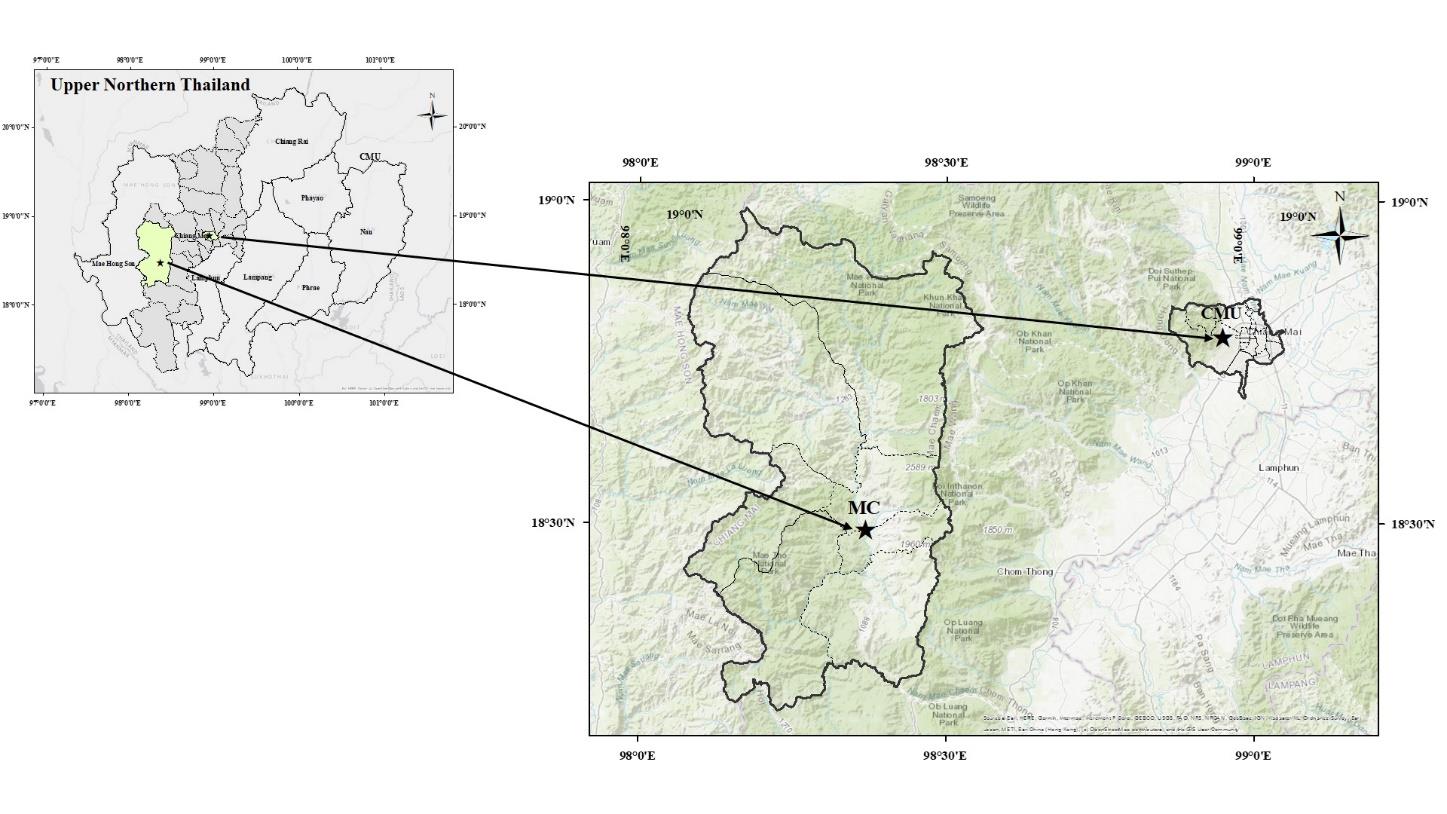
Figure 1. The location of CMU and MC sites.
Carbonaceous aerosol analysis
The concentration of OC and EC on PM2.5 samples were analyzed using a thermal optical transitions OC/EC analyzer (Sunset Laboratory, Model - 4, USA) using the thermal-optical transmittance (TOT) method and applying the NIOSH (National Institute for Occupational Safety and Health) 5040 protocol, with improvements from Chow et. al., 2007 (Chow et al., 2007) at Yale-NUIST Center on Atmospheric Environment, Nanjing University of Information Science and Technology (NUIST), Nanjing, China. Briefly, an aliquot of quartz filter disks with a 17 mm diameter were packed in a quartz tube inside the thermal desorption chamber. The pyrolysis products were converted to carbon dioxide (CO2) by a redox reaction with manganese dioxide. The CO2 was quantified using a self-contained nondispersive infrared (NDIR) system. At the end of each analysis, a fixed volume of an internal standard containing 5% methane and 95% helium was injected and thus a known carbon mass could be derived. An external sucrose standard (4.2 μg/L) calibration was conducted every week to insure repeatable quantification. Calibration with an instrument blank was conducted every day. Both detection limits for OC and EC of the instrument was 0.5 μg/m3. A duplicate was run to test for analytical errors in the precision of the measurement. The results showed good reproducibility (reported as percentage relative standard deviation; % RSD), from duplicate analysis of the filter samples at less than 8% for OC and 15% for EC. The sample results were corrected by blank values.
Levoglucosan analysis
Levoglucosan analysis was performed at the Yale-NUIST Center. A filter samples punch 17 mm in diameter was placed in a high-density polyethylene (HDPE) bottle with 3 mL of deionized water and sonicated (PS-D40, China) for 30 minutes at controlled temperature (~10 ºC). Using ice to extract the target compounds, the filter was removed and the extract was then filtered through a 0.22 μm polyether sulfone (PES) and the aqueous filtrate was characterized by a modified IC method based on Hsieh et al., (2008) and Tsai et al., (2010). The IC (DX-5000+, Dionex) was equipped with pulsed amperometry detection (PAD). The gradient pump (Model GP 5000, a spectra system automated sampler (AS 5000) with 5 mL vials, used a CarboPac MA1 analytical column (250 mm × 4 mm I.D.), and sodium hydroxide solution (480 mM, 0.4 mL/min) as eluent.
Stable carbon isotope analysis
The stable carbon isotopes in PM2.5 were determined using an elemental analyzer (EA) coupled with an isotope ratio mass spectrometer (IRMS, Finnigan MAT Delta Plus) at the Yale-NUIST Center on Atmospheric Environment, (Jung and Kawamura, 2011). A filter disk of 14 mm diameter was packed in a tin cup, loaded into the EA by an auto-sampler and then oxidized by chromium (III) oxide at 1020°C. The resulting CO2 was purified by an online GC column equipped in the EA and then measured with a thermal conductivity detector. A small aliquot of CO2 gas was introduced to the IRMS through an interface ConFlo II (Thermo Quest), the carbon isotopic composition was expressed as δ13C, which is relative to the Pee Dee Belemnite (PDB). External calibration was conducted using five known amounts (ranging from 0.2 to 0.6 mg) of acetanilide (Thermo Scientific, USA) with known δ13C of TC (-27.26‰.). The analytical errors of δ13C based on the duplicate analyses were less than 0.06 ‰. TC concentrations measured with EA agree well (P <0.01). The δ13C value in a sample was expressed on a per mill (‰, that is, parts per thousand) basis. The isotope ratio of a sample (Rsample) was compared with a standard (Rstandard) as follows:

Data Analysis
All data from this study were analyzed using the SPSS statistical program. The average value was expressed as Mean ± Standard deviation (SD). T-tests were used for comparisons of pollutants between the two sites and correlation coefficients (r) were calculated. Linear regression analysis was performed in identifying the associations of parameters. The Moderate Resolution Imaging Spectroradiometer (MODIS) on board NASA’s Aqua and Terra satellites were used to calculate the number of hotspots during the intensive biomass burning season.
Backward Trajectories Analysis
Three-day back trajectories in samples from the CMU and MC study sites were calculated using the National Oceanic and Atmospheric Administration’s Hybrid Single Particle Lagrangian Integrated Trajectory (HYSPLIT) model version 4 (Draxler & Hess, 1998). Backward trajectories were calculated every day from February to May 2016 starting at 00, 06, 12, and 18 UTC at altitudes 100 m above ground level (AGL) and only one at which the air arrives at the sites. The selection of 100 m arriving height as the lowest level resulted from the orography around the sites which is surrounded by mountain and forest. The clustered to the characterized distribution of fire directions and orientation arriving at the sampling receptors.
RESULTS
General results of PM2.5, OC, and EC
The average concentrations of PM2.5 at the CMU and MC sites were 44.5 ± 32.1 µg/m3 and 40.3 ± 21.2 µg/m3, respectively, which were not significantly different (P >0.05). The highest number of hotspots, 120, was observed on April 18, coinciding with the highest concentration of PM2.5 at the CMU site, 129.3 µg/m3. These high concentrations were well in accord with the number of hotspots detected in Chiang Mai Province in March and April 2016. Meanwhile PM2.5 level was relatively low at MC site at the same day. There are several reasons toward this phenomenon. Chiang Mai Province locates in upper northern part of Thailand and composes of 9 provinces (about 102,259 Square km in total) and mountainous topography. CMU site was designed as a representative Chiang Mai City area which locates in Chiang Mai - Lamphun Basin (large basin approximate ranged 174 km long) while MC site locates in Mae Chaem Basin (approximate ranged 7 km long and about 120 km south-west direction of Chiang Mai City. Moreover, the frequency of biomass burning was also different. Besides forest fire, it is common practices of getting rid of garbage in the rural community i.e. MC site. Furthermore, there are few more reasons for the difference of PM2.5 levels such as the meteorological parameters i.e. wind direction, wind speed, rain fall etc. In addition, the dominant of wind direction from southwest direction which passed through the MC site. This phenomenon might disperse PM2.5 as well as other pollutants away. The 24-hour average concentrations of OC in PM2.5 at the CMU and MC sites during the sampling period were 14.6 and 14.3 µg/m3, respectively. Meanwhile, the average concentrations of EC at the CMU and MC sites were 1.8 and 1.7 µg/m3, respectively (Table 1).
Table 1. The concentrations of PM2.5, OC, EC, TC, levoglucosan, stable carbon isotope and the ratio of OC/EC, levoglucosan/OC at CMU and MC sites.
|
Parameter |
CMU site |
MC site |
P value |
||||||
|
Min. |
Max. |
Mean |
S.D. |
Min. |
Max. |
Mean |
S.D. |
||
|
Concentrations (µg/m3) |
|
|
|
|
|
|
|
|
|
|
PM2.5 |
7.80 |
129.30 |
44.50 |
32.10 |
11.90 |
83.70 |
40.30 |
21.20 |
0.557 |
|
OC |
0.50 |
46.10 |
14.60 |
11.90 |
0.84 |
43.0 |
14.30 |
10.20 |
0.964 |
|
EC |
0.15 |
6.81 |
1.80 |
1.61 |
0.33 |
3.60 |
1.66 |
0.76 |
0.774 |
|
TC |
0.50 |
52.9 |
15.80 |
13.30 |
0.84 |
46.70 |
15.30 |
11.20 |
0.073 |
|
Levoglucosan |
0.02 |
2.35 |
0.46 |
0.56 |
0.12 |
2.34 |
0.55 |
0.67 |
0.565 |
|
δ13C (‰) |
-29.30 |
-26.40 |
-27.90 |
0.67 |
-28.80 |
-25.80 |
-27.60 |
0.60 |
0.067 |
|
OC/EC ratio |
6.77 |
34.00 |
15.80 |
8.01 |
8.26 |
27.70 |
13.50 |
5.22 |
0.995 |
|
Levoglucosan/OC (%) |
0.29 |
6.37 |
2.67 |
1.59 |
0.16 |
9.02 |
3.15 |
2.26 |
0.304 |
In addition, the moderate correlations coefficient (r) between TC and PM2.5 mass concentrations of 0.67 and 0.57 (P <0.001) were observed at the CMU and MC sites, respectively, suggesting TC and PM2.5 have similar sources and formation processes, allowing researchers to predict that the TC and PM2.5 possibly originated from same biomass-type burning which came from local emission and transportation sources. Moreover, OC was significantly correlated with levoglucosan (Figure 3.) suggesting that biomass burning emissions contributed to carbonaceous aerosols (Cao, Zhang, Kawamura, & Zhang, 2016). The average values of OC/EC ratios were 15.8 at the CMU and 13.5 at the MC sites, indicating that biomass burning was the likely source of carbonaceous species. Previous studies have shown that high OC/EC ratios were related to biomass burning, with a ratio of OC/EC 14.5 for forest fires (Watson, Chow, & Houck, 2001) and 15.7 for rice straw burning (Engling, Lee, Sie, Wu, & I, 2013). The values of the OC/EC ratio for fossil fuel combustion, mainly vehicular emission was 2.9 ± 0.5 (Safai, Raju, Rao, & Pandithurai, 2014), 1.88 ± 0.24 (Panda et al., 2016) and 0.71 (Saarikoski et al., 2008). A significant correlation coefficients found between OC and EC for the whole period for the CMU and MC sites were 0.876 and 0.832 (P <0.001), and this finding suggested that a large fraction of OC and EC was emitted from the same biomass sources in atmospheric PM2.5 (B. Huang et al., 2013; Qi et al., 2018). More specifically, we employed the stable carbon isotopes to clarify emission sources of PM2.5. Range for δ13C were -29.3 to -26.4‰ and -28.8 to -25.8‰ at CMU and MC, respectively. The mean value of δ13C was -27.9 ± 0.67‰ at CMU and -27.6 ± 0.60‰ at MC, indicating dominant contribution from combustion of C3 plants such as rice residues, teak, and grass. It confirmed that the sources of aerosol PM2.5 were more influenced by forest fire burning and agricultural residues. C4 plants burning such as wheat straw as shown in secondary emission sources. C4 plants such as corn and warm - climate grasses, are enriched in stable carbon isotopes compared to C3 plants, which include most other plants, trees, and cool-climate grasses. These results were similar to previous study, Cao et al., 2016 have been reported the average δ13C value (−26.2‰) from biomass burning aerosols in Northeast China was dominant contribution from combustion of C3 plants. Additionally, the PM ranges for δ13C values from biomass components burning showed sources differed signally. For C3 plants burning source, δ13C ranged from −34.7 to −25.4 ‰ whereas for C4 plants ranged from −22.2 to −13.0‰ (Aguilera & Whigham, 2018). For C3 plants burning source, δ13C ranged from −34.7 to −25.4 ‰ whereas for C4 plants ranged from −22.2 to −13.0‰ (Aguilera & Whigham, 2018).
Identification of biomass burning episodes
Temporal variation of levoglucosan
The average concentrations of levoglucosan observed at the CMU site was 0.46 ± 0.56 µg/m3, while the concentrations of levoglucosan at the MC site were 0.55 ± 0.67 µg/m3, with no significant difference (P <0.05) between two sites. The levoglucosan concentrations peaked at the CMU site on 25 March at 0.23 µg/m3, while the peak at the MC site was 0.23 µg/m3 on 18 April (Figure 2.).
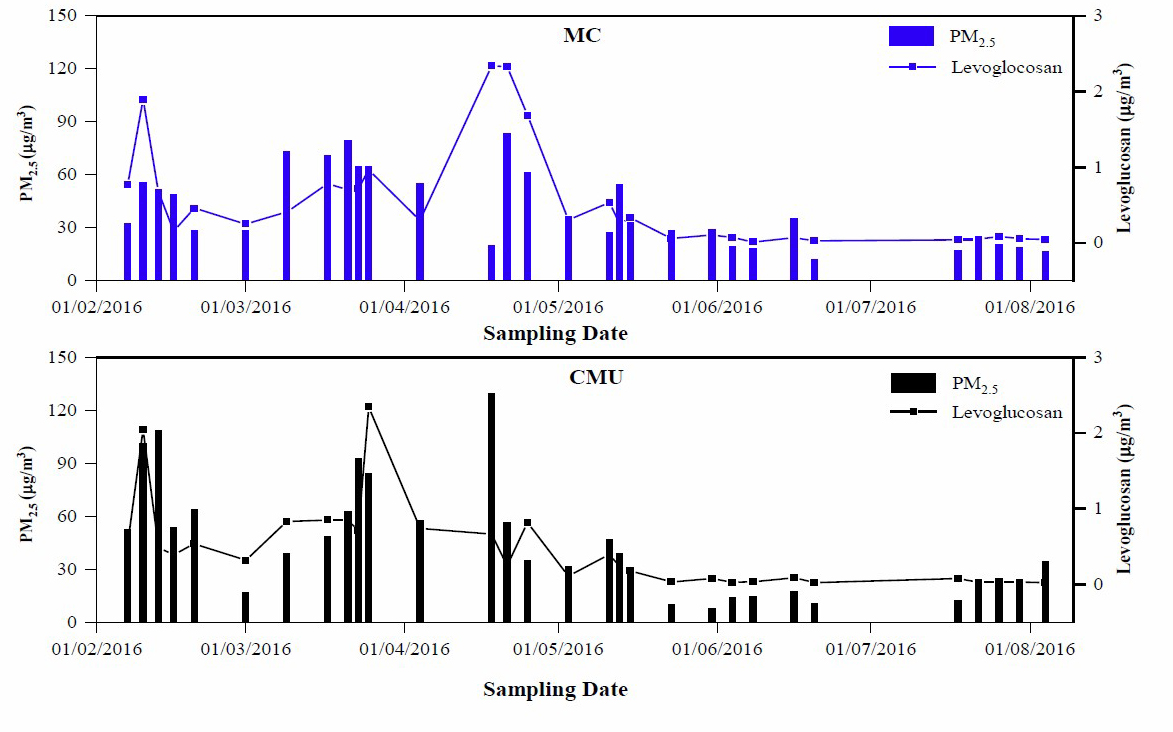
Figure 2. Daily variation in PM2.5 and levoglucosan concentrations during the sampling period at the CMU and MC sites.
Based on results from previous studies, it is likely that open burning of agricultural biomass and forest fires were the primary sources of biomass derived particles in our study (Liu et al., 2013; Maenhaut et al., 2016; Thepnuan et al., 2019). Levoglucosan concentration as a specific marker of biomass burning because levoglucosan is the degradation product from cellulose part in some biomass (Klejnowski, Janoszka, & Czaplicka, 2017; Bhattarai et al., 2019; Janoszka, Czaplicka, & Klejnowski, 2020). There is no critical level or range of levoglucosan concentration for proving that the particles were from biomass burning but whatever the level of levoglucosan detected it will indicate the biomass-burning source. The average levoglucosan concentrations from CMU and MC sites were 0.46 ± 0.56 and 0.55 ± 0.67 µg/m3, respectively which higher than the report from a rural mountaintop in East China, (Liu et al., 2013) with an average level of 0.064 µg/m3 and ranged from 0.0028 to 0.11 µg/m3. Meanwhile, the values from our study were lower than those observed at a Chiang Mai City site with an average 1.22 ± .75 µg/m3 and 1.13 µg/m3 (Khamkaew et al., 2016; Thepnuan, Chantara, Lee, Lin, & Tsai, 2019). The variability of levoglucosan levels depending on such biomass containing cellulose component. A moderate correlation between levoglucosan concentrations and PM2.5 was found in the CMU site (0.654) but rather low at MC site (0.494) (Figure 3.), suggesting the source of air pollution at both study sites was from open biomass burning during this study period.
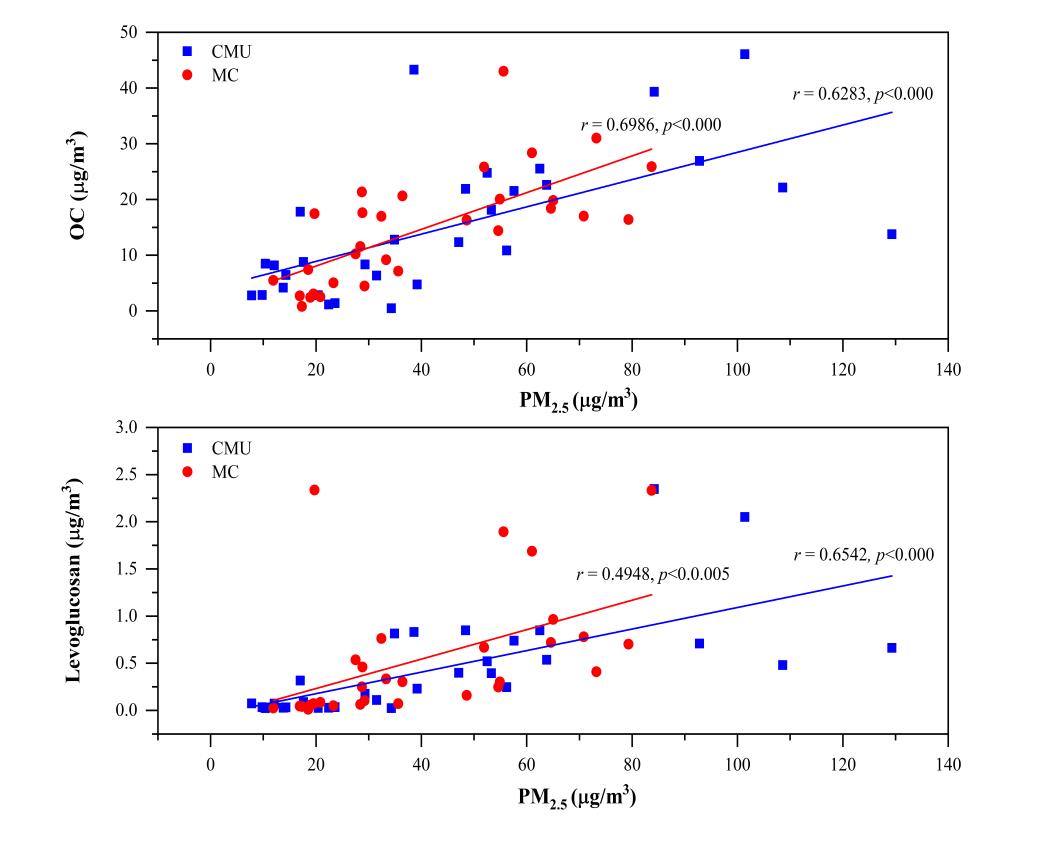
Figure 3. Correlation between PM2.5, OC, and levoglucosan at the CMU and MC sites.
This Figure 3. shows concentrations of levoglucosan, a tracer of biomass burning, associated with PM2.5 with the r of 0.6542 and 0.4948 in CMU and MC sites, respectively. Meanwhile, OC has association with PM2.5 with the r of 0.63 and 0.70, respectively. These two graphs show that OC and levoglucosan attribute to PM2.5 in CMU site greater than in the MC site. Interestingly, the backward trajectory indicated that the air mass arrived from southern and southwest of CMU where MC site is in that direction. Though MC has been the intensive area of biomass burning, other meteorological and topographical factors might impact on aerosol plume. To our best knowledge, this study will be the first of its kind from rural area of biomass burning site. Table 1 shows the ratio of OC to levoglucosan, and the mean levoglucosan/OC ratio at the CMU and MC sites were 2.7% and 3.2%, respectively which was similar with previous studies suggesting biomass burning as the source (Sullivan et al., 2008; Ho et al., 2014; Zhang et al., 2014).
Evidence from hotspot maps and trajectory
For the biomass burning season period from February to May 2016 shown in Figure 4. , the HYSPLIT model was used to calculate three-day backward trajectories to evaluate potential sources of air mass flows arriving at CMU and MC. The CMU site is at the altitude of 100 m above ground level (00, 06, 12 and 18 UTM; start time), the data were classified in to 3 clusters. In February, the air masses arrived mainly from the southern direction (56.9%) passing from lower northern Thailand, while the dominant air masses were transported from the southwestern direction in March (49.2%) and April (43.3%). The air mass from the south-west passes through southern Myanmar and some parts of Thailand (Mae Hong Son Province and south-west districts of Chiang Mai Province). In these regions, there was high numbers of fire hotspots during the study period. In May, the bulk of air masses arrived at the study locations from the south-west of Thailand and travelled over the Andaman Sea (60.5%). At the MC site, the direction of air mass flows was largely similar as that found at the CMU site. The primary direction was from south and southwest Myanmar, with higher contribution to overall airflow in February, March, and April at 56.9%, 50.0% and 43.3%, respectively. The result of air mass movement in May was again like the CMU site, the mainly of air masses in these cluster originated from the Andaman Sea was observed for 6 days (in accounts for 47.6% of total). The dominant air masses at CMU and MC sites originated from southern Myanmar and the south of Mae Hong Son Province. The major direction of the air masses at both sites passed through southern Myanmar and the parts of Mae Hong Son. In this region, there was high distribution of fire hotspots during the study period as also shown in previously reports (Khamkaew et al., 2016; Kiatwattanacharoen et al., 2017; Punsompong and Chantara, 2019).
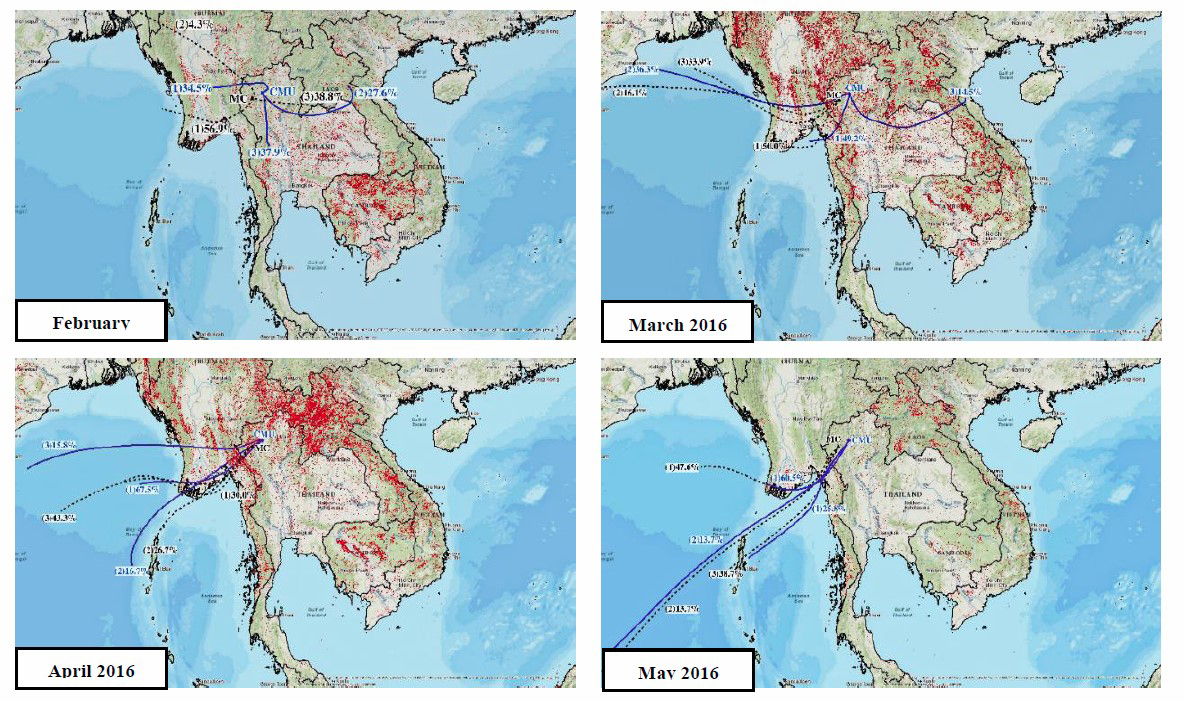
Figure 4. The number of hotspots were obtained from NASA and cluster analysis of three-day BWT arriving at 100 m AGL at both sites.
Major source of biomass type from stable isotope data
The results from the δ13C measurements of the PM2.5 samples are shown in Figure 5. The variation in δ13C values of TC aerosol from the CMU vs MC sites ranged between -29.3‰ to -26.4‰ vs -28.8‰ to -25.8‰ with a mean of -27.9 ± 0.7‰ vs -27.6 ± 0.6‰, respectively. Our mean values were similar to the values reported for the plant leaf samples from Thailand in 2006 whose mean values in the wet and dry seasons were -29.2‰ and -28.6‰, respectively (Yoneyama et al., 2010). Furthermore, the δ13C values of C3-type plants ranged from -30.6‰ to 24.4‰, while the C4-type plants ranged from -19.3‰ to 11.6‰ (Table. 2) Therefore, the δ13C values from both CMU and MC sites indicated the burning of C3-type plants.
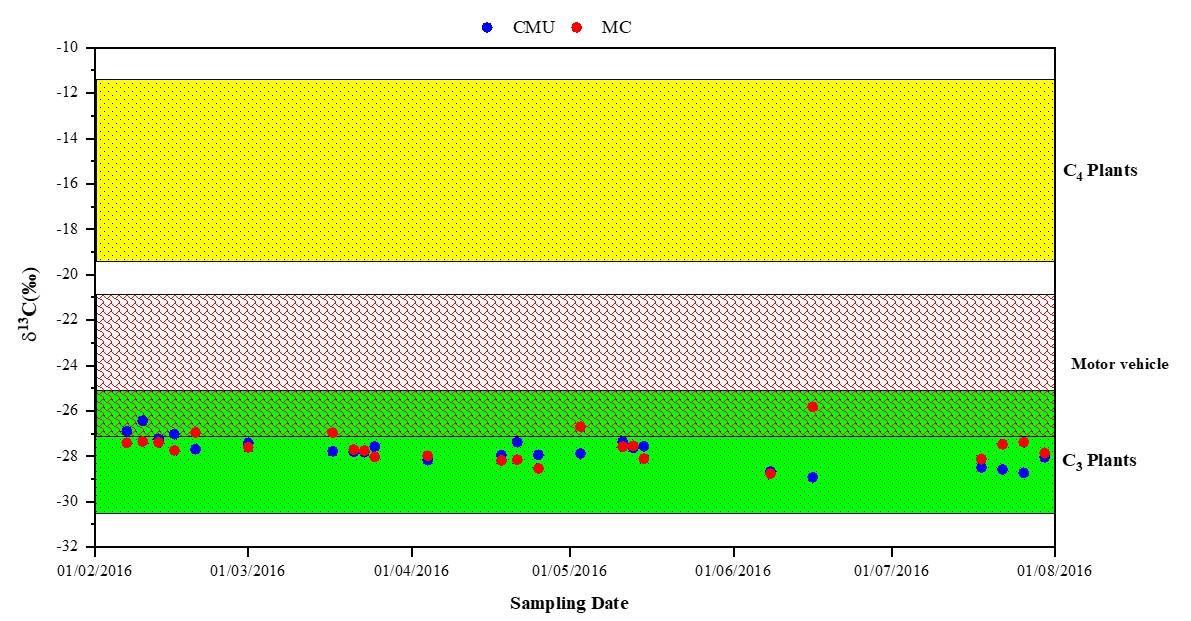
Figure 5. Data plots for δ13C of TC from CMU and MC sites based on typical value thresholds from various sources such as combustion/emissions from C3- and C4-type plants (Turekian et al., 1998; Lü et al., 2000; Yoneyama et al., 2006; Girard et al., 2011; Kawashima and Haneishi, 2012) and motor vehicle emissions (Widory and Javoy, 2003; Widory et al., 2004; López-Veneroni, 2009; Kawashima and Haneishi, 2012)
Table 2. The values of stable carbon isotope in the present study and those reported in the literature.
|
Plants |
Species |
δ13C (‰) |
Location |
Reference |
|
C4 – type plants |
Corn |
-16.1 |
Japan |
Kawashima and Haneishi, 2012 |
|
|
Corn |
-13.5 to -11.6 |
Canada |
Girard et al., 2011 |
|
|
Grass |
-19.3 |
Japan |
Kawashima and Haneishi, 2012 |
|
|
Saccharum |
-12.9 |
South Africa |
Turekian et al., 1998 |
|
|
Saccharum officinarum |
-12.1 |
Thailand and Philippines |
Yoneyama et al., 2010 |
|
|
Zea mays |
-15.1 |
China |
Lü et al., 2000 |
|
C3 – type plants |
Rice plant |
-28.5 |
Japan |
Kawashima and Haneishi, 2012 |
|
|
Dry leaves |
-29.4 |
Japan |
Kawashima and Haneishi, 2012 |
|
|
Mopane (Genus; Colospherum) |
-24.4 |
South Africa |
Turekian et al., 1998 |
|
|
Phyllostachy arcana |
-24.8 |
China |
Lü et al. 2000 |
|
|
Bamboo Indocalamus latifolius |
-25.6 |
China |
Lü et al., 2000 |
|
|
Hay |
-29.7 to -27.5 |
Canada |
Kawashima and Haneishi, 2012 |
|
|
Soybean |
-30.6 to -27.7 |
Canada |
Kawashima and Haneishi, 2012 |
|
|
Dipterocarpus alatus |
−28.6 ± 0.4 |
Thailand and Philippines |
Yoneyama et al., 2010 |
|
|
Tectona grandis |
−29.6 ± 0.2 |
Thailand and Philippines |
Yoneyama et al., 2010 |
|
|
Gigantocha hasskariana |
−29.9 ± 0.3 |
Thailand and Philippines |
Yoneyama et al., 2010 |
|
C3 – type plants |
Mix deciduous forest |
−27.9 ± 0.7 |
CMU, Thailand |
This study |
|
|
Mix deciduous forest |
−29.6 ± 0.6 |
MC, Thailand |
This study |
Table 3. Estimated total burned area in Chiang Mai Province, Thailand (hectares).
|
Year |
Forest area |
Agriculture area |
|
2015 |
395,339.8 (90.9%) |
39,735.7 (9.1%) |
|
2016 |
200,974.6 (97.8%) |
4,434.1 (2.2%) |
DISCUSSION
Our studies suggested the sources of PM2.5 in two different sites at Chiang Mai Provinces from February to September 2016 intensive biomass burning period. The chemical composition in airborne PM2.5 were analyzed including levoglucosan, OC, EC, and stable carbon isotope.
Levoglucosan is a specific biomarker of biomass burning marker and derived from cellulose burning (Rushdi et al., 2017; Simpson, Dills, Katz, & Kalman, 2004). The average concentrations of levoglucosan from this study in both sites was significantly higher than the reported value in the Kathmandu Valley, the capital region of Nepal (0.788 ± 0.685 µg/m3, Xin et.al, 2018) (Xin et al., 2018) and higher than the concentrations of levoglucosan at CMU, Chiang Mai Province, Thailand were 1.13 µg/m3 (Khamkaew et al., 2016). Open burning from forest fire and agricultural were predominant sources of biomass burning in this study. In the present study, the ratio of OC/EC ratio in CMU and MC sites also analyzed. We found that the highest of OC/EC ratios is mostly indicates the PM2.5 samples were derived from biomass burning (Zhang et al., 2007). However, the lower ratios of OC/EC were reported in the literature for vehicle fuel formulations in many studies at Beijing, Langfang, and Tianjin (Qi et al., 2018), Wanzhou (Huang, Zhang, Li, Chen, & Yang, 2020), Beijing-Tianjin-Hebei (Ji et al., 2019). Several studies have reported OC/EC ratio for various emission sources which include vehicular exhaust. In addition, we have also use stable carbon isotopic to provide information about the sources of PM2.5 and cold be applied in various type of environment studied to identify emission sources in the first time of this area (CMU and MC sites). This finding corresponds to the vast biomass burning area from satellite data (Table 3). The mean value of stable carbon isotope in these studies was suggest that the PM2.5 samples were contribution from C3 plants combustion were similar to the value reported at Doi Ang Kang, Thailand in 2018 during 1 March to 13 April, 2015 intensive biomass burning period (Boreddy, Parvin, Kawamura, Zhu, & Lee, 2018).
However, this study has some limitation represent weakness within a small number of PM2.5 samples. There were difficult to find significant relationships from the data such as the correlation between the concentrations of PM2.5 and chemical composition. Including the statistical tests normally require a larger sample size to ensure a representative distribution of the samples size to be considered representative of studies area. The authors recommendation the importance of sample size should be greater in quantitative and qualitative studies.
CONCLUSION
In the present study, the chemical composition, and characteristics of PM2.5 were investigated at two different sites (CMU and MC) in Chiang Mai Province to identify the contributing sources of airborne PM2.5 in Chiang Mai Province. High concentrations of PM2.5 were found at both the CMU and MC sites which corresponded with large numbers of hotspots to the southwest and west of the study sites during the study period. The mean values of δ13C in total carbon (TC) from PM2.5 at CMU and MC sites suggest C3-type plants’ burning sources according to major data (n = 48, 85.4%) fell within the range of C3-type plants and minor data (n = 48, 14.6%) in C3-type plants and motor vehicle sources. Forest plants in northern Thailand, Chiang Mai particular are mostly mixed deciduous forest i.e. C3-type plants which falling leaves in dry season and easily causing fire. The results of this study therefore strongly suggest that the burning of C3-type forest plants attribute to airborne PM2.5 pollutants in Chiang Mai Province. As this study result, control of forest burning on local and regional scales should be seriously considered by the national and local government in reduction of airborne PM2.5 in Chiang Mai Province.
ACKNOWLEDGEMENTS
The present study was part of a cooperative research project between the Research Institute for Health Sciences, Chiang Mai University, Chiang Mai, Thailand (TP) and the Yale-NUIST Center on Atmospheric Environment, Nanjing University of Information Science and Technology (NUIST), Nanjing, China (YLZ). The authors gratefully acknowledge this support. The authors thank Wirat Salasee and Somdej Shoomsak for their help with samples collection.
AUTHOR CONTRIBUTIONS
Tippawan Prapamontol: Supervision, Conceptualization, Methodology and Editing. Sawaeng Kawichai: Investigation Writing- Original draft preparation, Writing- Reviewing. Suchart Kiatwattanacharoen: Software, Validation. Fang Cao: Supervision and Methodology. Xiao - Yan Liu: Investigation. Wen - Huai Song: Investigation. Yan-Lin Zhang: Supervision, Conceptualization, Methodology and Editing.
CONFLICT OF INTEREST
The authors declare that they hold no competing interests.
REFERENCES
Aguilera, J., and Whigham, L.D. 2018. Using the 13C/12C carbon isotope ratio to characterise the emission sources of airborne particulate matter: a review of literature. Isotopes Environ Health Stud. 54: 573-587.
Arunrat, N., Pumijumnong, N., and Sereenonchai, S., 2018. Air-pollutant emissions from agricultural burning in Mae Chaem basin, Chiang Mai Province, Thailand. Atmosphere. 9: 145.
Bhattarai, H., Saikawa, E., Wan, X., Zhu, H., Ram, K., Gao, S., Kang, S., Zhang, Q., Zhang, Y., Wu, G., et al. 2019. Levoglucosan as a tracer of biomass burning: Recent progress and perspectives. Atmospheric Research. 220 (November 2018): 20–33.
Bikkina, S., Kawamura, K., and Sarin, M., 2016. Stable carbon and nitrogen isotopic composition of fine mode aerosols (PM2.5) over the Bay of Bengal: impact of continental sources. Tellus B: Chemical and Physical Meteorology. 68: 31518.
Boreddy, S.K.R., Parvin, F., Kawamura, K., Zhu, C., and Lee, C.T., 2018. Stable carbon and nitrogen isotopic compositions of fine aerosols (PM2.5) during an intensive biomass burning over Southeast Asia: Influence of SOA and aging. Atmospheric Environment, 191, 478-489.
Cao, F., Zhang, S.C., Kawamura, K., Liu, X., Yang, C., Xu, Z., Fan, M., Zhang, W., Bao, M., Chang, Y., et al., 2017. Chemical characteristics of dicarboxylic acids and related organic compounds in PM2.5 during biomass-burning and non-biomass-burning seasons at a rural site of Northeast China. Environmental Pollution. 23: 654–662.
Cao, F., Zhang, S.C., Kawamura, K., and Zhang, Y.L., 2016. Inorganic markers, carbonaceous components and stable carbon isotope from biomass burning aerosols in Northeast China. Science of the Total Environment. 572: 1244–1251.
Chang, C.H., Hsiao, Y.L., and Hwang, C., 2015. Evaluating spatial and temporal variations of aerosol optical depth and biomass burning over Southeast Asia based on satellite data products. Aerosol and Air Quality Research. 15: 2625 - 2540.
Chantara, S., Sillapapiromsuk, S., and Wiriya, W., 2012. Atmospheric pollutants in Chiang Mai (Thailand) over a five-year period (2005–2009), their possible sources and relation to air mass movement. Atmospheric Environment. 60: 80-89.
ChooChuay, C., Pongpiachan, S., Tipmanee, D., Deelaman, W., Iadtem, N., Suttinun, O., and Cao, J. 2020. Effects of agricultural waste burning on PM2.5-bound polycyclic aromatic hydrocarbons, carbonaceous compositions, and water-soluble ionic species in the ambient air of Chiang-Mai, Thailand. Polycyclic Aromatic Compounds. 0: 1-22.
Chow, J.C., Watson, J.G., Chen, L.W.A., Chang, M.C.O., Robinson, N.F., Trimble, D., and Kohl, S., 2007. The improve a temperature protocol for thermal/optical carbon analysis: Maintaining consistency with a long-term database. Journal of the Air Waste Management Association. 57: 1014–1023.
Chuang, M.T., Chou, C.C.K., Sopajaree, K., Lin, N.H., Wang, J.L., Sheu, G.R., Chang, Y.J., and Lee, C.T., 2013. Characterization of aerosol chemical properties from near-source biomass burning in the northern Indochina during 7-SEAS/Dongsha experiment. Atmospheric Environment. 78: 72–81.
DeNiro, M.J., and Epstein, S., 1978. Influence of diet on the distribution of carbon isotopes in animals. Geochimica et Cosmochimica Acta. 42: 495–506.
Draxler, R.R., and Hess, G.D., 1998. An overview of the HYSPLIT_4 modeling system of trajectories, dispersion, and deposition. Aust. Met. Mag. 47: 295–308.
Engling, G., Lee, J.J., Sie, H.J., Wu, Y.C., and I, Y.P., 2013. Anhydrosugar characteristics in biomass smoke aerosol - case study of environmental influence on particle-size of rice straw burning aerosol. Journal of Aerosol Science. 56: 2–14.
Feng, Y., Chen, Y., Guo, H., Zhi, G., Xiong, S., Li, J., Sheng, G., and Fu, J., 2009. Characteristics of organic and elemental carbon in PM2.5 samples in Shanghai, China. Atmospheric Research. 92: 434–442.
Fraser, M.P., and Lakshmanan, K., 2000. Using Levoglucosan as a molecular marker for the long-range transport of biomass combustion aerosols. Environmental Science Technology. 34: 4560–4564.
Girard, J., Baril, A., Mineau, P., and Fahrig, L., 2011. Carbon and nitrogen stable isotope ratios differ among invertebrates from field crops, forage crops, and non-cropped land uses. Écoscience. 18: 98–109.
Hennigan, C.J., Sullivan, A.P., Collett, J.L., and Robinson, A.L., 2010. Levoglucosan stability in biomass burning particles exposed to hydroxyl radicals. Geophysical Research Letters. 37: L09806.
Ho, K.F., Engling, G., Ho, S.S. H., Ho, H., Huang, R.J., Lai, S., Cao, J., and Lee, S., 2014. Seasonal variations of anhydro sugars in PM2.5 in the Pearl River Delta Region, China. Tellus B. 66: 22577.
Hsieh, L.Y., Chen, C.L., Wan, M.W., Tsai, C.H., and Tsai, Y.I., 2008. Speciation and temporal characterization of dicarboxylic acids in PM2.5 during a PM episode and a period of non-episodic pollution. Atmospheric Environment. 42: 6836–6850.
Hu, Q.H., Xie, Z.Q., Wang, X.M., Kang, H., and Zhang, P., 2013. Levoglucosan indicates high levels of biomass burning aerosols over oceans from the Arctic to Antarctic. Scientific Reports. 3: 3119.
Huang, B., Liu, M., Ren, Z., Bi, X., Zhang, G., Sheng, G., and Fu, J., 2013. Chemical composition, diurnal variation, and sources of PM2.5 at two industrial sites of South China. Atmospheric Pollution Research. 4: 298–305.
Huang, Y., Zhang, L., Li, T., Chen, Y. and Yang, F. 2020. Seasonal variation of carbonaceous species of PM2.5 in a small city in Sichuan basin, China. Atmosphere. 11: 1286.
Janoszka, K., Czaplicka, M., and Klejnowski, K., 2020. Comparison of biomass burning tracer concentrations between two winter seasons in Krynica Zdrój. Air Quality, Atmosphere and Health. 13: 379–385.
Janta, R., Sekiguchi, K., Yamaguchi, R., Sopajaree, K., Pongpiachan, S., and Chetiyanukornkul, T. 2019. Ambient PM2.5, polycyclic aromatic hydrocarbons and biomass burning tracer in Mae Sot District, Western Thailand. Atmospheric Pollution Research. 11.
Ji, D., Gao, M., Maenhaut, W., He, J., Wu, C., Cheng, L., Gao, W., Sun, Y., Sun, J., Xin, J., Wang, L. and Wang, Y. 2019. The carbonaceous aerosol levels still remain a challenge in the Beijing-Tianjin-Hebei region of China: Insights from continuous high temporal resolution measurements in multiple cities. Environment International. 126: 171–183.
Jung, J., and Kawamura, K., 2011. Springtime carbon emission episodes at the Gosan background site revealed by total carbon, stable carbon isotopic composition, and thermal characteristics of carbonaceous particles. Atmospheric Chemistry and Physics. 11: 10911–10928.
Kanakidou, M., H Seinfeld, J., Pandis, S., Barnes, I., Dentener, F., Facchini, M., Van Dingenen, R., Ervens, B., Nenes, A., J Nielsen, C., et al. 2005. Organic aerosol and global climate modelling: a review. Atmospheric Chemistry and Physics. 5: 1053–1123.
Kawashima, H., and Haneishi, Y., 2012. Effects of combustion emissions from the Eurasian continent in winter on seasonal δ13C of elemental carbon in aerosols in Japan. Atmospheric Environment. 46: 568–579.
Khamkaew, C., Chantara, S., Janta, R., Pani, S. K., Prapamontol, T., Kawichai, S., Wiriya, W., and Lin, N. H., 2016. Investigation of biomass burning chemical components over Northern Southeast Asia during 7-SEAS/BASELInE 2014 campaign. Aerosol and Air Quality Research. 16: 2655–2670.
Kiatwattanacharoen, S., Prapamontol, T., Singharat, S., Chantara, S., and Thavornyutikarn, P., 2017. Exploring the sources of PM10 burning-season Haze in Northern Thailand using nuclear analytical techniques. Chiang Mai University Journal of Natural Sciences. 16: 307–325.
Klejnowski, K., Janoszka, K., and Czaplicka, M., 2017. Characterization and seasonal variations of organic and elemental carbon and levoglucosan in PM10 in Krynica Zdroj, Poland. Atmosphere. 8.
Křůmal, K., Mikuška, P., and Večeřa, Z., 2015. Monosaccharide anhydrides, monocarboxylic acids, and OC/EC in PM1 aerosols in urban areas in the Czech Republic. Atmospheric Pollution Research. 6: 917–927.
Liu, D., Li, J., Zhang, Y., Xu, Y., Liu, X., Ding, P., Shen, C., Chen, Y., Tian, C., and Zhang, G., 2013. The use of levoglucosan and radiocarbon for source apportionment of PM2.5 carbonaceous aerosols at a background site in East China. Environmental Science and Technology. 47: 10454–10461.
López-Veneroni, and D., 2009. The stable carbon isotope composition of PM2.5 and PM10 in Mexico City Metropolitan Area air. Atmospheric Environment. 43: 4491–4502.
Lü, H., Wang, Y., Wang, G., Yang, H., and Li, Z., 2000. Analysis of carbon isotope in phytoliths from C3 and C4 plants and modern soils. Chinese Science Bulletin. 45: 1804–1808.
Maenhaut, W., Vermeylen, R., Claeys, M., Vercauteren, J., and Roekens, E., 2016. Sources of the PM10 aerosol in Flanders, Belgium, and re-assessment of the contribution from wood burning. Science of the Total Environment. 562: 550–560.
Mkoma, S.L., Kawamura, K., Tachibana, E., and Fu, P., 2014. Stable carbon and nitrogen isotopic compositions of tropical atmospheric aerosols: sources and contribution from burning of C3 and C4 plants to organic aerosols. Tellus B: Chemical and Physical Meteorology. 66: 20176.
Nunes, T.V, and Pio, C.A., 1993. Carbonaceous aerosols in industrial and coastal atmospheres. Atmospheric Environment. Part A. General Topics 27: 1339–1346.
Panda, S., Sharma, S.K., Mahapatra, P.S., Panda, U., Rath, S., Mahapatra, M., Mandal, T.K., and Das, T., 2016. Organic and elemental carbon variation in PM2.5 over megacity Delhi and Bhubaneswar, a semi-urban coastal site in India. Natural Hazards. 80: 1709–1728.
Pani, S.K., Chantara, S., Khamkaew, C., Lee, C.T., and Lin, N.H., 2019. Biomass burning in the northern peninsular Southeast Asia: Aerosol chemical profile and potential exposure. Atmospheric Research. 224: 180–195.
Pengchai, P., Chantara, S., Sopajaree, K., Wangkarn, S., Tengcharoenkul, U., and Rayanakorn, M., 2008. Seasonal variation, risk assessment and source estimation of PM10 and PM10-bound PAHs in the ambient air of Chiang Mai and Lamphun, Thailand. Environmental Monitoring and Assessment. 154: 197.
Pongpiachan, S., Ho, K., and Junji Cao, J. 2014. Effects of biomass and agricultural waste burnings on diurnal variation and vertical distribution of OC/EC in Hat-Yai City, Thailand. Asian Journal of Applied Sciences. 7: 360-374.
Pongpiachan, S., Pongnailert, S., Ho, K., and Cao, J. 2014. Diurnal variation and vertical distribution of carbonaceous aerosols in the southern part of Thailand. Artificial Intelligence Review. 183: 63-74.
Punsompong, P., and Chantara, S., 2019. Identification of potential sources of PM10 pollution from biomass burning in northern Thailand using statistical analysis of trajectories. Atmospheric Pollution Research. 9: 1038–1051.
Qi, M., Jiang, L., Liu, Y., Xiong, Q., Sun, C., Li, X., Zhao, W., and Yang, X., 2018. Analysis of the characteristics and sources of carbonaceous aerosols in PM2.5 in the Beijing, Tianjin, and Langfang Region, China. International Journal of Environmental Research and Public Health. 15: 1483.
Rushdi, A., El-Mubarak, A., Lijotra, L., Al-Otaibi, M., Qurban, M., Al-Mutlaq, K. and Simoneit, B. 2017. Characteristics of organic compounds in aerosol particulate matter from Dhahran city, Saudi Arabia. Arabian Journal of Chemistry. 10: 3532–3547.
Saarikoski, S., Timonen, H., Saarnio, K., Aurela, M., Järvi, L., Keronen, P., Kerminen, V.M., and Hillamo, R., 2008. Sources of organic carbon in fine particulate matter in northern European urban air. Atmospheric Chemistry and Physics. 8: 6281–6295.
Safai, P.D., Raju, M.P., Rao, P.S., P., and Pandithurai, G., 2014. Characterization of carbonaceous aerosols over the urban tropical location and a new approach to evaluate their climatic importance. Atmospheric Environment. 92: 493–500.
Schwarz, J., Chi, X., Maenhaut, W., Civiš, M., Hovorka, J., and Smolík, J., 2008. Elemental and organic carbon in atmospheric aerosols at downtown and suburban sites in Prague. Atmospheric Research. 90: 287–302.
Simoneit, B.R.T, Schauer, J.J., Nolte, C.G., Oros, D.R., Elias, V.O., Fraser, M.P., Rogge, W.F., and Cass, G.R., 1999. Levoglucosan, a tracer for cellulose in biomass burning and atmospheric particles. Atmospheric Environment. 33: 173–182.
Simoneit, B.R.T., 2002. Biomass burning - a review of organic tracers for smoke from incomplete combustion. Applied Geochemistry. 17: 129–162.
Simoneit, B.R.T., Elias, V.O., Kobayashi, M., Kawamura, K., Rushdi, A.I., Medeiros, P.M., Rogge, W.F., and Didyk, B.M., 2004. Sugars dominant water-soluble organic compounds in soils and characterization as tracers in atmospheric particulate matter. Environmental Science Technology. 38: 5939–5949.
Simpson, C., Dills, R., Katz, B. and Kalman, D. 2004. Determination of levoglucosan in atmospheric fine particulate matter. Journal of the Air & Waste Management Association (1995). 54: 689–694.
Sullivan, A.P., Holden, A.S., Patterson, L.A., McMeeking, G.R., Kreidenweis, S.M., Malm, W.C., Hao, W.M., Wold, C.E., and Collett, J.L., 2008. A method for smoke marker measurements and its potential application for determining the contribution of biomass burning from wildfires and prescribed fires to ambient PM2.5 organic carbon. Journal of Geophysical Research Atmospheres. 113: D22302.
Thepnuan, D., Chantara, S., Lee, C.T., Lin, N.H., and Tsai, Y.I., 2019. Molecular markers for biomass burning associated with the characterization of PM2.5 and component sources during dry season haze episodes in Upper South East Asia. Science of The Total Environment. 658: 708–722.
Tsai, Y.I., Wu, P.L., Hsu, Y.T., and Yang, C.R., 2010. Anhydrosugar and sugar alcohol organic markers associated with carboxylic acids in particulate matter from incense burning. Atmospheric Environment. 44: 3708–3718.
Turekian, V.C., Macko, S., Ballentine, D., Swap, R.J., and Garstang, M., 1998. Causes of bulk carbon and nitrogen isotopic fractionations in the products of vegetation burns: laboratory studies. Chemical Geology. 152: 181–192.
Wang, G., Yao, J., Zeng, Y., Huang, Y., Qian, Y., Liu, W., Li, Y., Yuan, N., Liu, S., Yuan, N., and Shan, J., 2013. Source apportionment of carbonaceous particulate matter in a Shanghai suburb Based on carbon isotope composition. Aerosol Science and Technology. 47: 239–248.
Ward, T.J., Hamilton Jr, R.F., Dixon, R.W., Paulsen, M., and Simpson, C.D., 2006. Characterization and evaluation of smoke tracers in PM: Results from the 2003 Montana wildfire season. Atmospheric Environment. 40: 7005–7017.
Watson, J.G., 2002. Visibility: science and regulation. Journal of the Air Waste Management Association (1995). 52: 628–713.
Watson, J.G., Chow, J.C., and Houck, J.E., 2001. PM2.5 chemical source profiles for vehicle exhaust, vegetative burning, geological material, and coal burning in Northwestern Colorado during 1995. Chemosphere. 43: 1141–1151.
Widory, D., and Javoy, M., 2003. The carbon isotope composition of atmospheric CO2 in Paris. Earth and Planetary Science Letters. 215: 289–298.
Widory, D., Roy, S., Le Moullec, Y., Goupil, G., Cocherie, A., and Guerrot, C., 2004. The origin of atmospheric particles in Paris: A view through carbon and lead isotopes. Atmospheric Environment. 38: 953–961.
Xin, W., Kang, S., Rupakheti, M., Zhang, Q., Tripathee, L., Guo, J., Chen, P., Rupakheti, D., Panday, A., Lawrence, M., et al. 2018. Molecular characterization of organic aerosols in the Kathmandu valley, Nepal: Insights into primary and secondary sources. Atmospheric Chemistry and Physics Discussions. 1–45.
Yadav, I., Devi, N., Li, J., Syed, J.H., Zhang, G., and Watanabe, H., 2017. Biomass burning in Indo-china Peninsula and its impacts on regional air quality and global climate change-a review. Environmental Pollution. 227: 414–427.
Yoneyama, T., Okada, H., and Ando, S., 2010. Seasonal variations in natural 13C abundances in C3 and C4 plants collected in Thailand and the Philippines. Soil Science Plant Nutrition. 56: 422–426.
Yoneyama, T., Okada, H., Chongpraditnum, P., Ando, S., Prasertsak, P., and Hirai, K., 2006. Effects of vegetation and cultivation on δ13C values of soil organic carbon and estimation of its turnover in Asian tropics: A case study in Thailand. Soil Science and Plant Nutrition. 52: 95–102.
Zhang, Y.X., Shao, M., Zhang, Y.H., Zeng, L.M., He, L.Y., Zhu, B., Wei, Y.J. and Zhu, X.L. 2007. Source profiles of particulate organic matters emitted from cereal straw burnings. Journal of Environmental Sciences. 19: 167–175.
Zhang, T., Cao, J.J., Chow, J.C., Shen, Z.X., Ho, K.F., Ho, S. S.H., Liu, S.X., Han, Y.M., Watson, J.G., Wang, G.H., et al. 2014. Characterization and seasonal variations of levoglucosan in fine particulate matter in Xi’an, China. Journal of the Air and Waste Management Association. 64: 1317–1327.
Zhao, R., Mungall, E.L., Lee, A.K.Y., Aljawhary, D., and Abbatt, J.P.D., 2014. Aqueous-phase photooxidation of levoglucosan; a mechanistic study using aerosol time-of-flight chemical ionization mass spectrometry (Aerosol ToF-CIMS). Atmospheric Chemistry and Physics. 14: 9695–9705.
OPEN access freely available online
Chiang Mai University Journal of Natural Sciences [ISSN 16851994]
Chiang Mai University, Thailand
https://cmuj.cmu.ac.th
Sawaeng Kawichai1, 2, Tippawan Prapamontol1,*, Fang Cao2, Xiao - Yan Liu2, Wen - Huai Song2, Suchart Kiatwattanacharoen1,3, and Yan - Lin Zhang2**
1 Research Institute for Health Sciences (RIHES), Chiang Mai University, Chiang Mai 50200, Thailand.
2 Yale – NUIST Center on Atmospheric Environment, Nanjing University of Information Science and Technology, Nanjing, Jiangsu
210044, China.
3 Department of Radiologic Technology, Faculty of Associated Medical Sciences, Chiang Mai University, Chiang Mai 50200, Thailand.
Corresponding author:
- Tippawan Prapamontol
E-mail:tippawan.prapamontol@cmu.ac.th
- Yan - Lin Zhang
E-mail: dryanlinzhang@outlook.com
Total Article Views
Editor: Korakot Nganvongpanit,
Chiang Mai University, Thailand
Article history:
Received: May 3, 2021;
Revised: July 27, 2021;
Accepted: July 30, 2021;