 ISSN: 2822-0838 Online

Boundary Detection of Pigs in Pens Based on Adaptive Thresholding Using an Integral Image and Adaptive Partitioning
Prawit Buayai, Tatpong Kantanukul, Carson K. Leung, and Kanda Runapongsa Saikaew*Published Date : 2018-04-01
DOI : https://doi.org/10.12982/CMUJNS.2017.0012
Journal Issues : Number 2 ,April - June 2017
ABSTRACT
Boundary detection of pigs is important to pig weight estimation, pig feeding behavior analysis, and thermal comfort control. This research proposes a boundary detection method for pigs in a feeder zone with a high-density pen under insufficient and varied lighting, a dirty pen scene, and small field of view. The method is based on adaptive thresholding using an integral image and adaptive partitioning. First, we segment an original grayscale image with adaptive thresholding using an integral image, and then apply adaptive partitioning with connected components. Afterwards, we utilize the maximum entropy threshold of each partition and merge the results. Our experimental results using 230 images showed that the proposed method led to a high average detection rate in a short execution time. Moreover, to the best of our knowledge, our study is the first attempt to investigate pig boundary detection in a practical farm environment, which involved dirty pen scenes with insufficient and varied lighting.
Keywords: Pig boundary detection, Image segmentation, Adaptive partitioning, Adaptive thresholding
INTRODUCTION
Several studies ( Shao and Xin, 2008; Wang et al., 2008; Tu et al., 2013, 2014; Guo et al., 2014, 2015; Kashiha et al., 2014; Khoramshahi et al., 2014) have investigated boundary detection, identification, and behavior analysis of pigs from above (top-view) the pen. Research on the efficiency of methods for boundary detection of pigs is primarily to improve subsequent tasks, such as identifying pigs. Several applications require pig boundary detection, including estimating pig weight (Brandl and Jørgensen, 1996; Wang et al., 2008; Kashiha et al., 2014; Kongsro, 2014; Li et al., 2015; Wongsriworaphon et al., 2015), feeding behavior analysis (Bigelow and Houpt, 1988; Haer and Merks, 1992; Young and Lawrence, 1994; Pourmoayed et al., 2016), and thermal comfort control for group-housed pigs (Shao and Xin, 2008). Some current machine vision systems for pig detection use either a general method, such as Generalized Hough Transform (Kashiha et al., 2014), a threshold intensity value with the exact background color (for example, black color) that differs from pig colors (Wang et al. 2008), or global thresholding (Shao and Xin, 2008). However, the Generalized Hough Transform method requires a controlled environment, including sufficient light and a clean pen ( Shao and Xin, 2008; Wang et al., 2008; Kashiha et al., 2014). Unfortunately, this method cannot be used in real situations, as pig farms have complex scenery (e.g., light changes, urine stains, water stains, and manure). Given this, a popular method for pig boundary detection is background subtraction based on a Gaussian Mixture Model (GMM) (Tu et al., 2013; Guo et al., 2014), which works with complex scenes. However, this method is computationally intensive ( Tu et al., 2013; Guo et al., 2014). Guo et al. (2015) developed a computationally less intensive method that uses only a single frame image; their method could detect pigs based on adaptive partitioning and multilevel thresholding segmentation (Guo et al., 2014). Yet, detecting pigs in images of a complex scene with high pen density remains a challenge (Kashiha et al., 2014).
Several threshold segmentation methods have been developed. Kapur et al. (1985) proposed the usage of maximum entropy thresholding. Chang et al. (2006) compared entropy and relative entropy thresholding techniques. Bradley and Roth (2007) studied adaptive thresholding using an integral image; their solution is more robust for illumination changes, and simple and easy to implement. However, the images obtained in our pig pen have a smaller field of view and more complex scene (many illumination changes). As a preview, we employ this threshold segmentation and use multiple experimental comparisons.
Our article proposes a method for pig boundary detection based on Adaptive Thresholding using Integral Image (ATI) and adaptive partitioning; this separates connected components into each sub-block. Multiple thresholding applies a threshold to each sub-block. To the best of our knowledge, this is the first publication that attempts to detect pig boundaries in a real-world pig pen with complex scenes and high pen density.
MATERIALS AND METHODS
Materials
To evaluate the accuracy of our boundary detection method, we used KPTECH HDA-270 cameras to collect video images from the top view of the feeder zone of a real-world pen. The images were recorded in an H.264 encoder, with a frame rate of 23 frames per second, a frame width of 1280 pixels, a frame height of 720 pixels, a focal length of 3.5 millimeters, and a sensor size of 1/3 inches. The distance between floor and cameras was 1.84 meters. Four cameras captured 23 pigs in two pens on November 16, 2015, from 07:00 to 19:00. Two hundred thirty images were selected manually for the evaluation boundary detection method. Each pig was represented with ten images.
Method
Our proposed method works with a single frame image. The process is diagramed in Figure 1.
In the first step, we convert a single frame top view of the feeder zone image into a grayscale image.
In the second step, we enhance the image using histogram equalization. This method is simple and effective for enhancing images with a large dynamic range (Guo et al., 2015). Afterwards, we segment the images with adaptive thresholding using an integral image (Bradley and Roth, 2007) with a window size of 250 x 250 pixels.
In the third step, we process morphologically to segment results for reducing noise using an image opening method with a disk structuring element with a radius fixed at 15 pixels. We then apply a flood-fill operation to fill the holes in foreground boundaries.
In the fourth step, we determine the connected components from the first segmentation result and apply adaptive partitioning to sub-blocks with each connected component. The sub- locks are polygons. Sub-blocks with an area of less than a 5% of an image pixel area are removed, because a connected area smaller than a certain value cannot be a pig boundary.
In the fifth step, we apply the maximum entropy threshold (Kapur et al., 1985) to each sub-block and merge the results from each sub-block. In the sixth and seventh steps, we repeat steps three and four, after which each sub-block is a pig boundary candidate.
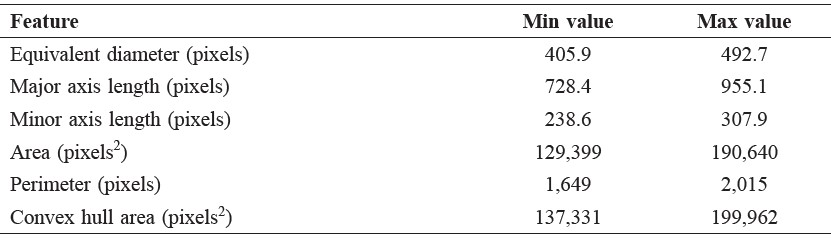
In the final step, we manually filter each boundary candidate. Table 1 depicts the minimum and maximum values of 230 labeled pig boundaries (1 boundary per image). The pigs were between 20-24 weeks old and weighed between 87-119 kg. Then, we extended the minimum and maximum values by 30% to confirm that the features could cover the weight range of adult pigs and used these values to filter each boundary. After this step, we obtained the expected pig boundary. In each image, more than one pig boundary can be detected.
To test the effectiveness of our method, we set the following criteria to evaluate the detected boundary: (1) positive result when the image contains at least one boundary and (2) negative result when the image contains no boundary.
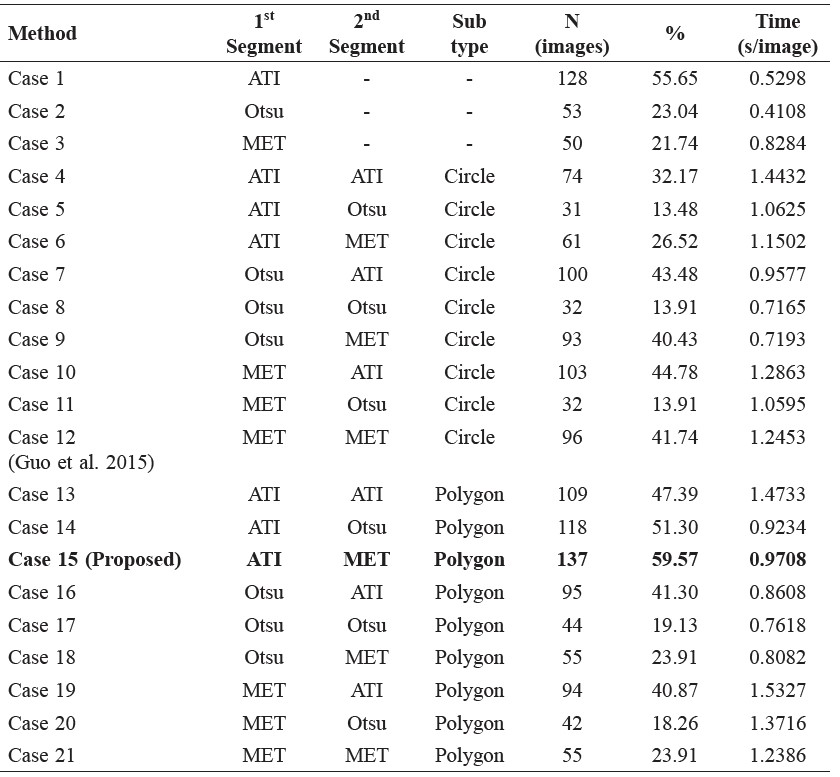
We examined all combinations of: (1) different methods (Otsu’s method (Otsu), Maximum Entropy Thresholding (MET), and Adaptive Thresholding using an Integral Image (ATI)); (2) various shapes of sub-blocks (circle and polygon); and (3) threshold levels (single and multi-level thresholds). Here, a single threshold covers an entire region of the image, and a multi-level threshold applies a threshold to each sub-block.
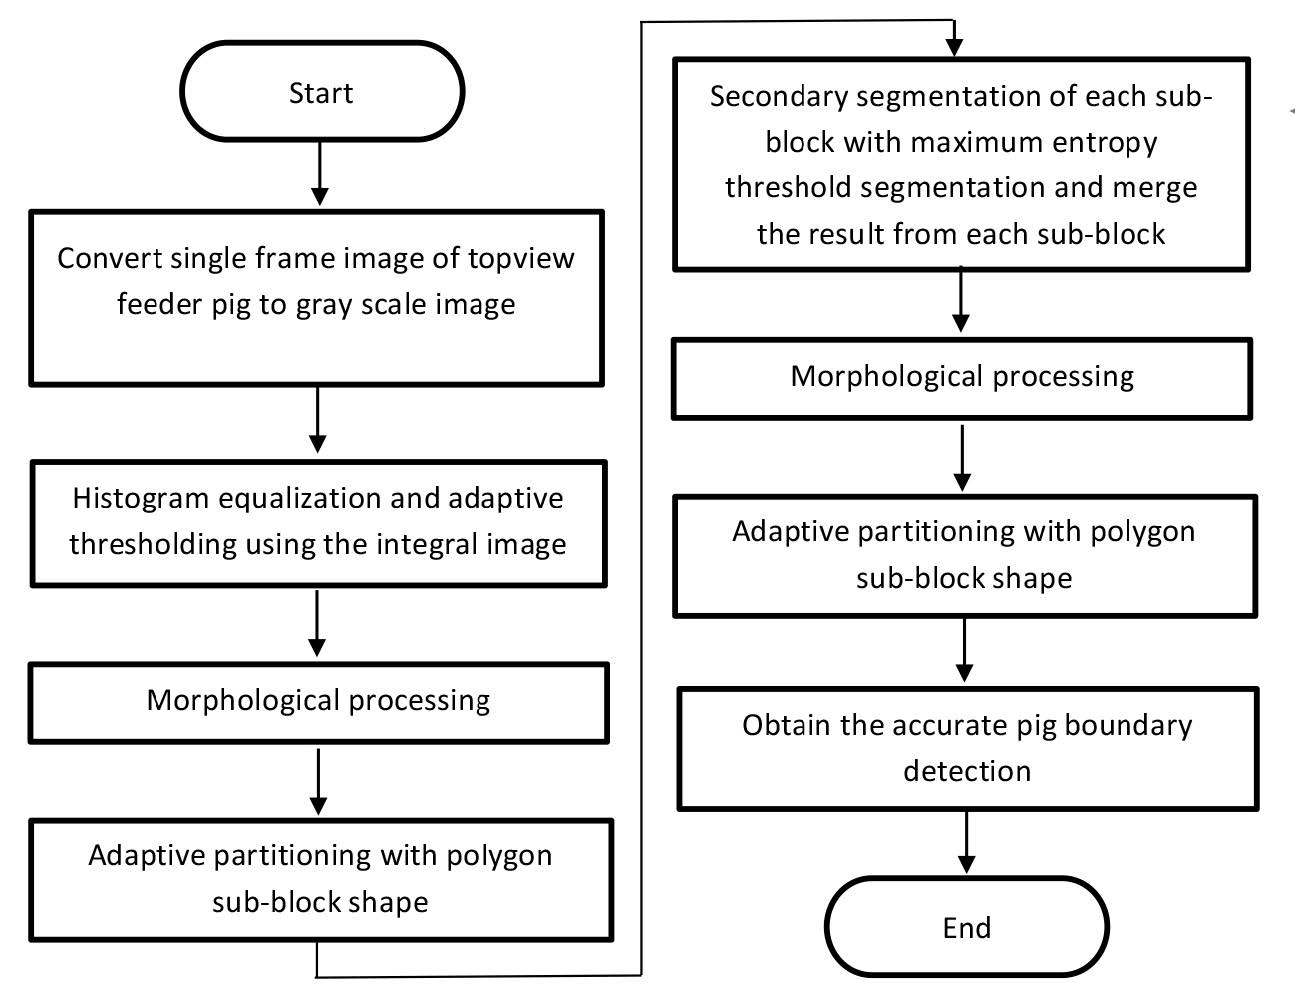
Figure 1. Flowchart of the proposed pig boundary detection method.
Table 1. The minimum and maximum values of boundaries.
RESULTS
In this study, it is difficult to detect pig boundaries in the images as shown in Figure 2. Figure 2a shows the dirty and uneven lighting in the pen; Figure 2b shows the high pen density.
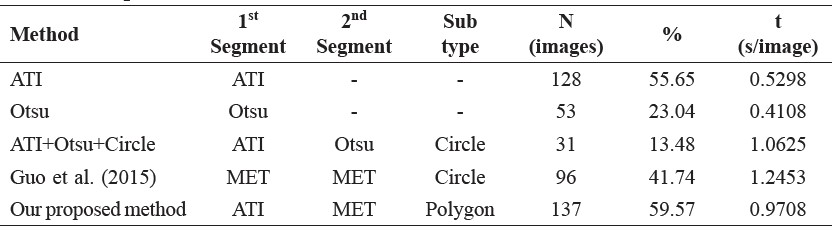
Results of these combinations are shown in Appendix A, with selective combinations shown in Table 2 Experimental Results. The results show that our proposed method led to the highest accuracy, as it detected boundaries in 137 out of 230 images (59.6%) with an elapsed time of 0.9708 seconds per image. Figure 3a shows an original image in this research. Figure 3b shows a grayscale image. Figures 3a and 3b look similar because of the camera in a low-light environment on a grayscale mode, but they are different in color space and structure. The original image uses a RGB color space with an array structure of 1,280 x 720 x 3. But the grayscale image uses a grayscale color space with an array structure of 1,280 x 720 x 1. Figure 4a shows a histogram equalization image. Figure 4b illustrates the result of ATI. Figure 4c demonstrates the result of morphological processing and flood-filling. Figure 5a shows each adaptive partitioning. Figure 5b illustrates the result of thresholding each partition with MET. Figure 5c shows the final result of boundaries detection. We also implemented the method proposed by Guo et al. (2015), as shown in Figures 6 and 7.
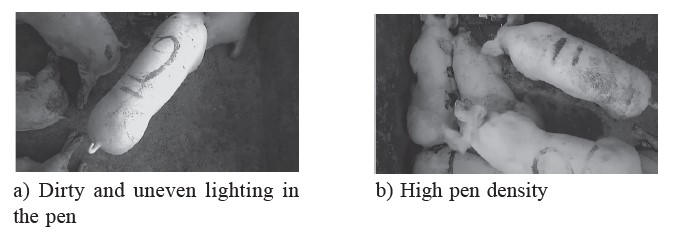
Figure 2. Examples of complex scenes.
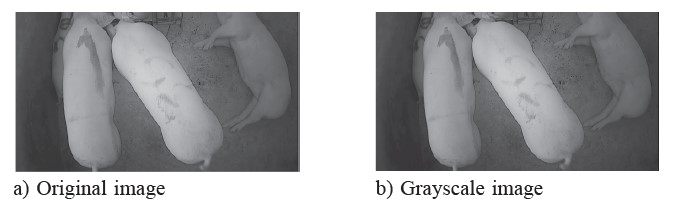
Figure 3. The original image and grayscale image are used in this study.
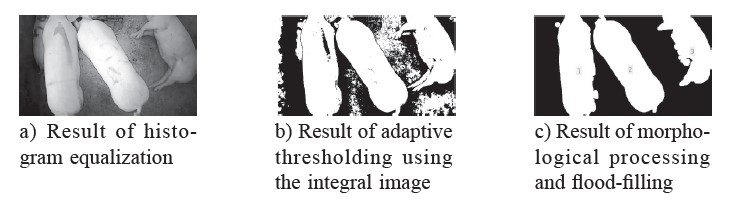
Figure 4. The proposed result of initial segmentation with adaptive thresholding using the integral image.
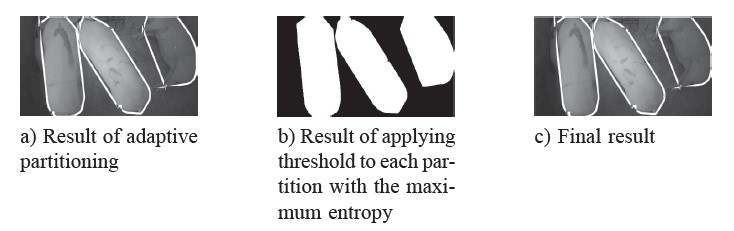
Figure 5. The proposed adaptive partition and final result.
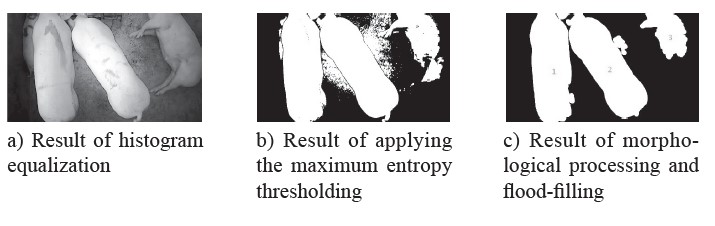
Figure 6. The result of initial segmentation with maximum entropy thresholding using the method of Guo et al. (2015).
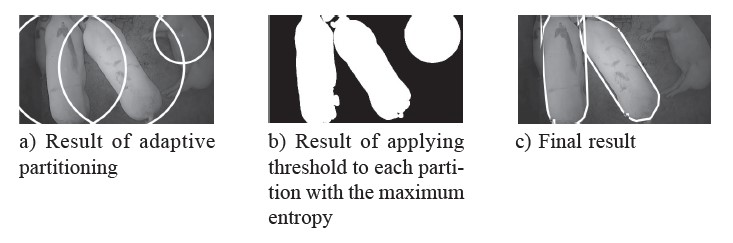
Figure 7. The adaptive partition and final result using the method of Guo et al. (2015).
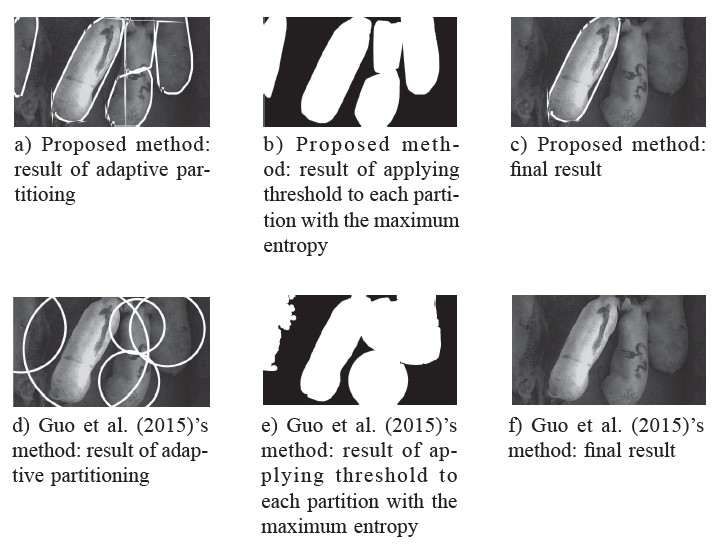
Figure 8. Comparison between proposed method and Guo et al. (2015)’s method.
Table 2. Experimental results.
DISCUSSION
Our proposed method has a better average detection rate because it uses ATI for the first threshold method and a sub-block shape is connected with components that are not overlapped.
ATI (our proposed method – Figure 4b) handles uneven illumination better than MET (Guo et al., 2015 – Figure 6b). ATI computes the average of an s x s window of pixels centered on each pixel. This is a better average for comparison, since it considers neighboring pixels on all sides. Each window of pixels represent multiple threshold values. This is in contrast to MET, which divides the image into two classes. When the sum of their average entropy is maximized, the largest amount of information can be gained from the image that is an optimal threshold value. MET has only one optimal threshold value per image. Therefore, ATI is more flexible than MET. However, ATI is limited by the need to find the optimal window size. In the case of a foreground component that is larger than s x s pixels, the center of the component will be incorrectly classified as background. This problem can be mitigated by using a larger window size. However, fine details in the segmentation may then be lost.
In our proposed method, a sub-block shape is connected with components that are not overlapped. Comparing Figures 8a and 8d shows that using a subblock circle shape creates an overlap, because the field of view in this study is small; Figure 7a shows that the sub-block circle shapes are not fitted, and the background and foreground colors look almost the same. When applying the threshold to each sub-block, the overlap region between sub-blocks has a high probability of merging into the same region.
Our proposed method is a new approach for boundary detection of pigs in pens based on adaptive thresholding using an integral image and adaptive partitioning. We focused on the images with immediate illumination changes and dynamic background in the scenes. Compared with existing statistical background subtraction methods, such as the method based on a Gaussian mixture model, our proposed method not only has a lower computational complexity, but also is more effective. Our proposed method detected pig boundaries at nearly 60%, the
highest rate. In addition, as it was tested with images taken on an actual farm in Thailand, it has been shown to be effective in real-world situations; it thus offers potential for use in pig behavior analysis applications, such as weight estimation, feeding behavior, and control temperature.
ACKNOWLEDGEMENTS
This study was funded by the Betagro Public Company Limited and the E-SAAN Center for Business and Economic Research (ECBER), Thailand. The authors would like to acknowledge Ananya pig pens in Nongruea and the Faculty of Agriculture pig pens, Khon Kaen University, Khon Kaen Province, Thailand for allowing us to collect data.
APPENDIX A. The Performance Evaluation of Different Methods
Table A displays the number of images in which pig boundaries were detected using different methods. The last column shows the execution time of boundary detection.
Table A. The accuracy and execution time of different methods.
REFERENCES
Bigelow, J.A., and R.T. Houpt. 1988. Feeding and drinking patterns in young pigs. Physiology & Behavior. 43(1): 99-109.
Bradley, D., and G. Roth. 2007. Adaptive thresholding using the integral image. Journal of graphics, GPU, and game tools. 12(2): 13-21.
Brandl, N., and J. Erik. 1996. Determination of live weight of pigs from dimensions measured using image analysis. Computers and Electronics in Agriculture. 15(1): 57-72.
Chang, C.I, Y. Du, and J. Wang. 2006. Survey and comparative analysis of entropy and relative entropy thresholding techniques. IEE Proceedings - Vision, Image and Signal Processing. 153(6): 837-850.
Guo, Y., Z. Weixing, J. Pengpeng, and C. Jiali. 2014. Foreground detection of group-housed pigs based on the combination of mixture of gaussians using prediction mechanism and threshold segmentation. Biosystems Engineering. 125: 98-104.
Guo, Y., Z. Weixing, J. Pengpeng, M. Chang-hua, and Y. Jian-jun. 2015. Multi-object extraction from topview group-housed pig images based on adaptive partitioning and multilevel thresholding segmentation. Biosystems Engineering. 135: 54-60.
Haer, L.C.M. D., and J.W.M. Merks. 1992. Patterns of daily food intake in growing pigs. Animal Production. 54(1): 95-104.
Kapur, J.N., P.K. Sahoo, and A.K.C. Wong. 1985. A new method for gray-level picture thresholding using the entropy of the histogram. Computer Vision, Graphics, and Image Processing. 29(3): 273-285.
Kashiha, M., C. Bahr, O. Sanne, P.H.M., Christel, A.N. Theo, O.O. Frank, and B. Daniel. 2014. Automatic weight estimation of individual pigs using image analysis. Computers and Electronics in Agriculture. 107: 38-44.
Khoramshahi, E., H. Juha, V. Anna, Y. Jinhyeon, and P. Matti. 2014. Real-time recognition of sows in video: a supervised approach. Information Processing in Agriculture. 1(1): 73-81.
Kongsro, J. 2014. Estimation of pig weight using a microsoft kinect prototype imaging system. Computers and Electronics in Agriculture. 109: 32-35.
Li, Z., T. Mao, T. Liu, and G. Teng. 2015. Comparison and optimization of pig mass estimation models based on machine vision. Transactions of the Chinese Society of Agricultural Engineering. 31(2): 155-161.
Otsu, N. 1979. A threshold selection method from gray-level histograms.” IEEE Transactions on Systems, Man, and Cybernetics. 9(1): 62-66.
Pourmoayed, R., R.N. Lars, and R.K. Anders. 2016. A hierarchical markov decision process modeling feeding and marketing decisions of growing pigs. European Journal of Operational Research. 250(3): 925-938.
Shao, B. and X. Hongwei. 2008. A real-time computer vision assessment and control of thermal comfort for group-housed pigs. Computers and Electronics in Agriculture. 62(1): 15-21.
Tu, G.J., K. Henrik, P. Lene Juul, and J. Erik. 2013. Foreground detection using loopy belief propagation. Biosystems Engineering. 116(1): 88-96.
Tu, G.J., K. Henrik, P. Lene Juul, and J. Erik. 2014. Segmentation of sows in farrowing pens. IET Image Processing. 8(1): 56-68(12).
Wang, Y., W. Yang, P. Winter, and L. Walker. 2008. Walk-through weighing of pigs using machine vision and an artificial neural network. Biosystems Engineering. 100(1): 117-125.
Wongsriworaphon, A., A. Banchar, and P. Supachai. 2015. An approach based on digital image analysis to estimate the live weights of pigs in farm environments. Computers and Electronics in Agriculture. 115: 26-33.
Young, R.J., and A.B. Lawrence. 1994. Feeding behaviour of pigs in groups monitored by a computerized feeding system. Animal Science. 58(1): 145-152.
Prawit Buayai1, Tatpong Kantanukul1, Carson K. Leung2 and Kanda Runapongsa Saikaew1*
1 Faculty of Engineering, Khon Kaen University, Khon Kaen 40002, Thailand
2 Faculty of Science, University of Manitoba, Winnipeg, MB, R3T 2N2, Canada
*Corresponding author. E-mail: krunapon@kku.ac.th
Total Article Views