 ISSN: 2822-0838 Online

Environmental Services of Urban Trees in Chiang Mai University, Thailand Using i-Tree Tools
Elsa Grace Stocking and Watit Khokthong*Published Date : September 9, 2025
DOI : https://doi.org/10.12982/NLSC.2025.071
Journal Issues : Number 4, October-December 2025
Abstract Urban tree inventories provide valuable insights into environmental and economic benefits, particularly in the context of climate change mitigation and ecosystem services. This study integrated geographic information systems (GIS) and web-based applications with spatial ecology methods to analyze urban trees within the main campus of Chiang Mai University (CMU), Thailand. Using i-Tree tools, including i-Tree Eco, i-Tree Canopy, and the i-Tree database, a tree inventory in 2022 was conducted to assess environmental services. The study identified the three most prevalent tree species: Tectona grandis, Butea monosperma, and Cassia fistula. The i-Tree Eco analysis estimated that urban trees stored 929 tons of carbon, sequestered 42.73 tons of carbon annually, removed 434.9 kilograms of air pollutants, and prevented 1,114 cubic meters of runoff. These findings highlight the significance of i-Tree as a web-based tool for quantifying urban tree benefits, particularly in addressing climate-related challenges such as air pollution. Future efforts should focus on continuous data collection and annual parameter updates to enhance the accuracy and applicability of i-Tree for users in Thailand and beyond.
Keywords: Ecosystem services, Urban tree inventory, Plant database, Geographic information system
Funding: The authors are grateful for the research funding provided by Chiang Mai University, Chiang Mai, Thailand.
Citation: Stocking, E.G. and Khokthong, W. 2025. Environmental services of urban trees in Chiang Mai University, Thailand using i-Tree tools. Natural and Life Sciences Communications. 24(4): e2025071.
INTRODUCTION
Over the decades, Thailand has seen changes in rainfall patterns and an increase in temperatures due to the effects of climate change (Amnuaylojaroen, 2021). Locally in Thailand, there are huge climate issues and consequences from air pollution being faced, including extreme weather and heat, and the effects of these environmental issues will get more severe due to climate change (Keeratikasikorn and Bonafoni, 2018). This is also considered a global threat, especially atmospheric carbon dioxide as a greenhouse gas (Chaichaloempreecha et al., 2022). Most of Thailand's natural forest areas are found in the northern region, which has significant carbon stocks (Suwannarat et al., 2024) and is crucial to reducing global warming in the current climate. Besides, the urban ecosystems in this region especially need today’s climate actions as a method of mitigating global warming. Related to this, urban forestry areas in Thailand are the key to mitigating climate change and greenhouse gas emissions (Uttaruk et al., 2024). Thai cities, including Chiang Mai, contain urban trees that help mitigate the heat island effect, where higher temperatures are found in the cities (Rinchumphu et al., 2024).
Trees outside forests and urban trees are necessary to optimize human well-being. Thereby combating some of these environmental and subsequent health issues, urban trees provide key environmental services. Quantifying the environmental services that trees in urban areas can be assessed; for example, urban trees have been shown to alter exchanges in temperature, pollution, and humidity (Grylls and van Reeuwijk, 2022) and absorb runoff (Livesley et al., 2016). An additional important ecosystem service that urban trees provide is cooling effects (Bowler et al., 2010; Wang et al., 2020), which shows the possibility to be able to counteract the impact of the urban heat islands (Rahman et al., 2020). Moreover, surrounding trees are proven to be a vital part of green infrastructure as thermal comfort (Rahman et al., 2020; Alonzo et al., 2021; Tochaiwat et al., 2023). One example of an environmental service that urban trees provide to help improve climate problems is air pollution removal due to their large surface area, by adhering to, depositing, or absorbing particulate matter onto leaf surfaces (Isaifan and Baldauf, 2020; Yao et al., 2022). However, the extent of air quality improvement does differ across tree species due to specific functional traits (Pumas, 2024) and species efficiency, which include canopy density, water-use strategy, and foliage longevity (Grote et al., 2016). It has also been indicated that where the trees and urban vegetation are spatially contributing to differing outcomes in pollution removal, for example, roadside vegetation and recreational parks show a high capacity to reduce the levels of air pollution (Biswal et al., 2022). Further to this, urban trees have great practical significance to green residential communities.
Greenery has shown a link between urban trees and a positive effect on mental health. The increase of urban trees and green spaces is important to the aesthetic value of the landscape, which can help bring in tourism, areas for recreation, and an active lifestyle (Russo, 2024). In the Chiang Mai University (CMU) area, where there is a high volume of students, and people working, nearby living, or visiting, CMU puts a strong focus on the United Nations: Sustainable Development Goals (SDGs) (Information Technology Service Center, CMU, 2020). Promoting environmental work falls under the bracket of “Biopolis” and the most prominent SDGs addressing good health and well-being (SDG 3) and sustainable cities and communities (SDG 11). Additionally, being a carbon-neutral university is the aim for tackling greenhouse gas (CO2), which generally presents in high concentrations in urban landscapes.
CMU has a university plant database, which is the internal database of plants in Chiang Mai University (Buildings, Grounds and Facilities Division, 2020), with suitable GIS applications that store ground-based data collections. However, this database has not yet been integrated with partner databases for comprehensive analysis of the environmental services provided by the recorded trees. In addition, many recent studies have reported that urban forests can be implemented via i-Tree, showing tools to provide services for urban forestry, including the analysis of the benefits of individual trees, tree canopy assessment, and tree planting resources (https://www.itreetools.org). Their flagship i-Tree tool is the i-Tree Eco software, which evaluates tree inventories, to find individual tree benefit estimates. It can provide functional analysis into factors such as pollution removal and human health impacts, carbon sequestration and storage, hydrology effects (avoided run-off, interception, transpiration), building energy effects, tree bio-emissions, avian habitat suitability, and ultraviolet radiation (UV) tree effects (Wu et al., 2019). As well as this, it has tools for structure and composition analysis, forecasting and modeling, and management information. It does this through the use of inputted tree and climate data as well as the use of environmental models.
The i-Tree’s online database contains data inputted globally for tree species and different locations. This data includes specificities of species traits and climate data, which is used in models to predict ecosystem services. More specifically, field data and hourly air pollution and meteorological data are used in the environmental models. The i-Tree can quantify the benefits and value of trees, advocate for better tree and forest management, and provide standardized metrics for carbon offset plans (https://www.itreetools.org). There have been thousands of studies throughout the globe that use i-Tree to assess the benefits and ecosystem services of urban trees and city forests, the majority of which are based in North America and Europe. In Asia, there are examples of studies in Beijing, China (Gong et al., 2022); however, there have been no studies looking at Northern Thailand, where located in a different climate zone (Internet Geography World Climate Zone, 2023).
From ground-based surveys, measuring tree height and stem diameter in particular standing tree’s coordinates can be linked to environmental services of urban trees and spatially explicit analysis. This study looked at the importance of urban trees inside CMU, Chiang Mai, Thailand, as issues to urban green space, which can show impacts on tackling some of the climate change problems and resilience of the urban ecosystem. We deployed and assessed the importance of urban trees on the main CMU campus associated with the online i-Tree database in 2022 (https://database.itreetools.org). The objectives of the study were to 1) estimate tree cover within CMU campus boundaries using i-Tree Canopy in 2022, and 2) explore the benefits of trees outside the forest to support urban and management strategy using tools in i-Tree Eco (https://www.itreetools.org/tools/i-tree-eco). We aim to alleviate the effects of environmental problems and make it possible to understand how much the trees are contributing to forming future green policies and urban planning.
MATERIAL AND METHODS
Study site
Chiang Mai University (CMU), Chiang Mai, Thailand, has multiple campuses, including the main campus. The main campus area is 272.45 ha., located at the base of Doi Suthep mountain, about five kilometers west of the Chiang Mai city center. The CMU main campus boundary is located between latitudes 18.79413N and 18.79988N, and longitudes between 98.94907E and 98.96377E, with an average elevation of 336 m above mean sea level (Figure 1).
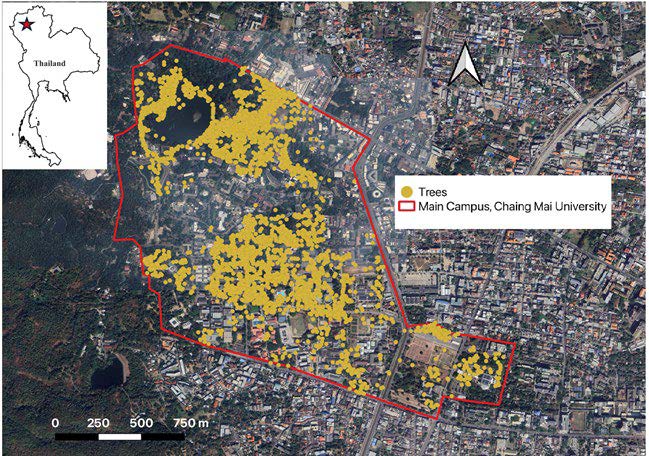
Figure 1. The distribution of urban trees at Chiang Mai University (CMU), Thailand, in 2022. The CMU boundary is outlined in a red polygon, while the locations of 4,721 individual trees (representing 61% of the initial 7,775 trees) are shown in goldenrod derived from the CMU tree database in 2022 (https://buildings.oop.cmu.ac.th/plant/index.php).
Data preparation
The original CMU tree database was collected by the Plant Information Management System, Buildings, Grounds and Facilities Division, CMU, recording data on trees within the area of the main CMU campus, accessed on August 17, 2022 (Figure 1). We created the study area inside the CMU campus, as retrieved from the Chiang Mai International Engineering School, CMU (2022). The initial data from the database contained 7,775 individual trees within the campus. We proceeded with each species individually, except the genus Lagerstroemia, representing Lagerstroemia spp., which contains Lagerstroemia calyculata, Lagerstroemia floribunda, Lagerstroemia venusta, Lagerstroemia macrocarpa, Lagerstroemia speciosa, and Lagerstroemia tomentosa.
The Plant Information Management System originally obtains variables such as tree codes (ID), including species, height in meters, circumference in inches, longitude, latitude, and, for some trees, additional information relating to evidence of pests or damage. However, some species were only recorded with the genus name as the species was not specified in the original database. We filtered by deselecting the wrong positions that showed low positional accuracy, so that not all tree species found on the database were used.
Pollution removal was estimated using available pollution and weather data located within 4 km from the study site via Air4Thai (http://air4thai.pcd.go.th) in 2022; the Chiang Mai Provincial Hall, and Yupparaj Wittayalai School, Chiang Mai. Air pollution removal in terms of ozone (O3), carbon monoxide (CO), nitrogen dioxide (NO2), particulate matter less than 2.5 microns (PM2.5), particulate matter less than 10 microns and greater than 2.5 microns (PM10), and sulfur dioxide (SO2) were estimated via i-Tree Eco (Figure 2).
i-Tree Eco
User submission of these tree data is key before analyzing structure and composition. The original database required extensive editing and processing to fit the requirement to be inputted and uploaded onto i-Tree Eco (https://www.itreetools.org) for further analysis of other relevant performances (Figure 2). The minimum requirements of i-Tree Eco include species and diameter at breast height (DBH). In this study, additional data, including height, location, and ID number of each tree, were added. We checked all the trees' positions and their recorded information with QGIS. Trees with erroneous geographic coordinates or incomplete records on species name, height, or stem circumference were excluded from the analysis. The retrieved tree data in 2022 at the main CMU campus, with sufficient and accurate data, resulted in 4,721 individual trees (61%, from the initial 7,775 trees) that could be added to the i-Tree Eco. Additionally, according to the original data of all tree heights above 30 meters, their heights ranged between 5-10 meters. Here, the height was stated as one meter above its range; for example, a height above 30 meters as a value of 31, was used. If the value is stated as between two values, for example, 30-35 m, then the mean value (32.5 m) was used. According to the GPS coordinates, some original spreadsheets contained incorrect tree locations. Trees located more than 10 m outside the study area boundary, due to substantial positional errors from GPS devices (Lin 2014), were removed before importing the data into the i-Tree database using QGIS. Further to this, the i-Tree Eco requires DBH values, not circumference values, which were originally recorded; to do this, all circumferences were divided by π.
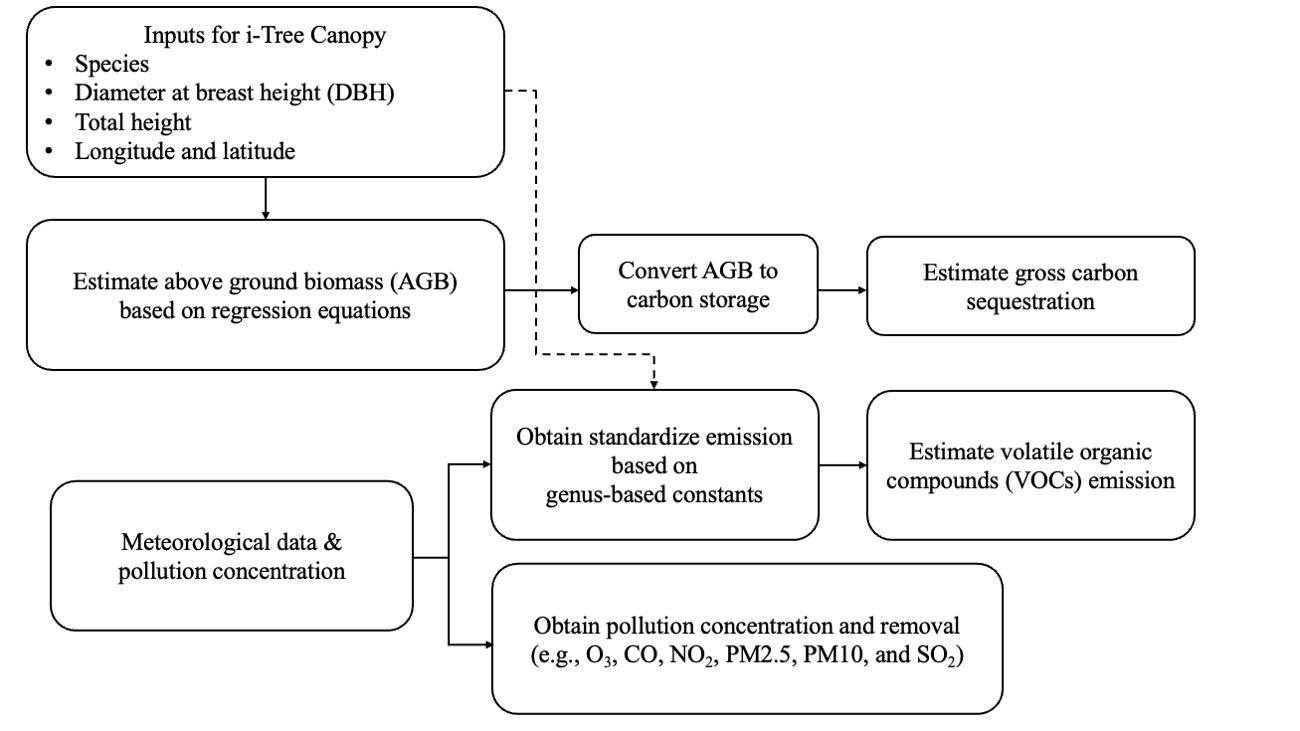
Figure 2. Input variables, procedures in i-Tree Eco, and output variables.
The base models for biomass estimation in dry forest areas were from Chave et al. (2005), using equation 1;
Aboveground biomass (kg) = 0.112 × (ρD2H)0.916 (1)
Where ρ = wood specific gravity (g/cm3), D = trunk diameter (cm), and H = tree height (m). The model (Eq. 1) was applied for biomass estimation in i-Tree Eco (Nowak, 2021).
Multiple species-specific equations were combined into a single predictive formula to cover a wide range of tree diameters and avoid inconsistencies in biomass estimates (Eq. 2, Nowak, 2021). If no equation existed for a species, averages from the same genus were used; if genus equations were unavailable, averages from all broadleaf species were applied (Nowak et al., 2008).
Biomass estimate (kg) = (Biomeq × WDspp) / WDeq (2)
Where Biomeq = Biomass estimates derived from equations (kg), WDspp = wood density of the species measured (metric tons/m3), and WDeq = average wood density from the carbon equations (metric tons/m3).
To reduce estimation errors, updated carbon storage and carbon sequestration—based on equations specifically developed for tropical dry areas representative of the study site—were also applied (Nowak, 2021). Carbon storage is estimated by multiplying tree biomass by 0.5 (Chow and Rolfe 1989; Nowak, 2021). To prevent carbon storage overestimation for very large trees in i-Tree Eco, total carbon sequestration is limited to a maximum of 40 kg of carbon/cm of DBH when a tree reaches 7,500 kg of carbon. Moreover, carbon equations from across the globe that are in the GlobAllomeTree in 2017 database were used (New Carbon Equations and Methods, 2021). Wood density data were added to the i-Tree database from the Global Wood Density Database (Chave et al., 2009; Zanne et al., 2009) and McPherson et al. (2016). The carbon estimates, which are based on equations and a process of weighting wood densities between the actual species measured and the species equation used, were automatically estimated via i-Tree Eco (Nowak et al., 2008).
The amount of oxygen produced (Eq. 3) is estimated from carbon sequestration based on atomic weights given in Nowak et al. (2007):
Net O2 release (kg/yr) = (Net carbon sequestration (kg/yr) × 32) / 12 (3)
The amount of common air pollutants, such as O3, CO, NO2, PM2.5, PM10, and SO2, removed by the trees was estimated (Nowak et al., 2014; Bodnaruk et al., 2017). Estimates of air pollution removal are based on the area of tree cover. A local standardized removal rate (e.g., kg/m2 of tree cover) is multiplied by local tree cover (m2) from i-Tree Canopy to estimate a total effect from the trees (kg). For air pollution removal, i-Tree Eco used air pollution and weather data to estimate the average pollution removal effect per unit of tree cover (g/m2 of tree cover). This process uses local tree cover, leaf area index, percentage evergreen trees, weather, pollution, and population data to estimate pollution removal (g/m2 tree cover) in urban and rural areas for each county.
i-Tree Canopy
Since 39% of trees from the original CMU tree database could not be added to the i-Tree Eco, i-Tree Canopy was used to generate the entire tree cover area. This tool is used to classify land and tree cover across a given area using random sampling of Google Satellite base maps. We assigned the 1,004 random points as the recommendation is to plot 500-1,000 points for an accurate estimation of tree cover (Selim et al., 2022). To confirm the accuracy of the results, ground truthing was also done across the campus by ground-based surveys, following the canopy map generated at the study site. Tree cover included shrubs, and other categories of grass, impervious buildings, impervious other, impervious roads, soil/bare ground, and water.
RESULTS
The urban trees in the CMU campus had 4,721 trees with a tree cover of 3.6% according to i-Tree Eco. While the i-Tree Canopy is estimated at 45% tree/shrub. The three most common species are Tectona grandis (24.7%), Butea monosperma (11.4%), and Cassia fistula (7.0%) in Figure 3. DBH that was less than 15.2 cm was 63% (Figure 4). Trees could remove pollution by 434.9 kilograms/year. Trees stored carbon about 929 tons, resulting in carbon sequestration of about 47.1 tons (Figure 5). The species that sequestered the most significant amount of carbon was Tectona grandis with around 13.5 metric tons (Figure 5). Of the species sampled, Tectona grandis stores and sequesters the most carbon (approximately 26.7% of the total carbon stored and 36.4% of all sequestered carbon). Trees in CMU produced oxygen 113.9 tons/year and beneficially reduced surface runoff by 1,114 cubic meters/year. In 2022, O3, CO, NO2, PM2.5, PM10, and SO2 were removed about 434.9 kilograms per year with an associated value of 111,000 baht. Pollution removal was greatest for PM10 (about 50% of annual pollution removal). However, trees on the CMU campus emitted an estimated 782.1 kilograms of volatile organic compounds (VOCs) (564.8 kilograms of isoprene and 217.3 kilograms of monoterpenes). Fifty-three percent of the urban forest's VOC emissions were from Eucalyptus camaldulensis and Samanea spp.
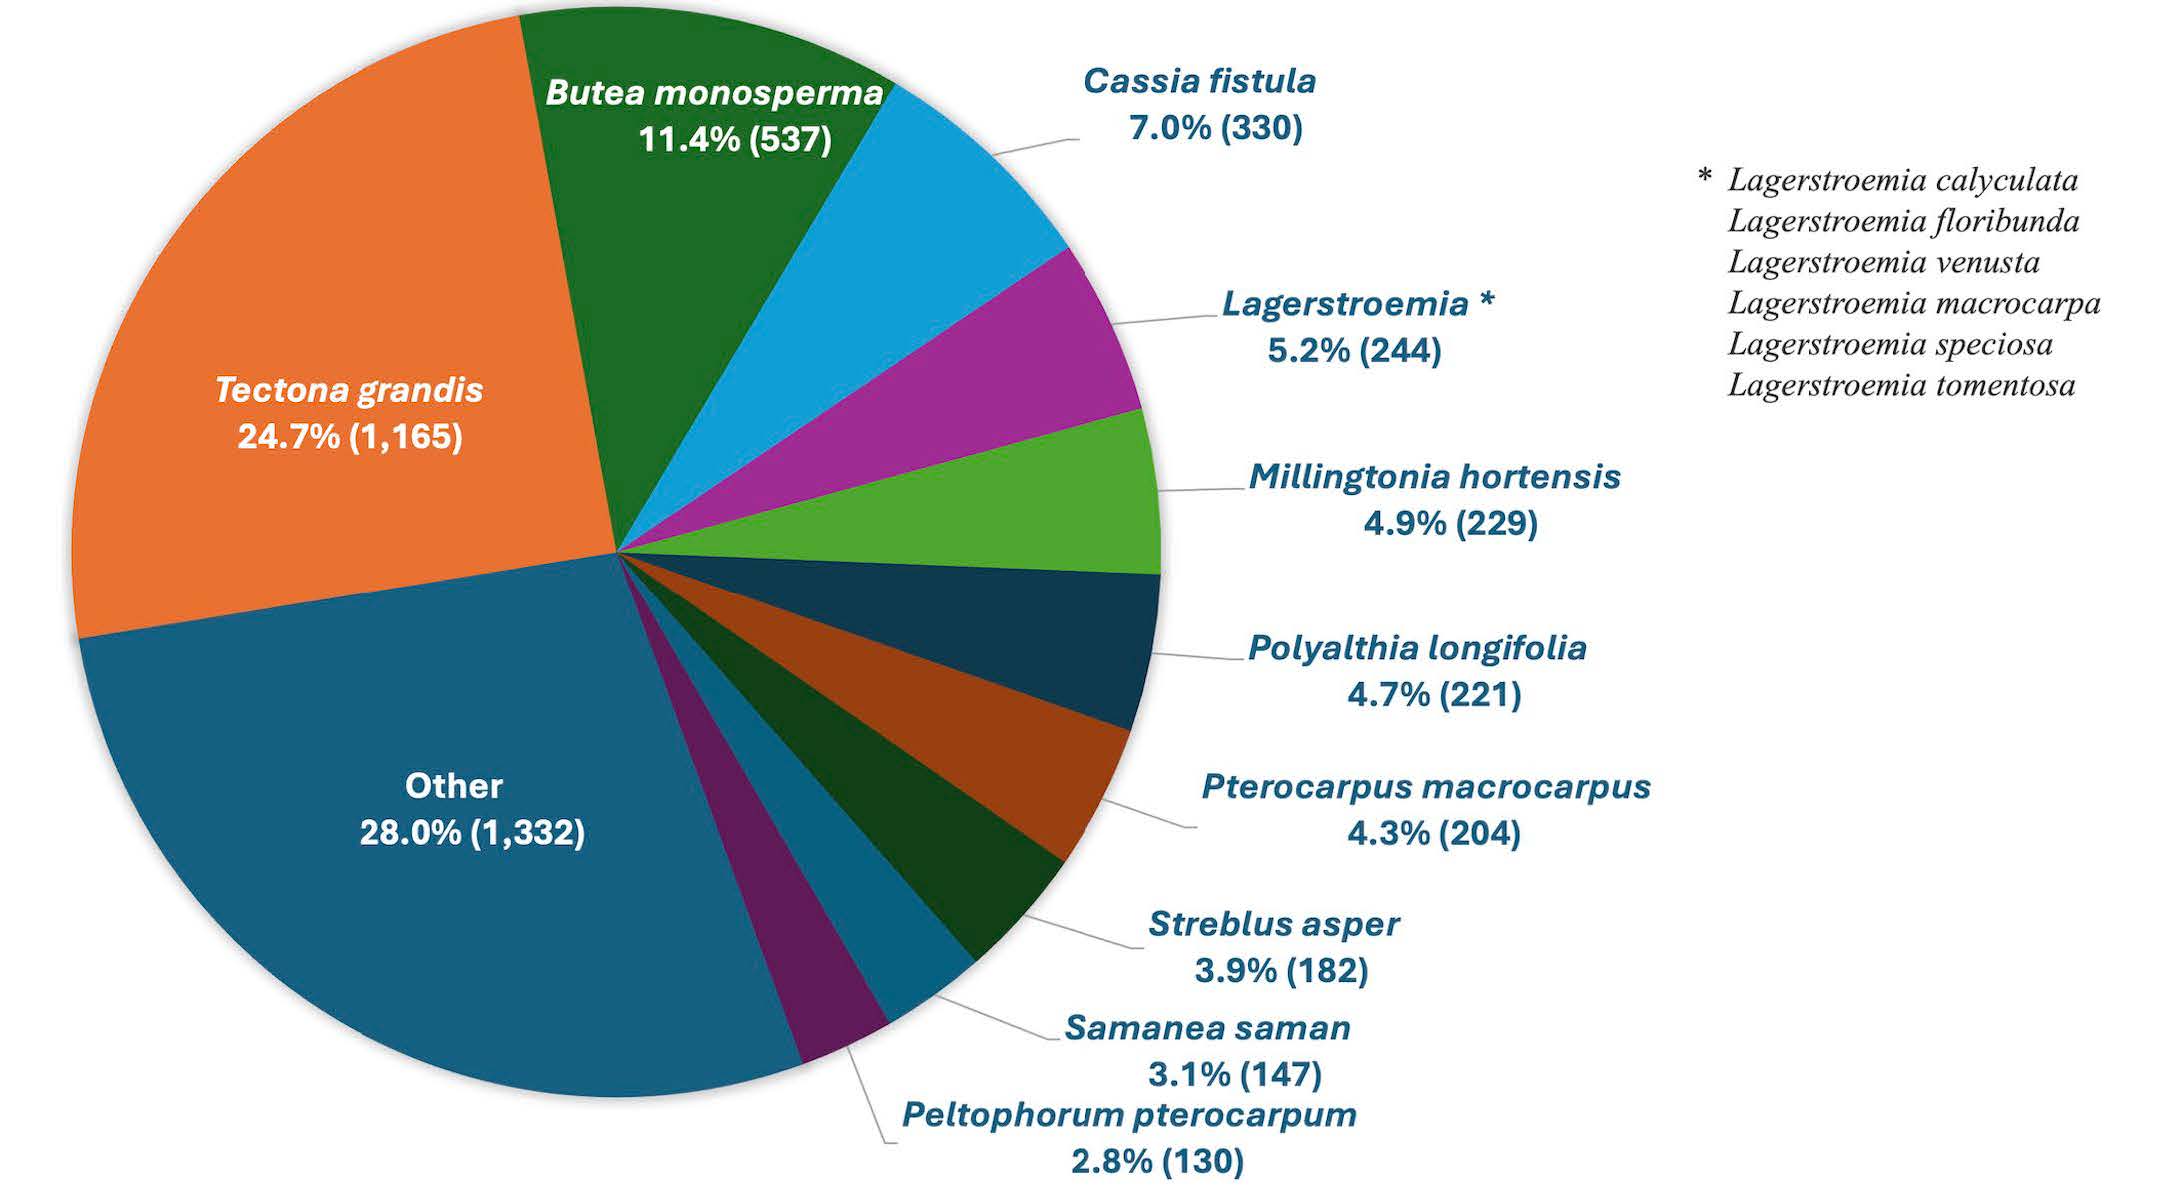
Figure 3. Tree species composition of the ten major tree species on the CMU campus (a total of 4,721 trees); numbers inside brackets represent the total number of individuals for each species.

Figure 4. Histogram of diameter at breast height (DBH) of trees on the CMU campus.

Figure 5. Estimated carbon sequestration of 10 major tree species and a total of 47.1 tons of carbon was estimated from the tree inventory.
DISCUSSION
The i-Tree models use equations from various sources, including updated carbon sequestration and storage values derived from formulas tailored to tropical dry areas like our study site (Nowak, 2021). Based on tree species, Tectona grandis was by far the most prevalent in this study and also made the most impact environmentally according to the i-Tree models, which stored and sequestered the most carbon (26.7% of the total carbon stored and 36.4% of all sequestered carbon). i-Tree Eco contributed to the environmental services that these trees on the CMU campus showed, and the study could monetize the environmental services from the urban trees. Economic values were reported in Thai baht, which can be converted at one pound being equivalent to 44 baht in 2022, which showed estimated values in pollution removal (111,000 baht/year), carbon storage (5.44 million baht/year), carbon sequestration (276,000 baht/year) and avoided runoff (90,300 baht/year). Still, values of the tree inventory in this study were analyzed from the models developed by the U.S. Forest Service, Northern Research Station, which may not be suitable for involving direct cash payments in the study location. However, the database is continuously updated and improved to refine it in subsequent versions, and this will sway the results due to the monetary incentives. Furthermore, the dataset used in 2022 was not sufficient to be analyzed by i-Tree Eco. Sixty-one percent (4,721 trees) of the CMU tree database was included, and 39% were left due to factors including insufficient species names, DBH information, and incorrectly recorded GPS coordinates. We found that most trees were small trees (63% have DBH lower than 15.2 cm) or were not fully grown, which might cause missed tree monitoring while tracking the specific trees from the standing positions. Due to this, the generated data from the i-Tree in 2022 is likely to be few amount of tree cover (3.6%) inside the CMU campus, meaning that tree cover couldn’t be calculated accurately on i-Tree Eco. Thus, an additional online tool, the i-Tree Canopy was used. The result from the i-Tree Canopy showed a significantly high amount (45%) of tree/shrub cover on the CMU campus.
To evaluate the values of tree species in CMU, data improvement and maintenance are important. The current monitoring of the CMU tree database since the current updated numbers on 4 February 2025 are 19,082 individual trees (Buildings, Grounds and Facilities Division, 2020) whereas the observation of some tree failure or no standing trees occurred (Figure 6A) and the tree tags had vanished (Figure 6B) or fallen to the ground (Figure 6C). At present, our procedure does not support real-time data updates. In addition, we had recognized that the survey did not include fallen trees, which came with limitations on the total number of trees. Integrating streamlined data management tools or mobile data-entry systems could mitigate this in future research through a more comprehensive survey protocol, because the fallen tree survey could affect the interpretation of tree species dynamics and biomass estimates. Additionally, repeating the monitoring to focus on data points and extra variables such as crown width would allow for more in-depth analyses. Moreover, a combination and comparison of i-Tree methods and field measurements would be best for accuracy and to ensure the research is comprehensive. However, the usefulness of i-Tree software when quantifying environmental services requires only species name and DBH data. Additionally, more work is needed to find practical data for specific services in the Thai climate zone, as many studies looking into these issues are not in the same climate. Furthermore, with more fields of data collected, i-Tree would be able to report on land use, crown size, condition, and percent dieback of the trees, crown light exposure, ultraviolet radiation stress, and pest risk analysis (Nowak, 2021). Moreover, the i-Tree system needs the uncertainty estimates when the inventory was collected because sampling uncertainty was the major factor, and this is due to the spatial variability of tree density and sample size (Jenerette and Herrmann, 2024).

Figure 6. Views within the study site: a failure tree (Millettia leucantha), ID 002876, on 6 July 2024 (A), located at Angkaew reservoir, CMU. A paper tag of Millettia leucantha had vanished, ID 002802 (B), and a metal tag of Tectona grandis fell to the ground, ID 002895 (C).
The benefits from i-Tree tackle current issues through human health that could be confirmed by the air pollution removal, resulting in a higher amount of particulate matter removal, more significantly PM10. A study in Rome, Italy, demonstrated a good agreement between the i-Tree predicted and measured ozone (O3) fluxes, showing that estimates for this air pollution are valid (Morani et al., 2014). In contrast to this, i-Tree particulate matter generally underestimated PM2.5 due to the lack variable of leaf traits affecting the deposition velocity among the deposition and dispersion of pollutants (Pace et al., 2021). Whether the photochemical modeling on air temperature can determine the overall effect of trees on O3 concentration, our study reveals that trees on the CMU campus had a low impact on O3 removal. Connecting to urban tree impacts on O3, a study revealed that increased urban canopy cover, particularly with low VOC-emitting species, leads to reduced O3 concentrations in cities (Nowak, 2000). Trees consistently reduce pollutant concentrations, whereas some tree species can release VOCs and allergenic particulates, which can cause adverse effects on human health. We checked tree species lists and found the tree species lists that mainly produced VOCs, which were from Eucalyptus camaldulensis and Samanea spp. Emissions vary among species based on species characteristics (e.g., some genera such as oaks are high isoprene emitters) and the amount of leaf biomass (Mu et al., 2022). Towards the green university, particularly with low VOC-emitting species, species selection is the key to reducing VOC emissions (Zhang et al., 2024).
Towards the support of low-carbon and energy-efficient cities, as well as sustainable urban practices, Chiang Mai integrated city plans with multiple environmental indicators for a progressive urban planning approach to improve quality of life while fostering sustainable growth (Pongruengkiat et al., 2023). When addressing the issues of carbon carbon-neutral university, sustainable energy consumption eventually reduces the threat to greenhouse gas emissions. CMU can focus on sustainable electric transportation and clean renewable energy. To maximize environmental services from trees at the CMU level, it would be more useful to have more holistic considerations of more i-Tree variables and i-Tree functions to calculate environmental data, especially the specific functional traits of the native tree species. For future development, validating the current results with socio-economic parameters is crucial to optimizing urban planning, particularly through cost-benefit assessments. This approach should account for hidden maintenance costs, such as tree pruning and pest control, which have been previously overlooked.
CONCLUSION
Chiang Mai University (CMU) is advancing towards environmental sustainability by emphasizing urban trees and ecosystem services as key components of its strategy. The integration of i-Tree tools and the CMU tree inventory database demonstrates significant potential for linking database systems to effectively assess and share the environmental benefits of trees. The findings highlight the research potential of urban forests in mitigating climate change and reducing human health risks. Consequently, urban green space planning on the main CMU campus can serve as a model for raising awareness among the local community, fostering the conservation of surrounding natural areas, and contributing to climate change mitigation.
ACKNOWLEDGMENTS
The authors thank the Buildings, Grounds and Facilities Division, Chiang Mai University for providing the database of the Plant Information Management System. Elsa G. Stocking thanks the Forest Restoration Research Unit (FORRU), Faculty of Science, Chiang Mai University for providing facilities during the internship.
AUTHOR CONTRIBUTIONS
Elsa G. Stocking and Watit Khokthong designed in conducted the experiments, performed the statistical analysis and data visualization, and wrote the manuscript. Elsa G. Stocking investigated and validated. Watit Khokthong supervised the project. All authors have read and approved the final manuscript.
CONFLICT OF INTEREST
The authors declare that they hold no competing interests.
REFERENCES
Alonzo, M., Baker, M.E., Gao, Y., and Shandas, V. 2021. Spatial configuration and time of day impact the magnitude of urban tree canopy cooling. Environmental Research Letters. 16(8): 084028.
Amnuaylojaroen, T. 2021. Projection of the precipitation extremes in Thailand under climate change scenario RCP8.5. Frontiers in Environmental Science. 9: 657810.
Biswal, B.K., Bolan, N., Zhu, Y.G., and Balasubramanian, R. 2022. Nature-based systems (NbS) for mitigation of stormwater and air pollution in urban areas: A review. Resources, Conservation and Recycling. 186: 106578.
Bodnaruk, E.W., Kroll, C.N., Yang, Y., Hirabayashi, S., Nowak, D.J., and Endreny, T.A. 2017. Where to plant urban trees? A spatially explicit methodology to explore ecosystem service tradeoffs. Landscape and Urban Planning. 157: 457-467.
Bowler, D.E., Buyung-Ali, L., Knight, T.M., and Pullin, A.S. 2010. Urban greening to cool towns and cities: A systematic review of the empirical evidence. Landscape and Urban Planning. 97(3): 147-155.
Buildings, Grounds and Facilities Division. 2020. Available online at https://buildings.oop.cmu.ac.th/plant/index.php (accessed September 01, 2023).
Chaichaloempreecha, A., Chunark, P., Hanaoka, T., and Limmeechokchai, B. 2022. Thailand’s mid-century greenhouse gas emission pathways to achieve the 2 degrees Celsius target. Energy, Sustainability and Society. 12(1): 22.
Chave, J., Andalo, C., Brown, S., Cairns, M.A., Chambers, J.Q., Eamus, D., Fölster, H., Fromard, F., Higuchi, N., Kira, T., et al. 2005. Tree allometry and improved estimation of carbon stocks and balance in tropical forests. Oecologia. 145: 87-99.
Chave, J., Coomes, D.A., Jansen, S., Lewis, S.L., Swenson, N.G., and Zanne, A.E. 2009. Towards a worldwide wood economics spectrum. Ecology Letters. 12(4): 351-366.
Chiang Mai International Engineering School, CMU. 2022. Available online at https://cmies.eng.cmu.ac.th/wp-content/uploads/2022/03/cmu_thep.gif (accessed September 01, 2023).
Chow, P. and Rolfe, G.L. 1989. Carbon and hydrogen contents of short-rotation biomass of five hardwood species. Wood and Fiber Science. 21(1): 30-36.
Gong, C., Xian, C., and Ouyang, Z. 2022. Assessment of NO2 purification by urban forests based on the i-Tree Eco model: Case study in Beijing, China. Forests. 13(3): 369.
Grote, R., Samson, R., Alonso, R., Amorim, J.H., Cariñanos, P., Churkina, G., Fares, S., Thiec, D.L., Niinemets, Ü., Mikkelsen, T.N., et al. 2016. Functional traits of urban trees: Air pollution mitigation potential. Frontiers in Ecology and the Environment. 14(10): 543-550.
Grylls, T. and van Reeuwijk, M. 2022. How trees affect urban air quality: It depends on the source. Atmospheric Environment. 290: 119275.
Information Technology Service Center, CMU. 2020. SDGs Chiang Mai University 2019 – 2020. Available online at https://sdgs.cmu.ac.th/content/article/SDGs-CMU-Eng.pdf (accessed February 09, 2025).
Internet Geography World Climate Zone. 2023. Internet Geography World Climate Zone. Available online at https://www.internetgeography.net/topics/what-are-climate-zones/ (accessed October 01, 2023).
Isaifan, R.J. and Baldauf, R.W., 2020. Estimating economic and environmental benefits of urban trees in desert regions. Frontiers in Ecology and Evolution. 8: 16.
Jenerette, G.D. and Herrmann, D.L. 2024. A global synthesis of reported urban tree carbon production rates and approaches. Frontiers in Ecology and Evolution. 11: 1244418.
Keeratikasikorn, C. and Bonafoni, S. 2018. Urban heat island analysis over the land use zoning plan of Bangkok by means of Landsat 8 imagery. Remote Sensing. 10(3): 440.
Lin, J.Y. 2014. Using evolutionary computation on GPS position correction. Scientific World Journal. 2014(10): 723736.
Livesley, S.J., McPherson, E.G., and Calfapietra, C. 2016. The urban forest and ecosystem services: Impacts on urban water, heat, and pollution cycles at the tree, street, and city scale. Journal of Environmental Quality. 45(1): 119-124.
McPherson, E.G., van Doorn, N.S., and Peper, P.J. 2016. Urban Tree Database and Allometric Equations. Gen. Tech. Rep. PSW-GTR-235. Albany, CA: U.S. Department of Agriculture, Forest Service, Pacific Southwest Research Station. 86 p. https://www.treesearch.fs.fed.us/pubs/52933
Morani, A., Nowak, D., Hirabayashi, S., Guidolotti, G., Medori, M., Muzzini, V., Fares, S., Mugnozza, G.S., and Calfapietra, C. 2014. Comparing i-Tree modeled ozone deposition with field measurements in a periurban Mediterranean forest. Environmental Pollution. 195: 202-209.
Mu, Z., Llusià, J., Zeng, J., Zhang, Y., Asensio, D., Yang, K., Yi, Z., Wang, X., and Peñuelas, J. 2022. An overview of the isoprenoid emissions from tropical plant species. Frontiers in Plant Science. 13: 833030.
New Carbon Equations and Methods. 2021. Available online at http://www.globallometree.org (accessed October 01, 2023).
Nowak, D., Crane, D., Stevens, J., Hoehn, R., Walton, J., and Bond, J. 2008. A ground-based method of assessing the urban forest structure and ecosystem services. Arboriculture and Urban Forestry. 34: 347–358.
Nowak, D.J. 2021. Understanding i-Tree: Summary of programs and methods. USDA Forest Service, WI 53726, USA. Available online at https://www.fs.usda.gov/nrs/pubs/gtr/gtrnrs200-2021.pdf. (accessed February 06, 2025).
Nowak, D.J., Civerolo, K.L., Rao, S.T., Sistla, G., Luley, C.J., and Crane, D.E. 2000. A modeling study of the impact of urban trees on ozone. Atmospheric Environment. 34(10): 1601–1613.
Nowak, D.J., Hirabayshi, S., Ellis, E., and Greenfield, E. 2014. Tree and forest effects on air quality and human health in the United States. Environmental Pollution. 193: 119–129.
Nowak, D.J., Hoehn, R.H., and Crane, D.E. 2007. Oxygen production by urban trees in the United States. Arboriculture and Urban Forestry. 33(3): 220–226.
Pace, R., Guidolotti, G., Baldacchini, C., Pallozzi, E., Grote, R., Nowak, D.J., and Calfapietra, C. 2021. Comparing i-Tree Eco estimates of particulate matter deposition with leaf and canopy measurements in an urban Mediterranean Holm oak forest. Environmental Science & Technology. 55(10): 6613-6622.
Pongruengkiat, W., Tippayawong, K.Y., Aggarangsi, P., Pichayapan, P., Katongtung, T., and Tippayawong, N. 2023. Assessing sustainability of Chiang Mai urban development. Discover Sustainability. 4: 54(2023).
Pumas, P. 2024. Evaluation of particulate matter deposition efficiency and air quality improvement by vertical shrub and climber walls. Natural and Life Sciences Communications. 23(3): e2024038.
Rahman, M.A., Stratopoulos, L.M., Moser-Reischl, A., Zölch, T., Häberle, K.H., Rötzer, T., Pretzsch, H., and Pauleit, S., 2020. Traits of trees for cooling urban heat islands: A meta-analysis. Building and Environment. 170: 106606.
Rinchumphu, D., Srivanit, M., Iamchuen, N., and Aryupong, C. 2024. Exploring summer variations of driving factors affecting land use zoning based on the surface urban heat island in Chiang Mai, Thailand. ISPRS International Journal of Geo-Information. 13(7): 228.
Russo, A. 2024. Urban green spaces and healthy living: A landscape architecture perspective. Urban Science. 8: 213.
Selim, S., Dönmez, B., and Kilçik, A. 2022. Determination of the optimum number of sample points to classify land cover types and estimate the contribution of trees on ecosystem services using the i-Tree Canopy tool. Integrated Environmental Assessment and Management. 19: 726–734.
Suwannarat, W., Suwanprasert, S., Pothong, T., Kullasoot, S., Sapewisut, P., Kasithikasikham, R., Phalaraksh, C., Khokthong, W., and Sareein, N. 2024. Forest carbon estimation using two vegetation structural indices derived from terrestrial laser scanner: Vegetation area index and leaf area index. Chiang Mai Journal of Science. 51(6): e2024101.
Tochaiwat, K., Phichetkunbodee, N., Suppakittpaisarn, P., Rinchumphu, D., Tepweerakun, S., Kridakorn Na Ayutthaya, T., and Sittisom, P. 2023. Eco-efficiency of green infrastructure on thermal comfort of outdoor space design. Sustainability. 15: 2566.
Uttaruk, Y., Laosuwan, T., Sangpradid, S., Butthep, C., Rotjanakusol, T., Sittiwong, W., and Nilrit, S. 2024. Thailand’s urban forestry programs are assisted by calculations of their ecological properties and economic values. Land. 13: 1440.
Wang, J., Zhou, W., Jiao, M., Zheng, Z., Ren, T., and Zhang, Q. 2020. Significant effects of ecological context on urban trees’ cooling efficiency. ISPRS Journal of Photogrammetry and Remote Sensing. 159: 78-89.
Wu, J., Wang, Y., Qiu, S., and Peng, J. 2019. Using the modified i-Tree Eco model to quantify air pollution removal by urban vegetation. Science of The Total Environment. 688: 673–683.
Yao, Y., Wang, Y., Ni, Z., Chen, S., and Xia, B. 2022. Improving air quality in Guangzhou with urban green infrastructure planning: An i-Tree Eco model study. Journal of Cleaner Production. 369: 133372.
Zanne, A.E., Lopez-Gonzalez, G., Coomes, D.A., Ilic, J., Jansen, S., Lewis, S.L., Miller, R.B., Swenson, N.G., Wiemann, M.C., and Chave, J. 2009. Towards a worldwide wood economics spectrum. Ecology Letters. 12: 351–366.
Zhang, B., Jia, Y., Bai, G., Han, H., Yang, W., Xie, W., and Li, L. 2024. Characterizing BVOC emissions of common plant species in northern China using real world measurements: Towards strategic species selection to minimize ozone forming potential of urban greening. Urban Forestry and Urban Greening. 96: 128341.
OPEN access freely available online
Natural and Life Sciences Communications
Chiang Mai University, Thailand. https://cmuj.cmu.ac.th
Elsa Grace Stocking1 and Watit Khokthong2, 3, *
1 Department of Earth and Environmental Science, School of Natural Sciences, Faculty of Science and Engineering, University of Manchester, Manchester M13 9PL, United Kingdom.
2 Forest Restoration Research Unit, Faculty of Science, Chiang Mai University, Chiang Mai 50200, Thailand.
3 Department of Biology, Faculty of Science, Chiang Mai University, Chiang Mai 50200, Thailand.
Corresponding author: Watit Khokthong, E-mail: watit.khokthong@cmu.ac.th
ORCID: Watit Khokthong: https://orcid.org/0000-0002-1156-3605
Total Article Views
Editor: Sirasit Srinuanpan,
Chiang Mai University, Thailand
Article history:
Received: February 21, 2025;
Revised: August 12, 2025;
Accepted: August 13, 2025;
Online First: September 9, 2025