 ISSN: 2822-0838 Online

Subchronic Exposure to Nickel-Cadmium Contaminated Water Induced Metabolic Disruptions in Wistar Albino Rats
Augustine Apiamu, Uduenevwo Francis Evuen*, Samson Eruke Okoro, Enyohwo Dennis Kpomah, Precious Ifeakachukwu Odeh, Chinedum Martins Ekeleme, Chiedu Onyinye Emeninwa, and Samuel Ogheneovo AsagbaPublished Date : July 30, 2025
DOI : https://doi.org/10.12982/NLSC.2025.058
Journal Issues : Number 4, October-December 2025
Abstract Metabolic alterations resulting in the onset of diverse disease conditions are often implicated by exposure of susceptible biota to a load of contaminants. This empirical investigation embraced the potential metabolic health risk associated with the intake of potable water contaminated by different doses of cadmium (Cd) and nickel (Ni) at optimized conditions in male Wistar albino rats. The contamination of the water by Cd (0-150 mg/L) and Ni (0-150 mg/L), and the 20-60 days exposure of rat models as input factors led to seventeen treatment combinations (N=17) with three replications (n=3) in each case using the Box-Behnken design (BBD). Predictive markers, which included blood glucose level (BGL), atherogenic index of plasma (AIP), cardiac risk ratio (CRR) and atherogenic coefficient (AC) were analyzed using blood samples to ascertain metabolic changes. Moreover, four quadratically fit models for the markers with regression coefficient (r2 values) above 98 %, and no significant lack of fit (P >0.05) respectively were developed. These models further revealed a synergistic interaction between Cd and Ni through the three-dimension (3D) surface plots, resulting in a predictively significant increase of BGL (18.93 ± 0.88 mg/dL), AIP (0.31 ± 0.01), CRR (3.52 ± 0.10), and AC (3.48 ± 0.06) at P ≤0.05. Findings from this investigation strongly suggest potential health indications of hyperglycemia (with the likelihood of diabetes), dyslipidemia and cardiovascular disorder linked with the synergistic interactions of the metals in potable water ingested by predisposed rats at established experimental doses.
Keywords: Heavy metals, Toxicity, Water, Risk assessment
Citation: Apiamu, A., Evuen, U.F., Okoro, S.E., Kpomah, E.D., Odeh, P.I., Ekeleme, C.M., Emeninwa, C.O., and Asagba, S.O. 2025. Subchronic exposure to nickel-cadmium contaminated water induced metabolic disruptions in Wistar Albino rats. Natural and Life Sciences Communications. 24(4): e2025058.
INTRODUCTION
Heavy metal contamination of drinking water is a growing global concern due to its adverse effects on human health and ecosystems. Among the numerous contaminants, nickel (Ni) and cadmium (Cd) are particularly alarming because of their prevalence in industrial waste, agricultural runoff, and urban pollution (WHO, 2011; Haidar et al., 2023; Swangneat et al., 2024). These metals are well-known for their persistence in the environment and tendency to bioaccumulate in living beings, resulting in long-term exposure and considerable health hazards (Ferryanto et al., 2022; Perrelli et al., 2022; Khalil et al., 2023; Ruksachat et al., 2023). Although the carcinogenic and nephrotoxic effects of Ni and Cd have been well documented, their potential role in mediating metabolic disruptions specifically, hyperglycemia, dyslipidemia, and cardiovascular risks, have only recently garnered attention (Alonso-Magdalena et al., 2019; Sevim et al., 2020; Haidar et al., 2023).
Metabolic illnesses, such as diabetes and cardiovascular disease (CVDs), are major public health concerns around the world with rising prevalence and mortality rates (Sevim et al. 2020; Yang et al., 2020). These disorders have multiple causes, including genetic predisposition, lifestyle factors, and environmental exposures. While lifestyle factors such as nutrition and physical inactivity are well understood, the function of environmental toxicants such as Ni and Cd in the aetiology of metabolic diseases is a new topic of study (Buha et al., 2020; Huang et al., 2022). Subchronic exposure to these metals, even at low levels, has been linked to disruptions in glucose metabolism and lipid homeostasis, potentially resulting in hyperglycemia, dyslipidaemia, and elevated cardiovascular risk (Buha et al., 2020; Haidar et al., 2023). Nickel and cadmium cause detrimental effects through a variety of underlying mechanisms. Cadmium, for example, causes oxidative stress by producing reactive oxygen species (ROS) that can harm cellular components and impair normal metabolic processes (Apiamu et al., 2022). This oxidative stress is associated with insulin resistance, a major component in the development of type 2 diabetes (Liu et al., 2015; Orr and Bridges, 2017), which is distinguished by the onset of hyperglycemia. This metabolic observation is also occasioned by Cd-mediated upregulation of hepatic enzymes of the gluconeogenic pathway that include glucose-6-phosphatase, pyruvate carboxylase and fructose-1,6-bisphosphatase among others (Edwards and Prozialeck, 2009). In addition, studies have emphasized that Cd-mediated hyperglycemia is associated with impairment of glucose transporter (Hong et al., 2021). Nickel, on the other hand, interferes with glucose metabolism and may alter insulin signalling pathways, further contributing to hyperglycemia and related metabolic disturbances (Min et al., 2014; Liu et al., 2015; Haidar et al., 2023).
Nickel and Cadmium have been seen to have an impact on lipid metabolism individually causing dyslipidemia—a state of elevated or reduced amounts of lipids in the bloodstream, which is an increased risk factor for CVDs (Wang and Xu, 2014; Ali and Khan, 2018; Sevim et al., 2020; Tien et al., 2023). Moreover, Yang and other researchers noted that raised Cd levels lead to lipid accumulation pro-inflammatory with the sign of stroke, atherosclerosis and other CVDs with the level of pro-inflammatory Lysophosphatidyl Cholines also raised (Yang et al., 2016; Lamas et al., 2021). Similarly, Ni toxicity enhanced the cluster differentiation 68 (CD68), increased monocyte adherence, as well as the elevation of pro-inflammatory cytokines, such as C-reactive protein (CRP), TNF-α, and IL-6 at early stage CVDs and atherosclerosis (Dagar et al., 2021).
Regardless of the growing information suggesting Ni and Cd are associated with various metabolic disorders, subchronic impacts and more importantly, the combined toxic effect of both metals have not received exhaustive investigations. The vast majority of the current work has been concerned with the study of the toxicity of the individual metal ions, and such studies inadequately model complex environmental situations where more than one toxicant is present at a time (Nordberg et al., 2015; Apiamu and Asagba, 2021). Moreover, there are few analyses of the dose-response effects and the combinations of long-term Ni-Cd exposure on metabolic consequences. Thus, this study addressed these gaps by objectively evaluating the long-term impacts of Nickel-Cadmium contaminated potable water on albino rats’ metabolic profiles that included blood glucose level and atherogenic indices. To determine the dose–response relationships and interaction effects of these metals, the study employed the Box-Behnken Design (BBD) response surface methodology that provided a characterization of how subchronic Ni and Cd exposure transmits cardio-metabolic disruptions.
MATERIALS AND METHODS
Chemicals/assay kits/assay protocols
All the chemicals utilized in this research work were of analytical reagent status and were procured from standard chemical vendors. Cadmium chloride (CdCl₂) and nickel sulphate (NiSO₄) were purchased from Sigma Aldrich Chemical Company Limited, St. Louis, Missouri, USA. Distilled water was employed in the preparation of all solutions for the different experiments including the nickel-cadmium-contaminated drinking water for the experimental animals. Additionally, biochemical determinations of fasting blood glucose, total cholesterol (TC), triglycerides (TG), and high-density lipoprotein cholesterol (HDL-C) were performed using standard enzymatic colorimetric methods with commercially available reagent kits, following the manufacturer’s instructions (Randox Laboratories Ltd., Crumlin, UK; Agape Diagnostics, Switzerland; Teco Diagnostics, USA). All assays were conducted in duplicate to ensure reliability, and absorbance readings were measured using a UV-visible spectrophotometer (Spectronic Genesys 10, Thermo Fisher Scientific, USA).
Animal Selection
A total of 34 male Wistar albino rats (Rattus norvegicus) of six to eight weeks old weighing 172.62 ± 30.09 grams were used in this study. The animals were obtained from a reputable animal breeding facility situated at the School of Basic Medical Sciences of the Delta State University, Abraka, Nigeria., and were housed in clean, well-ventilated seventeen metabolic cages containing two experimental animals each under controlled laboratory conditions (temperature 27 ± 2°C, 12-hour light/dark cycle, relative humidity 50–60 %). Prior to commencement of the experiments, the animals were given a two-week period of adaptation. Both groups were maintained on standard rat chow and water intake was unrestricted during the course of the study. All experimental protocols were conducted in accordance with the guidelines of the Institutional Animal Care and Use Committee (IACUC) and adhered to the National Institute of Health's (NIH) Guide for the Care and Use of Laboratory Animals. Therefore, the constituted research and ethics committee of the aforementioned university considered and approved the experimental protocol on 23rd January, 2023 with reference number REI/FOS/2023/13.
Exposure protocol (Optimization)
The study employed a Box-Behnken Design (BBD), a response surface methodology (RSM) that optimized the experimental factors and generated a polynomial regression model to identify the combined effects of multiple variables. Following available literature on metal contaminants (Boxton et al., 2019; Health Canada, 2020; Apiamu et al., 2024), three independent factors were chosen for this study: cadmium dose (50, 100, and 150 mg/L), nickel dose (50, 100, and 150 mg/L), and exposure duration (20, 40, and 60 days) (Table 1).
Table 1. Application of Box-Behnken design at defined experimental conditions.
|
Experimental factors |
Symbols |
Alpha (α) level |
||
|
-1 |
0 |
+1 |
||
|
Cadmium (Cd) Level (mg/L) |
A |
50 |
100 |
150 |
|
Nickel (Ni) Level (mg/L) |
B |
50 |
100 |
150 |
|
Duration of Exposure (DE; days) |
C |
20 |
40 |
60 |
Since the experimental factors were fully crossed, the experimental design produced 17 different treatment groups (N=17) at unit alpha (α=1) level. These were done in duplicate determinations for each treatment group (n=2). In general, 34 male albino rats were used in the experiment. The control to this experiment involved using normal tap water to the animals devoid of any Ni or Cd while the other groups were given different administrations of the metals in their drinking water for different time intervals. The response function (Y) of the current investigation, as affected by the three experimental factors, was defined in terms of a general second-order regression model (Eq. 1), where it explained the nature of interactions (whether potentiation, antagonism or synergism) among the factors and their impacts on the responses examined in this study.

In the general regression model, Y functions as the measured response for the respective bioindicators in the present study such that β0, β1-3, β11-13 and β21-23 were considered as model intercept, linear, interactive and quadratic coefficients of the experimental factors respectively. The numerical optimization strategy (NOS) was also initiated in the study in a bid to ascertain the optimal nature of interactions of the contaminants and their possible effects on the investigated responses, as occasioned by continuous intake of the tainted drinking water. This was actualized by setting the experimental factors and the measurable endpoints at their maximum levels of exposure and response.
Blood sampling/biochemical analyses
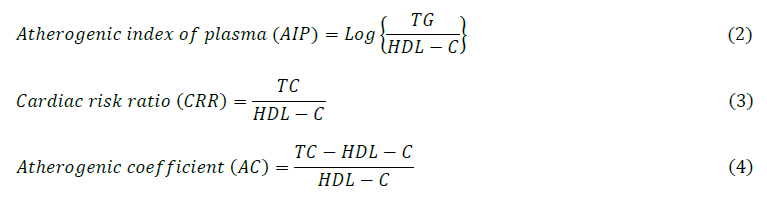
At the end of the respective exposure durations, animals were fasted overnight, and blood samples were collected via retro-orbital puncture under light anaesthesia (ketamine, 50 mg/kg and xylazine, 10 mg/Kg administered intraperitoneally) into plain containers. The collected blood samples were allowed to clot for 30 minutes and then centrifuged at 3,000 rpm for 10 minutes to obtain plasma. The plasma samples were aliquoted and stored at -20°C until further biochemical analyses. Subsequently, the procured diagnostic assay kits were employed to evaluate blood glucose level (BGL), total cholesterol (TC), triglycerides (TG) and high-density lipoprotein cholesterol (HDL-C). Thus, the atherogenic indices predicting the risk of metabolic disruptions were further evaluated using the developed models hereunder (Eq. 2-4);
Determination of blood Glucose Level (BGL)
Blood glucose concentration was measured using the glucose oxidase-peroxidase (GOD-POD) method as described by Trinder (1969). In this reaction, glucose is oxidised by glucose oxidase to gluconic acid and hydrogen peroxide. The hydrogen peroxide then reacts with 4-aminophenazone and phenol in the presence of peroxidase to produce a red quinoneimine complex, which was measured spectrophotometrically at 500 nm.
Determination of Total cholesterol (TC)
Total cholesterol was estimated using the cholesterol oxidase–peroxidase (CHOD-POD) method as described by Allain et al. (1974). Cholesterol esters are first hydrolyzed by cholesterol esterase to free cholesterol, which is then oxidized to cholest-4-en-3-one and hydrogen peroxide. The hydrogen peroxide reacts with 4-aminoantipyrine and phenol in the presence of peroxidase to form a red quinoneimine dye, read at 546 nm.
Procedure
One milliliter (1 mL) of working reagent was added to labeled tubes (blank, standard, sample, control), followed by 10 µL of sample or standard. After mixing and incubation at 37°C for 5 minutes, absorbance was measured against the reagent blank.
Calculation:

Determination of Triglycerides (TG)
Triglyceride concentration was measured using the GPO-POD enzymatic method, based on the coupled reaction sequence involving lipase, glycerol kinase, glycerol phosphate oxidase (GPO), and peroxidase. The end product, a quinoneimine dye, was read at 520 nm. This method was described by Fossati and Prencipe (1982) and McGowan et al. (1983).
Procedure
One milliliter (1 mL) of TG reagent was pipetted into clean, labeled tubes. Tubes were pre-incubated at 37°C for 4 minutes, followed by addition of 10 µL of sample or standard. After 5 minutes of incubation at 37°C, absorbance was measured at 520 nm.
Calculation:

Determination of High-Density Lipoprotein Cholesterol (HDL-C)
HDL-C was determined using the precipitation method of Assmann et al. (1983). Chylomicrons, VLDL, and LDL fractions were precipitated with phosphotungstic acid and magnesium chloride. After centrifugation at 4,000 rpm for 10 minutes, HDL remained in the supernatant. This was then assayed using the CHOD-POD method described above for total cholesterol, with absorbance read at 546 nm.
Procedure
Thirty microliters (30 µL) of HDL precipitating reagent was mixed with 30 µL of serum and incubated at room temperature for 10 minutes. After centrifugation, 50 µL of the clear supernatant was used for HDL determination using 1 mL of cholesterol reagent.
Calculation:

Where N = 50 mg/dL (standard concentration), 2 = dilution factor
Determination of LDL-C and VLDL-C
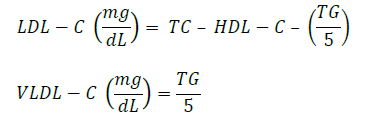
Low-density lipoprotein cholesterol (LDL-C) and very-low-density lipoprotein cholesterol (VLDL-C) were calculated using the Friedewald formula (Friedewald et al., 1972):
Data analysis
Data were analyzed using Design-Expert software (Stat-Ease, Inc., Minneapolis, USA) for the BBD and regression modelling respectively. The data were first fitted into a quadratic model to evaluate the combined effects of cadmium and nickel doses and exposure duration on the measured biochemical parameters. Analysis of variance (ANOVA) was used to determine the significance of the model terms at p ≤ 0.05. Descriptive statistics, including mean ± standard deviation (SD), were calculated for each treatment group. Post-hoc tests were conducted to identify significant differences between the groups, and Pearson’s correlation analysis was performed to assess the relationships between the variables.
RESULTS
Three dimensional (3D) surface models
The mean values of responses (BGL, AIP, CRR & AC) generated under the present experimental conditions (Table 2) were fed into the experimental design for analysis of variance (ANOVA), three-dimensional (3D) graphical plots, development of regression models and their characterizations. Consequently, the ANOVA indicated the generation of four regression models for BGL, AIP, CRR and AC with marked significant differences (P <0.05), where the selection and integration of the experimental factors into the said models were dependent on their degree of significance (Table 1-4). In clarity, the p-values (prob >F) of the developed regression models were low (<0.0001), suggesting that the terms included in the model differ markedly (P <0.05). The developed regression models (Eq. 6-9) were used, through the marked participation of the experimental factors, for accurate prediction of the responses at optimal conditions.
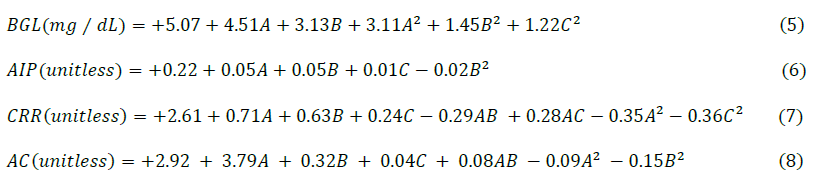
Table 2. The experimental determinants and quantification of bioindicators required for predictive metabolic disorders.
|
SN |
Experimental factors |
Experimental responses |
|||||
|
Cd (mg/L) |
Ni (mg/L) |
DE (days) |
BGL (mg/dL) |
AIP |
CRR |
AC |
|
|
1 |
100 |
100 |
40 |
4.87 |
0.22 |
2.68 |
2.88 |
|
2 |
150 |
150 |
40 |
17.47 |
0.28 |
3.47 |
3.42 |
|
3 |
100 |
100 |
40 |
4.58 |
0.21 |
2.57 |
2.88 |
|
4 |
50 |
50 |
40 |
3.35 |
0.08 |
0.64 |
2.09 |
|
5 |
100 |
100 |
40 |
4.66 |
0.22 |
2.59 |
2.86 |
|
6 |
150 |
50 |
40 |
9.36 |
0.19 |
2.75 |
2.63 |
|
7 |
150 |
100 |
60 |
14.53 |
0.28 |
3.11 |
3.27 |
|
8 |
100 |
100 |
40 |
5.68 |
0.23 |
2.55 |
2.99 |
|
9 |
100 |
50 |
20 |
4.61 |
0.14 |
1.51 |
2.39 |
|
10 |
100 |
50 |
60 |
4.90 |
0.15 |
1.93 |
2.49 |
|
11 |
150 |
100 |
20 |
14.74 |
0.25 |
1.98 |
3.18 |
|
12 |
50 |
150 |
40 |
8.36 |
0.20 |
2.50 |
2.57 |
|
13 |
100 |
150 |
60 |
10.43 |
0.27 |
3.10 |
3.11 |
|
14 |
100 |
100 |
40 |
5.57 |
0.20 |
2.66 |
2.98 |
|
15 |
50 |
100 |
20 |
4.17 |
0.13 |
1.23 |
2.35 |
|
16 |
100 |
150 |
20 |
11.03 |
0.24 |
2.78 |
3.02 |
|
17 |
50 |
100 |
60 |
4.16 |
0.16 |
1.26 |
2.46 |
Note: BGL= Blood Glucose Level; AIP = Atherogenic Index of Plasma; CRR = Cardiac Risk Ratio; AC = Atherogenic coefficient; DE = Duration of Exposure. Data of responses are expressed as mean values of triplicate determinations under specified experimental conditions.
Diagnosis and properties of models
The fit statistics characterizing the developed quadratic models are elucidated in Table 3. Specifically, the feasibility of the quadratic models to accurately predict BGL, AIP, CRR and AC under the present experimental conditions can be explained in terms of regression coefficient (r2 values), adjusted r2 values, predicted r2 values, lack of fit values and adequate precisions. First, the r2 values (0.9823, 0.9823, 0.9830 & 0.9892), for BGL, AIP, CRR and AC quadratic models accounted for over 98% of the experimental values, as influenced by the independent factors, and less than 2% of the data variability were not influenced by the said experimental conditions.
Table 3. Characterization of developed response surface models under defined experimental conditions.
|
S/N |
Responses |
Model |
r2 |
Lack of fit P-value |
Adjusted r2 |
Predicted r2 |
Adequate prediction |
|
1 |
BGL |
Quadratic |
0.9823a |
0.0668 |
0.9596 |
0.7573 |
22.53 |
|
2 |
AIP |
Quadratic |
0.9823a |
0.4924 |
0.9595 |
0.8652 |
24.79 |
|
3 |
CRR |
Quadratic |
0.9830a |
0.0672 |
0.9840 |
0.9078 |
35.84 |
|
4 |
AC |
Quadratic |
0.9892a |
0.6053 |
0.9754 |
0.9302 |
31.45 |
Note: BGL= Blood Glucose Level; AIP = Atherogenic Index of Plasma; CRR = Cardiac Risk Ratio; AC = Atherogenic coefficient and a defined the significant acceptance of the developed regression (quadratic) models for each bioindicator at P <0.05.
The findings indicated that the developed models were precise and reliable for predicting responses during exposure of male albino rats to Ni and Cd contamination of drinking water at set optimal conditions. Secondly, a linearity curve was obtained between predicted and experimental (actual) values (Figure 1). This again validated the reliability of the developed quadratic models for the predictions of the measured responses in the study. Thirdly, the lack of fit tests for the developed models was not significant (P >0.05), indicating that the experimental data were dispersedly employed for the development of the models, as they were also affected by the experimental factors. Finally, the adequate precisions of 22.53, 24.79, 31.45 and 35.84 indicated an adequate impact of the experimental factors on the responses, such as BGL, AIP, AC and CRR respectively.
Possible risks of diabetes
The interaction of two experimental factors when the third factor is fixed at optimal conditions in a bid to determine their impacts on the measured response is clearly described by a 3D surface plot (Figure 1-4). The 3D response surface plots shown in Figure 1 further explained the interactive impacts of Ni and Cd in a time-dependent exposure on BGL of susceptible rats occasioned by continuous intake of contaminated drinking water. From the first 3D surface plot, a mutual increase in Ni and Cd concentrations from 0 to 150 mg/L caused a marked synergistic increase (P <0.05) in BGL of exposed rats, suggesting hyperglycemia with the possible risk of diabetes over time. Optimal BGL (18.93 ± 0.88 mg/L) was observed at 150 mg/L of Ni and Cd contamination of drinking water. In the second and third 3D response surface plots, the time-dependent impact of each contaminant on the BGL of susceptible rats is clearly illustrated in Figure 1. A marked increase in Ni and Cd levels, as occasioned by systematic intake of the contaminated water by susceptible rats, stimulated BGL by synergism in a time-dependent fashion at P <0.05.
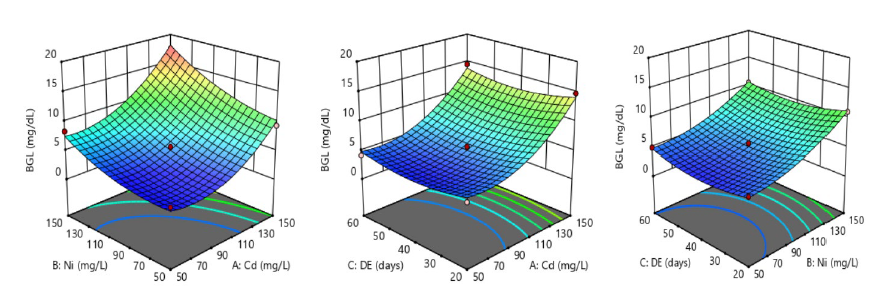
Figure 1. Systematic intake of nickel-cadmium-contaminated drinking water and its synergistic impacts on blood glucose level (BGL) in male albino rats.
Possible risks of dyslipidemia and cardiovascular disease
The changes associated with lipid metabolism and cardiovascular risk in predisposed rats, as mediated by the continuous ingestion of tainted water by the contaminants, are succinctly illustrated by 3D surface plots (Figure 2-4). The plots further explained the nature of interaction of between the two contaminants, the nature of interaction between each contaminant and time of exposure, and their corresponding effects on AIP, CRR and AC. In Figure 2, the first 3D surface plot was indicative of synergistic interaction between the two contaminants due to the decreasing contour bridges, and this concomitantly elevated AIP level (0.31 ± 0.01), especially at 150 mg/L of contamination of water. Considering the second and third 3D surface plots of Figure 2, the increasing concentration of individual contaminants from 50-150 mg/L caused a significant rise (P <0.05) in AIP level, but the effect was more prominent at the optimal time of exposure as a result of the moderately rising contour bridge. Thus, the optimal AIP level was defined clearly by the red-coloured on the surface plots, as determined by the synergistic effects of contaminants in a time-dependent fashion of exposure.
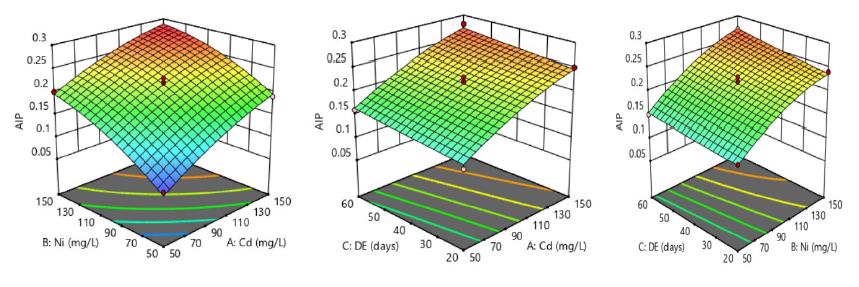
Figure 2. Systematic intake of nickel-cadmium-contaminated drinking water and its synergistic impacts on atherogenic index of plasma (AIP) in male albino rats.
Another marker of cardiovascular risk examined in this study was CRR whose variation was monitored under the current experimental settings and depicted by three 3D surface plots (Figure 3). The first 3D surface plot showed interaction between Ni and Cd at fixed duration of exposure, and increased concentrations of both metals from 50-150 mg/L synergistically enhanced CRR level (3.52 ± 0.10) at P <0.05; the development of decreasing contour bridges was pronounced at optimal level of the contamination, suggesting significant interaction and the effect reflected synergism on the response. However, the other two 3D surface plots showed decreasing contour bridges in which Ni or Cd significantly raised CRR levels based on 20 to 60 days of exposure.
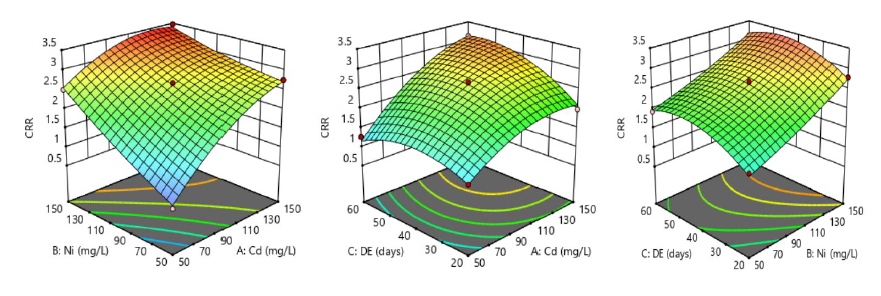
Figure 3. Systematic intake of nickel-cadmium-contaminated drinking water and its synergistic impacts on cardiac risk ratio (CRR) in male albino rats.
The impact of Ni and Cd on AC level through the ingestion of contaminated water by rats in a subchronic exposure is clearly illustrated using three 3D surface plots (Figure 4). The first 3D plot showed decreasing contour bridges, which indicated significant interaction between the two contaminants, and consequently mediated a synergistic rise in AC level (3.48 ± 0.06) at P <0.05 in susceptible rats.
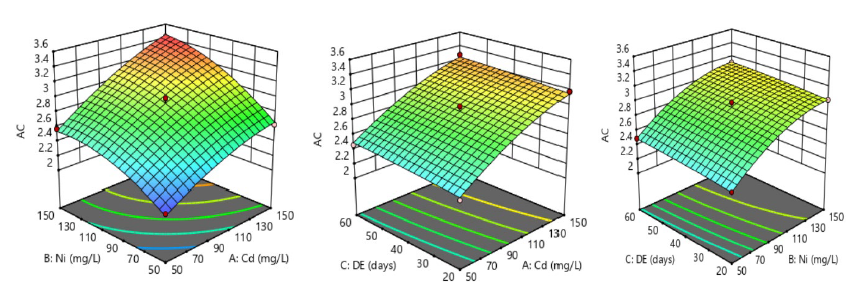
Figure 4. Systematic intake of nickel-cadmium-contaminated drinking water and its synergistic impacts on atherogenic coefficient (AC) of male albino rats.
Confirmation of models
The study therefore helped to build on the current knowledge by using a BBD, a well-established RSM, to expose the interplay between Ni and Cd at different doses and time points and lay a deeper comprehension of the impact of these metals on the metabolic fitness of sensitive rat models. The quadratic regression models for Ni and Cd toxicity derived in this investigation provided forecasts on the interactions of the two metals and their impacts on the evaluated responses, as shown in Table 4. These were further checked for sufficiency of prediction at optimized conditions at the laboratory.
Table 4. Validation of developed models for the prediction of responses under optimal experimental conditions.
|
Experimental factors |
Name |
Level |
Low level |
High level |
Std. Dev. |
Coding |
|
A |
Cd |
150.00 |
50.00 |
150.00 |
0 |
Actual |
|
B |
Ni |
150.00 |
50.00 |
150.00 |
0 |
Actual |
|
C |
DE |
60.00 |
20.00 |
60.00 |
0 |
Actual |
|
Responses |
Predictions |
95% PI Low |
95% PI High |
|||
|
BGL (mg/dL) |
18.93 ± 0.88 |
15.72 |
22.14 |
|||
|
AIP (unitless) |
0.31 ± 0.01 |
0.26 |
0.35 |
|||
|
CRR (unitless) |
3.52 ± 0.10 |
3.16 |
3.87 |
|||
|
AC (unitless) |
3.48 ± 0.06 |
3.27 |
3.69 |
|||
DISCUSSION
The pollution of potable water with heavy metals, particularly Cd and Ni, is one of the most critical issues facing the global population due to increasing industrialization, agricultural runoffs and anthropogenic activities. The study's results emphasized the probable processes behind the observed metabolic abnormalities, as well as the larger public health implications of persistent metal contamination of potable water sources. Most importantly, the observations based on diagnostic characteristics and 3D surface plots are consistent with previous research that a regression (quadratic) model with high validity and reliability is frequently used for accurate response prediction in a well-defined experimental condition (Anuar et al., 2013; Sondhi and Saini, 2019). It is a reflection of exposure to environmental toxicants, such as Ni and Cd in water, which may have a significant influence and lead to metabolic disturbances (Alonso-Magdalena et al., 2022; Khalil et al., 2023). According to studies (Sondhi and Saini, 2019; Apiamu and Asagba, 2021), the r2 value determines a model's ability to accurately predict a response under given experimental settings if it accounts for more than 70% of the experimental data. A model's inadequacy is heavily determined by the line of best fit in terms of variation of experimental data, and a non-perfect distribution of these data is regarded lack of fit at P >0.05 (Anuar et al., 2013; Apiamu et al., 2022). The discrepancy between the adjusted and predicted r2 values indicated that the strong correlation between predicted and experimental data under the specified experimental conditions in this study was not greater than 20 (Anuar et al., 2013; Apiamu et al., 2024). Again, acceptable precision is another diagnostic technique used to assess the suitability of a model by measuring the signal-to-noise quotient if the ratio surpasses 4 (Wu et al., 2016).
The nature of interactions between two experimental factors may instigate synergism, potentiation or antagonism in a given response provided that a third experimental factor is fixed (Hajji et al., 2008; Anuar et al., 2013; Apiamu and Asagba, 2021). Here, the rising contour bridges were indications of a synergistic effect on BGL, where the upsurge was a characteristic phenomenon of hyperglycemia and possible health risk of diabetes in rats. In light of the foregoing, Haidar et al. (2023) reported the onset of diabetes, a typified metabolic pathology mediated by exposure to Cd and Ni toxicities in susceptible biological systems with defined cellular and molecular mechanisms. In their investigations, the development of this metabolic disorder, as a function of significant hyperglycemic conditions, may be occasioned by the negative roles of these metals in interfering with glucose metabolism and stimulating the activities of some gluconeogenic enzymes, such as fructose-1,6-bisphosphatase and pyruvate carboxylase amongst others. The findings from this study were further consolidated with previous scientific reports that exposure to these heavy metals caused a substantial increase in BGL as a result of their inhibitory actions on the expression of glucose transporter 4 (GLUT4) (Liu et al., 2015; Haidar et al., 2023). As expected, this disruption may result in diabetic related hyperglycemia, type II diabetes, and over time increased prevalence of renal impairment as noted by Orr and Bridges (2017) and Khali and his colleagues (2023). Certain researchers have explained how Ni and Cd may affect insulin resistance and hence develop metabolic diseases including diabetes (Buha et al., 2020; Haidar et al., 2023). Consequently, the actions of these metals might directly be additive in a manner that augments insulin-interfering capacity and consequently, enhances metabolic dysfunction.
The elevation of atherogenic indices observed in this study underscored the detrimental effects of Ni and Cd on lipid metabolism (Perrelli et al., 2022; Haidar et al., 2023), and they are commonly used markers to assess cardiovascular risk, with higher values indicating an increased likelihood of developing atherosclerosis and other cardiovascular conditions (Mahat et al., 2018; Wu et al., 2018; Tien et al., 2023). Cadmium is known to play contradictory effects on atherogenesis increasing oxidative stress and inflammation in vascular endothelial cells that lead to formation of atherosclerotic plaques (Telle and Plarz, 2013; Haidar and Twahir, 2023). The significant increase in AIP, CRR, and AC in rats exposed to cadmium-contaminated water suggested that Cd accelerated lipid peroxidation, elevated low-density lipoprotein cholesterol (LDL-C), and HDL-C, all of which are key factors in the pathogenesis of cardiovascular disease (Tinkov et al., 2018; Genchi et al., 2020). On the other hand, as it was mentioned above, Ni exposure is also associated with lipid peroxidation and cardiovascular risk and it appears that Ni might exert a direct toxic effect on endothelium and increase the production of ROS similar to Cd (Niu et al., 2013; Min et al., 2014; Miyanishi et al., 2019; Haidar et al., 2023). The current study also established that the combined effect of exposure of vulnerable rats to both contaminants produced further aggravated changes in lipid profile indices as compared to single metal exposure. Although there is a lack of data available in the context of this present study, the additive effect may be due to the combined toxic effect of generated metals oxidative stress that surpassed the antioxidant protective mechanism, thereby resulting in lipid peroxidation and dyslipidaemia (Checconi et al., 2013; Apiamu et al., 2019). An increase in AIP, CRR and AC was evident in all the treatment groups revealing that Ni-Cd co-exposure posed cardiovascular risk, especially to groups with extended exposure to drinking water containing the metals.
The outcome observed in the present study was consistent with previous investigations on the toxicological effects of the metals under consideration on metabolic and cardiovascular health (Tinkov et al., 2018; Yang et al., 2020). Some of these studies showed that there were concurrent alterations of the BGLs and dyslipidemia in the rats treated with Cd, which supported the hypothesis that oxidative stress played a central role in the impact made by Cd on metabolic disorder (Edwards and Prozialeck, 2009; Tellez-Plaza et al., 2013). Besides, more attention was paid to the observation that Ni exposure increases insulin resistance and dyslipidemia (Niu et al., 2013; Min et al., 2014; Liu et al., 2015; Haidar et al., 2023), as notable data that the present study supported.
CONCLUSION
The present study showed that prolonged intake of Ni and Cd present in the drinking water at subchronic exposure produced significant metabolic changes in albino rats including high BGLs, changes in lipid profile, and enhanced cardiovascular risks, as reflected by high AIP, CRR and AC values. These observations pointed to the fact that the long persistence of such heavy metals may be indications of significant risks for the development of metabolic complications, such as hyperglycemia, dyslipidemia, and atherosclerosis respectively. Therefore, the findings of this study strongly underscored the usefulness of employing the BBD design in the determination of synergistic effects of both metals at different concentration levels and exposure time. The quadratic regression models derived provided forecast abilities for prospective health implications of Ni and Cd co-ingestion for the suitable environmental and public health risk assessment.
Since heavy metal pollution in water has become a more frequent problem, our results may be useful when addressing the issue of strict governmental regulations of the concentrations of Ni and Cd in drinking water. As part of protecting the health of a population, public health actions should be aimed at preventing populations vulnerable to the toxic effects of these metals from being exposed for years. Therefore, it is anticipated that further studies should focus on elucidating the underlying molecular pathology of the adverse metabolic and cardiovascular effects provoked by these toxic metals, with special reference to the development of protective strategies. This work could be best placed under a larger growing pool of information detailing the detrimental health effects occasioned by heavy metal toxicity in the environment, thus the need to enhance surveillance and preventive measures.
ACKNOWLEDGMENTS
We gratefully acknowledge the support and resources provided by the Department of Biochemistry, Faculty of Science, Delta State University, Abraka, which was instrumental in conducting this research. We also appreciate the staff of the Department of Biochemistry’s Laboratory for their technical assistance and expertise. Additionally, the dedication and hard work of the research team brought about the successful completion of this study.
AUTHOR CONTRIBUTIONS
All authors contributed to the study's conception and design. AA: Conceptualization, Investigation, Resources, Software, Writing – original draft. UFE: Investigation, Formal analysis, Methodology, Writing – review & editing. SEO: Formal analysis, Writing – review & editing. EDK: Writing – review & editing, Validation. PIO: Investigation, Writing – review & editing. CME: Data curation, Visualization & Software. COE: Writing – review & editing, Validation. SOA: Project administration, Supervision, Validation.
CONFLICT OF INTEREST
The authors declare that they hold no competing interests.
ETHICAL APPROVAL
All experimental procedures involving animals were conducted following ethical standards and were approved on 23rd January 2023 by the Institutional Animal Care and Use Committee (IACUC) of the Delta State University, Abraka, Nigeria (Approval Number: REI/FOS/2023/13). The study was carried out in compliance with the National Institutes of Health guidelines for the care and use of laboratory animals.
REFERENCES
Allain, C.C., Poon, L.S., Chan, C.S., Richmond, W., and Fu, P.C. 1974. Cholesterol enzymatic colorimetric method. Clinical Chemistry. 20(4): 470–475.
Ali, H. and Khan, E. 2018. Bioaccumulation of non-essential hazardous heavy metals and metalloids in freshwater fish: Risk to human health. Environmental Chemistry Letters. 16: 903–917.
Alonso-Magdalena, P., Tudurí, E., Marroquí, L., Quesada, I., Sargis, R.M., and Nadal, A. 2019. Toxic effects of common environmental pollutants in pancreatic β-cells and the onset of diabetes mellitus. In: Huhtaniemi I, Martini L. (Eds.) Encyclopedia of endocrine diseases. 2nd ed. (pp. 764-775). Academic Press, Amsterdam, Netherlands.
Anuar, N., Adnan, A.F.M., Saat, N., Aziz, N., and Taha, R.M. 2013. Optimization of extraction parameters by using response surface methodology, purification, and identification of anthocyanin pigments in Melastoma malabathricum fruit. The Scientific World Journal. 2013: 810547.
Apiamu, A. and Asagba, S.O. 2021. Zinc-cadmium interactions instigated antagonistic alterations in lipid peroxidation, ascorbate peroxidase activity and chlorophyll synthesis in Phaseolus vulgaris leaves. Scientific African. 11: e00688.
Apiamu, A., Asagba, S.O., and Tonukari, N.J. 2019. Role of Anthocleista vogelii in serum antioxidant defence system in cadmium-induced oxidative stress in Wistar rats. Beni-Suef University Journal of Basic and Applied Sciences. 8: 12-25.
Apiamu, A., Avwioroko, O.J., Evuen, U.F., Kadiri, H.E., Kpomah, E.D., Anigboro, A.A., Ugbebor, G. and Asagba, S.O. 2024. Exposure to nickel-cadmium contamination of drinking water culminates in liver cirrhosis, renal azotemia and metabolic stress in rats. Biological Trace Element Research. 202(4): 1628–1643.
Apiamu, A., Osawaru, S.U., Asagba, S.O., Evuen, U.F. and Achuba, F.I. 2022. Exposure of African catfish (Clarias gariepinus) to lead and zinc modulates membrane-bound transport protein: A plausible effect on Na+/K+-ATPase activity. Biological Trace Element Research. 200: 4160–4170.
Assmann, G., Schriewer, H., Schmitz, G., and Hägele, E.O. 1983. Quantification of high-density lipoprotein cholesterol by precipitation with phosphotungstic acid/MgCl₂. Clinical Chemistry. 29(12): 2026–2030.
Buha, A., Ðukic-Cosic, D., Curcic, M., Bulat, Z., Antonijevic, B., Moulis, J., Goumenou, M., and Wallace, D. 2020. Emerging links between cadmium exposure and insulin resistance: Human, animal, and cell study data. Toxics. 8: 63–79.
Boxton, S., Garman, E., Heim, K.E., Lyons-Darden, T., Schlekat, C.E., Taylor, M.D., and Oller, A.R. 2019. Concise review of nickel human health toxicology and ecotoxicology. Inorganics. 7(7): 89.
Checconi, P., Sgarbanti, R., Celestino, I., Limongi, D., Amatore, D., Iuvara, A., Alimonti, A., Garaci, E., Palamara, A.T., and Nencioni, L. 2013. The environmental pollutant cadmium promotes influenza virus replication in MDCK cells by altering their redox state. International Journal of Molecular Science. 14(2): 4148–4162.
Edwards, J.R. and Prozialeck, W.C. 2009. Cadmium, diabetes and chronic kidney disease. Toxicology and Applied Pharmacology. 238: 289–293.
Ferryanto, M.L. Samadhi, I., and Mukono, I.S. 2022. Systematic review-meta analysis study the effect of cadmium and copper exposure on children’s cognitive. Chiang Mai University Journal of Natural Sciences. 21(4): e2022066.
Fossati, P. and Prencipe, L. 1982. Serum triglycerides determined calorimetrically with an enzyme that produces hydrogen peroxide. Clinical Chemistry. 28(10): 2077–2080.
Genchi, G., Sinicropi, M.S., Lauria, G.G., Carocci, A., and Catalano, A. 2020. The effects of cadmium toxicity. International Journal of Environmental Research and Public Health. 17: 3782.
Haidar, Z, Fatema, K., Shoily, S.S., and Sajib, A.A. 2023. Disease-associated metabolic pathways are affected by heavy metals and metalloids. Toxicological Reports. 10: 554–570.
Hajji, M., Rebai, A., Gharsallah, N., and Nasri, M. 2008. Optimization of alkaline protease production by Aspergillus clavatus ES1 in Mirabilis jalapa tuber powder using statistical experimental design. Applied Microbiology and Biotechnology. 79: 915–923.
Health Canada. 2020. Guidelines for Canadian drinking water quality: Guideline technical document – Cadmium. Water and Air Quality Bureau, Healthy Environments and Consumer Safety Branch, Health Canada, Ottawa, Ontario. (Catalogue No - H144-13/17-2020E-PDF). http://www.canada.ca/en/health-canada/services/environmental-workplacehealth/reports-publications/water-quality.html
Hong, H., Xu, Y., Xu, J., Zhang, J., Xi, Y., Pi, H., Yang, L., Yu, Z., Wu, Q., Meng, Z., et al. 2021. Cadmium exposure impairs pancreatic β-cell function and exaggerates diabetes by disrupting lipid metabolism. Environment International. 149: 106406.
Huang, H., Li, Y., Zheng, X., Wang, Z., and Cheng, X. 2022. Nutritional value and bioaccumulation of heavy metals in nine commercial fish species from Dachen Fishing Ground, East China Sea. Scientific Reports. 12: e6927.
Khali, W.J., Akeblersane, M., Khan, A.S., Moin, A.S.M., and Butler, A.E. 2023. Environmental pollution and the risk of developing metabolic disorders: Obesity and diabetes. International Journal of Molecular Science. 24: e8870.
Lamas, G.A., Ujueta, F., and Navas-Acien, A. 2021. Lead and cadmium as cardiovascular risk factors: The burden of proof has been met. Journal of American Heart Association. 10: e018692.
Liu, G., Sun, L., Pan, A., Zhu, M., Li, Z., Wang, Z., Liu, X., Ye, X., Li, H., Zheng, H., et al. 2015. Nickel exposure is associated with the prevalence of type 2 diabetes in Chinese adults. International Journal of Epidemiology. 44: 240–248.
Mahat, R.K., Singh, N., Rathore, V., Gupta, A., and Shah, R.K. 2018. Relationship between atherogenic indices and carotid intima-media thickness in prediabetes: A cross-sectional study from central India. Medical Sciences. 6: 55–66.
McGowan, M.W., Artiss, J.D., Strandbergh, D.R., and Zak, B. 1983. A peroxidase-coupled method for the colorimetric determination of serum triglycerides. Clinical Chemistry. 29(3): 538–542.
Min, Y.A., Na, B., Quan, P.U.H., Zhang, Z.T., Ning, C., Yang, A.M., Bai, Y.N., Pu, H.Q., Zheng, T.Z., Cheng, N., et al. 2014. Prevalence of metabolic syndrome in Chinese nickel-exposed workers. Biomedical and Environmental Sciences. 27: 475–477.
Miyanishi, K., Tanaka, S., Sakamoto, H., and Kato, J. 2019. The role of iron in hepatic inflammation and hepatocellular carcinoma. Free Radical Biology and Medicine. 133: 200–205.
Niu, J., Liberda, E.N., Qu, S., Guo, X., Li, X., Zhang, J., Meng, J., Yan, B., Li, N., Zhong, M., et al. 2013. The role of metal components in the cardiovascular effects of PM 2.5. PLoS One. 8: 83782.
Nordberg, G.F., Fowler, B.A., and Nordberg, M. (Eds.). 2015. Handbook on the toxicology of metals (4th ed.). Academic Press. Burlington, MA. https://doi.org/10.1016/C2011-0-07884-5
Orr, S. and Bridges, C. 2017. Chronic kidney disease and exposure to nephrotoxic metals. International Journal of Molecular Science. 18: e1039.
Perrelli, M., Wu, R., Liu, D.J., Lucchini, R.G., del Bosque-Plata, L., Vergare, M.J., Akhter, M.P, Ott, J., and Gragnoli, C. 2022. Heavy metals as risk factors for human diseases – a Bayesian network approach. European Review for Medical and Pharmacological Sciences. 26: 9275–9310.
Ruksachat, N., Tengjaroensakul, B., Neeratanaphan, L., Tanomtong, A., Srikacha, N., Phommavong, T., and Soulivongsa, L. 2023. Heavy metals and metalloid effects on cytogenetics in frogs (Sylvirana nigrovittata) around the Sepon gold-copper mine, Lao PDR. Natural and Life Sciences Communications. 22(1): e2023007.
Sevim, Ç. Dogan, E., and Comakli, S. 2020. Cardiovascular disease and toxic metals. Current Opinion on Toxicology. 19: 88 – 92.
Sondhi, S. and Saini, K. 2019. Response surface-based optimization of laccase production from Bacillus sp. MSK-01 using fruit juice waste as an effective substrate. Heliyon. 5: e01718.
Swangneat, K., Neeratanaphan, N., Kallawicha, K., and Tengjaroensakul, B. 2024. Growth, hematological evaluation and heavy metal bioaccumulation in Nile tilapia (Oreochromis niloticus) from a municipal waste landfill reservoir. Natural and Life Sciences Communications. 23(2): e2024018.
Tellez-Plaza, M., Guallar, E., Howard, B.V., Umans, J. G., Francesconi, K.A., Goessler, W., Silbergeld, E.K., Devereux, R.B., and Navas-Acien, A. 2013. Cadmium exposure and incident cardiovascular disease. Epidemiology. 24: 421–429.
Tien, Y., Wang, L., Lee, Y., Lin, P., Hung, C., Chong, M., and Huang, Y. 2023. Comparative predictive efficacy of atherogenic indices on metabolic syndrome in patients with schizophrenia. Schizophrenia Research. 262: 95–101.
Tinkov, A.A., Filippini, T., Ajsuvakova, O.P, Skalnaya, M.G., Aaseth, J., Bjørklund, G., Gatiatulina, E.R., Popova, E.V., Nemereshina, O.N., Huang, P.T., et al. 2018. Cadmium and atherosclerosis: A review of toxicological mechanisms and a meta-analysis of epidemiologic studies. Environmental Research. 162: 240–260.
Trinder, P. 1969. Determination of blood glucose using an oxidase-peroxidase system with a non-carcinogenic chromogen. Annals of Clinical Biochemistry. 6(1): 24–27.
Wang, B. and Xu, D. 2014. Effects of nickel on immune function, oxidative stress, and the spleen structure in rats. Biological Trace Element Research. 162:181–188.
World Health Organization (WHO) 2011. Guidelines for drinking-water quality, 4th ed. World Health Organization, Geneva.
Wu, R., Zhu, R., Shang, Y., and Zhong, G. 2016. Optimization of lychee wine fermentation process using response surface methodology to reduce acetic acid content. International Journal of Agricultural and Biological Engineering. 9: 223–230.
Wu, T., Gao, Y., Zheng, Y., Ma, Y., and Xie, X. 2018. Atherogenic index of plasma (AIP): A novel predictive indicator for the coronary artery disease in postmenopausal women. Lipids in Health and Disease. 17: 197–204.
Yang, K., Lo, K., Zheng, T., Yang, J., Bai, Y., Feng, Y., Cheng, N., and Liu, S. 2020. Environmental heavy metals and cardiovascular diseases: Status and future direction. Chronic Diseases and Translational Medicine. 6: 251–259.
Yang, W.S., Kim, K.J., Gaschler, M.M., Patel, M., Shchepinov, M.S, and Stockwell, B.R. 2016. Peroxidation of polyunsaturated fatty acids by lipoxygenases drives ferroptosis. Proceedings of the National Academy of Science USA. 113: E4966–E4975.
OPEN access freely available online
Natural and Life Sciences Communications
Chiang Mai University, Thailand. https://cmuj.cmu.ac.th
Augustine Apiamu1, Uduenevwo Francis Evuen2, *, Samson Eruke Okoro3, Enyohwo Dennis Kpomah4, Precious Ifeakachukwu Odeh5, Chinedum Martins Ekeleme6, Chiedu Onyinye Emeninwa6, and Samuel Ogheneovo Asagba1
1 Department of Biochemistry, Faculty of Science, Delta State University, P.M.B.1, Abraka, Nigeria.
2 Department of Biochemistry and Molecular Biology, Faculty of Science, Dennis Osadebay University Asaba, Nigeria.
3 Department of Biochemistry, Faculty of Science, University of Port Harcourt, Rivers State, Nigeria.
4 Department of Biochemistry, Faculty of Science, Federal University, P.M.B. 1245, Otuoke, Bayelsa State, Nigeria.
5 Department of Science Laboratory, Faculty of Science, Delta State University, Abraka, Nigeria.
6 Department of Biochemistry, Faculty of Science, Delta State University of Science and Technology, P.M.B. 5, Ozoro, Nigeria.
Corresponding author: Uduenevwo Francis Evuen, E-mail: francdei@yahoo.com
ORCID: Uduenevwo Francis Evuen: https://orcid.org/0000-0003-4384-4062
Total Article Views
Editor: Sirasit Srinuanpan,
Chiang Mai University, Thailand
Article history:
Received: May 9, 2025;
Revised: July 5, 2025;
Accepted: July 9, 2025;
Online First: July 30, 2025