 ISSN: 2822-0838 Online

Effect of Cooking on Chemical Constituents and In Vitro Anti-diabetes Properties of Red Rice
Chakkrit Khanaree, Payungsak Tantipaiboonwong, Komsak Pintha, Maitree Suttajit, and Wanisa Punfa*Published Date : July 15, 2025
DOI : https://doi.org/10.12982/NLSC.2025.056
Journal Issues : Number 4, October-December 2025
Abstract Cooking red rice induces chemical and biological changes to the phytochemical content, affecting the food's texture and nutritional profile. In the present study, the effect of cooking red rice on its chemical contents and in vitro anti-diabetes properties was investigated. The raw red rice was extracted with 70% ethanol (RRRE) as well as cooked red rice using an electric rice cooker (CRRE1), an electric pressure rice cooker (CRRE2), a microwave cooker (CRRE3), and boiling (CRRE4). All extracts' phytoconstituents were evaluated using colorimetric analysis and HPLC techniques, and then in vitro anti-diabetes properties were examined. The results revealed that cooked red rice extracts (CRREs) reduced phenolic compounds such as chlorogenic acid, protocatechuic acid, and vanillic acid, as well as flavonoid compounds such as catechin and epicatechin, proanthocyanidin compounds, vitamin E analogs such as α-tocotrienol, α-tocopherol, g-tocotrienol, and g-tocopherol, and g-oryzanol. Furthermore, CRREs retained antioxidant activity in the DPPH and ABTS assays, decreased ROS and NO production in RAW264.7-induced cells, and reduced in vitro lipid peroxidation and advanced glycation end products (AGEs) formation, similar to RRRE. In addition, we discovered that cooked red rice with boiling had higher phytochemical contents and greater anti-diabetes properties than other cooked red rice. The findings revealed that boiled red rice may be considered anti-diabetic, providing vital insights into the health benefits of eating boiled red rice and promoting boiled red rice for diabetes patients.
Keywords: Red rice, Cooked, Chemical constituents, Anti-diabetes property
Funding: This research was financially supported by the Agricultural Research Development Agency (Public Organization), the Thailand Science Research and Innovation Fund, and the University of Phayao, Unit of Excellence grant number (Grant No. FF66-UoE020).
Citation: Khanaree, C., Tantipaiboonwong, P., Pintha, K., Suttajit, M., and Punfa, W. 2025. Effect of cooking on chemical constituents and in vitro anti-diabetes properties of red rice. Natural and Life Sciences Communications. 24(4): e2025056.
INTRODUCTION
Rice, scientifically known as Oryza sativa L., is one of the most common and important cereal crops. Thai cultures have long recognized the usefulness of rice in sustaining human health and nutrition. It is a staple food in Thailand, especially the milled and parboiled white rice. White rice is a carbohydrate-rich food with a high glycemic index. Consuming it will rapidly increase blood sugar levels (Sun et al., 2010). However, rice's glycemic index varies widely depending on the processing method, variety, and chemical composition (Foster-Powell et al., 2002; Saragih et al., 2017). Currently, there is a noticeable rise in the consumption of pigmented rice due to its positive impact on health. Particularly, red rice was discovered to possess a lower glycemic index and a higher nutritious content than white rice (Anitha et al., 2017). Therefore, red rice offers a distinct benefit in diabetes patients as a healthier substitute for white rice.
Raw red rice contained polyphenol and proanthocyanidin components, g-oryzanol, tocopherols, and tocotrienols, which had further advantages including anti-inflammatory, anti-carcinogenic, anti-allergic, anti-hyperlipidemic, and anti-hyperglycemic properties (Pintha et al., 2014; Tantipaiboonwong et al., 2017; Veni, 2019; Jadhav, 2021; Punfa et al., 2024). However, rice is a unique cereal that is cooked and consumed as a whole grain. Cooking causes physical, chemical, and biological changes to the phytochemical composition, altering the food's texture and nutritional profile (Nayeem, 2021). Polyphenols, specifically, are extremely reactive substances that experience several physical and chemical changes during the processing of food (Nayeem, 2021).
Therefore, the objective of this study was to examine the phytochemical components and in vitro anti-diabetes properties of raw red rice and cooked red rice using various cooking methods, including an electric rice cooker, an electric pressure rice cooker, a microwave cooker, and boiling. The findings of our study can provide valuable insights into the health advantages of consuming cooked red rice, promoting cooked red rice for diabetes patients, and analyzing the nutrient loss during the cooking process of red rice.
MATERIAL AND METHODS
Plant material
The raw red jasmine rice (Oryza sativa L.) utilized in the study (Figure 1) was harvested in Dok Kham Tai District, Phayao Province, Thailand. A voucher specimen number was certified by the herbarium at the Flora of Thailand, Faculty of Pharmacy, Chiang Mai University (Voucher specimen no. 023163), which was kept for future reference.
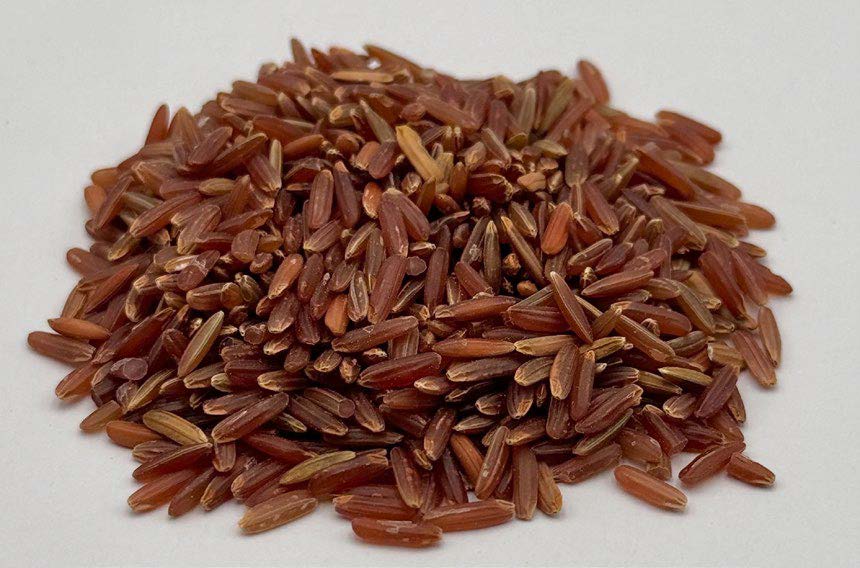
Figure 1. The red jasmine rice used in the study.
Cooking of red rice
Red rice was prepared utilizing four distinct cooking methods: electric rice cooker, electric pressure rice cooker, microwave cooker, and boiling. In the electric rice cooker (PHILIPS HD3031, China), 1 cup of red rice was mixed with 2 cups of water and cooked at 600 W until the rice cooker automatically shuts off after 60 min of cooking time. For the electrically heated pressure rice cooker (Presto® stove top pressure cooker, Eau Claire, WI USA), 1 cup of red rice was mixed with 2 cups of water and cooked at 121°C for 15 min using pressure 15 Psi. For the microwave method, 1 cup red rice was mixed with 2 cups of water and then added to a microwaveable ceramic pot and subsequently placed it in a microwave oven (MRO-DF6, Hitachi) operating at 800 W for 30 min. The boiled red rice, 1 cup red rice was mixed with 4 cups of water and cooked for 30 min.
Preparation of raw and cooked red rice extracts
One hundred grams of raw and cooked red rice were extracted in one liter of 70% ethanol. The ethanolic solution was then stirred at room temperature for 12 h. Subsequently, the solution was filtered through filter paper (Whatman no.1), the ethanol was evaporated by rotary evaporator at 40°C and lyophilized to yield crude raw and cooked red rice extract powder. The raw and cooked red rice with an electric rice cooker, an electric pressure rice cooker, a microwave cooker, and boiling will be referred to as RRRE, CRRE1, CRRE2, CRRE3, and CRRE4, respectively. The five extracts were kept at -20°C until use.
Determination of total phenolic content (TPC)
RRRE and CRREs were dissolved in DMSO at assigned concentrations. In 96-well plate, 20 µl of RRRE and CRREs were added to 100 µl of 10% v/v Folin-Ciocalteu reagent. The mixture was then incubated for 3 min in the dark at room temperature. Next, each well received 80 µl of 7.5% w/v sodium carbonate (Na2CO3). The incubation was then conducted for 30 min at room temperature in the dark, after which the absorbance was quantified at a wavelength of 765 nm using a Synergy™ HT Multi-Detection Microplate Reader (BioTek Instruments, Inc., VT, USA). A standard curve was created utilizing different amounts of gallic acid. The total phenolic content was estimated using an authentic gallic acid standard curve and expressed as milligrams of gallic acid equivalents (GAE) per gram of dry weight of the extract (Khanaree et al., 2021).
Determination of total flavonoid content (TFC)
RRRE and CRREs were dissolved in DMSO at specified quantities. In a 96-well plate, add 25 µl extract, 125 µl deionized water, and 7.5 µl 5% NaNO2 solution. After 6 min of incubation at room temperature in the dark, add 15 µl of 10% w/v aluminum chloride (AlCl3) and incubate for another 6 min. The color development process was carried out by adding 50 µl of a 1 M NaOH. The total volume of the reaction mixture was modified to 250 µl by adding deionized water. The solution was incubated for 15 min at room temperature in the dark before being measured at 532 nm with a microplate reader. A standard curve was created utilizing different amounts of catechin. The total flavonoid content was estimated using an authentic catechin standard curve and expressed as milligrams of catechin equivalents (CE) per gram of dry weight of the extract (Khanaree et al., 2021).
Determination of total proanthocyanidin content (TPAC)
The RRRE and CRREs were mixed with sulfuric acid/methanol solution and 1% w/v vanillin in methanol. A control mixture of the sample was generated by adding 100% methanol instead of the vanillin solution to correct the absorbance by the non-vanillin reactive compounds. After incubation for 15 min in a 30°C water bath, the absorbance of the sample and the control mixtures was measured at 490 nm against a reagent blank. The difference was used to determine the total proanthocyanidin concentrations of the sample, expressed as milligram catechin/gram extract (mg CE/g extract) (Pintha et al., 2014).
HPLC analysis for phenolic, vitamin E analogs, and g-oryzanol in extracts
The phenolic compounds and g-oryzanol in RRRE and CRREs were separated using an Inertsil ODS-3-C18 column (250 x 4.6 mm, 5 μm particle diameter, GL Science Inc., Japan). Using solvents A (0.1% trifluoroacetic acid in water) and B (100% methanol), gradient elution was used to detect phenolic compounds, while isocratic elution (methanol: acetonitrile; 65:35) was used to detect g-oryzanol. Ten microliters of the samples were injected into the column at a flow rate of 1.0 ml/min. Standard phenolic compounds and g-oryzanols were detected at 280 and 325 nm, respectively. The vitamin E analogs in RRRE and CRREs were measured using a C30 column (250 × 4.6 mm, 5 μm particle) with isocratic elution and methanol: H2O (93:7) as the mobile phase. An injection volume of 10 μl was used. The standards for tocopherols and tocotrienols were monitored at 292 nm (Pintha et al., 2014).
Determination of antioxidant activity by DPPH radical scavenging assay
The 20 µl of RRRE and CRREs at assigned concentrations were mixed with 180 µl of 0.2 mM DPPH reagent in a 96-well plate. The reaction mixture was incubated at room temperature for 30 min in the dark. The measurement of absorbance was conducted at a wavelength of 517 nm using the microplate reader. Methanol was used as a reagent blank of control, and mixing methanol with different concentrations of the extract was used as a reagent blank of the test. The scavenging inhibition percentage was calculated and expressed as the concentration of the extracts which scavenged free radicals by 50% (SC50) (Khanaree et al., 2021).
Determination of antioxidant activity by ABTS radical scavenging assay
A total of 10 µl of RRRE and CRREs at assigned concentrations were mixed with 990 µl of the working ABTS solution. The reaction mixture was incubated at room temperature for 6 min in the dark and then the samples' absorbance was quantified at a wavelength of 734 nm using a UV-visible spectrophotometer. Water was used as a reagent blank of control, and mixing water with various concentrations of the extract was used as a reagent blank of the test. The scavenging inhibition percentage was calculated and expressed as the concentration of the extracts that scavenged free radicals by 50% (SC50) (Khanaree et al., 2021).
Cell lines and culture conditions
The mouse macrophage RAW264.7 cells were obtained from the American Type Culture Collection (ATCC; Manassas, VA, USA). The cells were cultured and maintained in Dulbecco's Modified Eagle Medium (DMEM) supplemented with 10% (v/v) fetal bovine serum (FBS) and 100 U/ml penicillin and 100 µg/ml streptomycin at 37°C in a humidified atmosphere containing 5% CO2. Subsequently, cells were treated with the extracts at different concentrations to determine the intracellular reactive oxygen species (ROS) level and nitric oxide secretion.
Determination of cytotoxicity by MTT Assay
RAW264.7 cells (5 x 10⁵ cells/well) were seeded into a 96-well plate for 24 h and were then treated with different concentrations of the extracts for 24 h. Then, 15 µl of 5 mg/ml MTT (3-(4,5-dimethylthiazol-2-yl)-2,5-diphenyltetrazolium bromide) dye was added and incubated at 37°C for 4 h. All solutions were discarded, and 100 µl of DMSO was added to dissolve the formazan crystal. The absorbance (OD) of the formazan dye was measured at 540/630 nm with a microplate reader (Phannasorn et al., 2017). The percentage of cell viability was calculated, and non-cytotoxic concentrations (≤ IC20) were selected for subsequent experiments.
Determination of intracellular reactive oxygen species (ROS) level
RAW264.7 cells were incubated with DCFH-DA (2',7'-dichlorofluorescein-diacetate) for 2 h before being treated with FeSO4 and the extracts at non-toxic concentrations. The co-incubation was carried out at 37°C for 30 min. In the presence of ROS, the DCFH-DA was de-esterified to form a measurable fluorescent product. The fluorescent intensity presenting in proportion to the intracellular ROS levels, was measured using a fluorescent microplate reader with an excitation wavelength of 480 nm and an emission wavelength of 525 nm (Punfa et al., 2022).
Determination of nitric oxide secretion
The production of nitric oxide (NO) was assessed by quantifying the levels of nitrite or nitrate in the culture supernatant using the Griess reaction (Sigma, USA). In brief, 100 µL of culture supernatant was mixed with 100 µL of Griess reagent and then incubated at room temperature for 15 min in the dark. After incubation, the intensity of the color signal was evaluated by quantifying the absorbance at a wavelength of 540 nm. The relative levels of nitric oxide (NO) generation were calculated against LPS-treated cells. The experiments were performed in 3 independent experiments with at least triplicate per experiment.
Determination of lipid peroxidation
The reaction mixture contained 20 mM linoleic acid emulsion (linoleic acid in phosphate buffer saline (PBS, pH 7.0) with Tween 20), 100 mM Tris-hydrochloric acid (HCl), 20 mM ascorbic acid, and various concentrations of extracts or control γ-oryzanol. Then, 40 mM FeSO4•H2O was added to start the reaction. The reaction tubes were incubated at 37°C in the dark for 30 min and terminated by adding 103.5 µl of 40% v/v trichloroacetic acid. The reaction mixture was then treated with 1% w/v thiobarbituric acid in 50 mM sodium hydroxide solution, heated to 95°C for 10 min, then centrifuged at 3,000 rpm for 10 min. The absorbance of thiobarbituric acid-reacting substance (TBARS) in the supernatant was detected at 532 nm. All samples were analyzed in triplicate. The results were reported as the 50% inhibitory concentration value (IC50) (Choi et al., 2002).
Determination of in vitro glycation of bovine serum albumin (BSA)
The extracts were dissolved in DMSO (200 µg/ml) and incubated in 10 mg/ml BSA with 1.1 M glucose in 0.1 M phosphate buffer at pH 7.4 containing 0.2% sodium azide for 2 weeks at 37°C. The production of glycated BSA was evaluated at 355 nm excitation and 460 nm emission (GENios, TECAN). Aminoguanidine (AG) was utilized as the positive control (Muñiz et al., 2018).
Statistical analysis
The data from three different experiments were reported as mean ± SD. Prism version 6.0 software was used for statistical analysis, which included one-way ANOVA with Tukey's multiple comparisons test or Dunnett's multiple comparisons test at P < 0.05 levels.
RESULTS
Total phenolic content (TPC)
The extraction of raw and cooked red rice with 70% ethanol yielded 1.52, 0.33, 1.28, 0.75, and 0.24% for RRRE, CRRE1, CRRE2, CRRE3, and CRRE4, respectively. The average TPC was 3.6 times higher in RRRE (233.40 ± 6.23 mg GAE/g extract) compared to CRREs. While CRREs had average TPC values of 50.69 ± 0.57, 61.85 ± 0.43, 69.91 ± 0.15, and 76.20 ± 1.03 mg GAE/g extract for CRRE1, CRRE2, CRRE3, and CRRE4, respectively (Table 1). Interestingly, the average TPC of CRRE4 was significantly greater than CRRE1, CRRE2, and CRRE3. Cooking reduced the TPC in cooked red rice extracts by 78.28%, 73.50%, 70.05%, and 67.35% for CRRE1, CRRE2, CRRE3, and CRRE4, respectively as compared to RRRE.
Total flavonoid content (TFC)
The TFC in RRRE was determined to be 85.24 ± 8.22 mg CE/g extract, which was considerably 2.5 times higher than that of CRREs. The average TFC values for CRRE1, CRRE2, CRRE3, and CRRE4 were 26.18 ± 2.23, 27.88 ± 2.70, 31.03 ± 1.72, and 36.77 ± 1.40 mg CE/g extract, respectively (Table 1). Similarly to the TPC result, CRRE4 exhibited a greater TFC compared to CRRE1, CRRE2, and CRRE3. Cooking also decreased the TFC of CRRE1, CRRE2, CRRE3, and CRRE4 at 69.29%, 67.30%, 63.60%, and 56.86%, respectively as compared to RRRE.
Total proanthocyanidin content (TPAC)
The TPAC in RRRE was measured to be 77.25 ± 16.21 mg CE/g extract, which was significantly 6.2 times higher than the TPAC in CRREs. The mean TPAC values for CRRE1, CRRE2, CRRE3, and CRRE4 were 11.37 ± 1.48, 11.15 ± 1.46, 12.62 ± 1.92, and 15.09 ± 0.24 mg CE/g extract, respectively (Table 1). Cooking resulted in a reduction of the TPAC of CRRE1, CRRE2, CRRE3, and CRRE4 by 85.28%, 85.57%, 83.66%, and 80.46%, respectively, as compared to RRRE.
Table 1. Total phenolic, flavonoid, and proanthocyanidin contents in the extracts.
|
Extracts |
TPC (mg GAE/g extract) |
% Loss of TPC |
TFC (mg CE/g extract) |
% Loss of TFC |
TPAC (mg CE/g extract) |
% Loss of TAC |
|
RRRE |
233.40 ± 6.23 |
0.00 |
85.24 ± 8.22 |
0.00 |
77.25 ± 16.21 |
0.00 |
|
CRRE1 |
50.69 ± 0.57ab |
78.28 |
26.18 ± 2.23ab |
69.29 |
11.37 ± 1.48ab |
85.28 |
|
CRRE2 |
61.85 ± 0.43ab |
73.50 |
27.88 ± 2.70ab |
67.30 |
11.15 ± 1.46ab |
85.57 |
|
CRRE3 |
69.91 ± 0.15ab |
70.05 |
31.03 ± 1.72ab |
63.60 |
12.62 ± 1.92a |
83.66 |
|
CRRE4 |
76.20 ± 1.03a |
67.35 |
36.77 ± 1.40a |
56.86 |
15.09 ± 0.24a |
80.46 |
Note: Values are means ± SD.
a P-values (P < 0.05) was considered statistically significant between RRRE and CRREs (One-way ANOVA)
b P-values (P < 0.05) was considered statistically significant between CRRE4 and other CRREs (One-way ANOVA)
Phytochemical constituents in the extracts by HPLC
The phenolic compounds of RRRE and CRREs were analyzed in Table 2. After separation by HPLC, the quantitative analysis revealed that chlorogenic acid and protocatechuic acid were the predominant phenolic compound of RRRE and CRREs followed by small amounts of vanillic acid, ferulic acid, and coumaric acid (Table 2).
Table 2. The quantities of phenolic compounds in the extracts by HPLC.
|
Extracts |
Phenolic compounds (mg/g extract) |
||||
|
Chlorogenic acid |
Protocatechuic acid |
Vanillic acid |
Ferulic acid |
Coumaric acid |
|
|
RRRE |
26.98 ± 1.43 |
30.99 ± 8.65 |
6.78 ± 0.18 |
2.89 ± 0.89 |
2.25 ± 0.09 |
|
CRRE1 |
19.62 ± 1.40a |
12.55 ± 0.72a |
2.11 ± 0.18a |
2.82 ± 0.01 |
1.87 ± 0.03 |
|
CRRE2 |
21.33 ± 1.06a |
12.00 ± 0.08a |
3.48 ± 0.25a |
2.63 ± 0.04 |
1.05 ± 0.13 |
|
CRRE3 |
19.92 ± 0.03a |
12.89 ± 0.00a |
3.48 ± 0.79a |
2.75 ± 0.05 |
2.13 ± 0.01 |
|
CRRE4 |
21.17 ± 0.72a |
13.93 ± 0.13a |
3.15 ± 0.11a |
3.95 ± 0.03 |
2.10 ± 0.03 |
Note: Values are means ± SD.
a P-values (P < 0.05) was considered statistically significant between RRRE and CRREs (One-way ANOVA)
Table 3 showed the analysis of flavonoid compounds found in RRRE and CRREs. Following separation by HPLC, the quantitative study found that catechin was the primary flavonoid compound of RRRE (31.43 ± 0.39 mg/g extract), CRRE1 (24.53 ± 0.31 mg/g extract), CRRE2 (26.34 ± 0.84 mg/g extract), CRRE3 (32.17 ± 0.72 mg/g extract), and CRRE4 (32.43 ± 0.32 mg/g extract), with a small amount of epicatechin.
Table 3. The quantities of flavonoid compounds in the extracts by HPLC.
|
Extracts |
Flavonoid compounds (mg/g extract) |
|
|
Catechin |
Epicatechin |
|
|
RRRE |
31.43 ± 0.39 |
6.36 ± 0.75 |
|
CRRE1 |
24.53 ± 0.31a |
2.27 ± 0.38a |
|
CRRE2 |
26.34 ± 0.84a |
3.65 ± 0.35a |
|
CRRE3 |
32.17 ± 0.72 |
3.32 ± 0.43a |
|
CRRE4 |
32.43 ± 0.32 |
3.63 ± 0.16a |
Note: Values are means ± SD.
a P-values (P < 0.05) was considered statistically significant between RRRE and CRREs (One-way ANOVA)
HPLC was also used to detect the amounts of vitamin E analogs, including α-tocopherol, α-tocotrienol, g-tocopherol, g-tocotrienol, and g-oryzanol, as represented by the results in Table 4. RRRE identified 5 vitamin E analogs: α-tocopherol, α-tocotrienol, g-tocopherol, g-tocotrienol, and g-oryzanol, with a concentration of 20.05 ± 0.16, 13.74 ± 0.08, 17.82 ± 0.20, 111.86 ± 0.74, and 83.98 ± 0.30 mg/g extract, respectively. While CRREs identified only 3 vitamin E analogs, with g-oryzanol being the most prevalent, followed by g-tocotrienol and g-tocopherol.
Table 4. The quantities of vitamin E analogs and g-oryzanol in the extracts by HPLC.
|
Extracts |
Vitamin E analogs (mg/g extract) |
g-oryzanol (mg/g extract) |
|||
|
a-tocopherol |
a-tocotrienol |
g-tocopherol |
g-tocotrienol |
||
|
RRRE |
20.05 ± 0.16 |
13.74 ± 0.08 |
17.82 ± 0.20 |
111.86 ± 0.74 |
83.98 ± 0.30 |
|
CRRE1 |
ND |
ND |
9.54 ± 0.43a |
12.61 ± 0.08a |
47.99 ± 0.26a |
|
CRRE2 |
ND |
ND |
15.08 ± 0.77a |
19.06 ± 0.81a |
49.30 ± 0.29a |
|
CRRE3 |
ND |
ND |
9.78 ± 0.34a |
18.94 ± 0.60a |
49.27 ± 0.24a |
|
CRRE4 |
ND |
ND |
7.29 ± 0.24a |
13.75 ± 0.45a |
48.83 ± 0.14a |
|
CRRE4 |
ND |
ND |
7.29 ± 0.24a |
13.75 ± 0.45a |
48.83 ± 0.14a |
Note: Values are means ± SD.
ND: Not detected
a P-values (P < 0.05) was considered statistically significant between RRRE and CRREs (One-way ANOVA)
Antioxidant capacities of the extracts
Like the TPC, TFC, and TPAC results, RRRE demonstrated stronger DPPH and ABTS•+ radical scavenging activity than cooked red rice extracts (Table 5). RRRE can scavenge DPPH and ABTS•+ radicals in a dose-dependent manner, and the SC50 values of RRRE were 42.47 ± 1.10 and 8.16 ± 0.66 µg/ml for DPPH and ABTS•+ radical scavenging activity, respectively. While CRRE1, CRRE2, CRRE3, CRRE4 could inhibit the DPPH radicals with an SC50 of 136.90 ± 9.35, 129.50 ± 2.57, 115.37 ± 3.38, and 106.47 ± 2.32 µg/ml, respectively. In addition, CRRE1, CRRE2, CRRE3, and CRRE4 were shown to effectively suppress the ABTS•+ radicals. The SC50 values for these extracts were measured to be 35.85 ± 6.80, 27.38 ± 3.74, 23.55 ± 0.98, and 20.03 ± 1.30 µg/ml, respectively.
Table 5. DPPH and ABTS•+ radical scavenging activity of the extracts.
|
Extracts |
SC50 of DPPH scavenging activity (µg/ml) |
SC50 of ABTS•+ scavenging activity (µg/ml) |
|
RRRE |
42.47 ± 1.10 |
8.16 ± 0.66 |
|
CRRE1 |
136.90 ± 9.35ab |
35.85 ± 6.80ab |
|
CRRE2 |
129.50 ± 2.57ab |
27.38 ± 3.74a |
|
CRRE3 |
115.37 ± 3.38a |
23.55 ± 0.98a |
|
CRRE4 |
106.47 ± 2.32a |
20.03 ± 1.30a |
Note: Values are means ± SD.
a P-values (P < 0.05) was considered statistically significant between RRRE and CRREs (One-way ANOVA)
b P-values (P < 0.05) was considered statistically significant between CRRE4 and other CRREs (One-way ANOVA)
An intracellular ROS was significantly induced in RAW264.7 cells after treatment with FeSO4. In the presence of RRRE or CRREs (200 µg/ml), the relative levels of intracellular ROS were reduced when compared to the FeSO4-treated alone. The RRRE and CRRE4 had the strongest inhibitory effect on ROS production from the RAW264.7 murine macrophage cell line (42.00% inhibition), followed by CRRE3 (39.33% inhibition), CRRE2 (32.67% inhibition), and CRRE1 (25.67% inhibition), respectively (Figure 2).
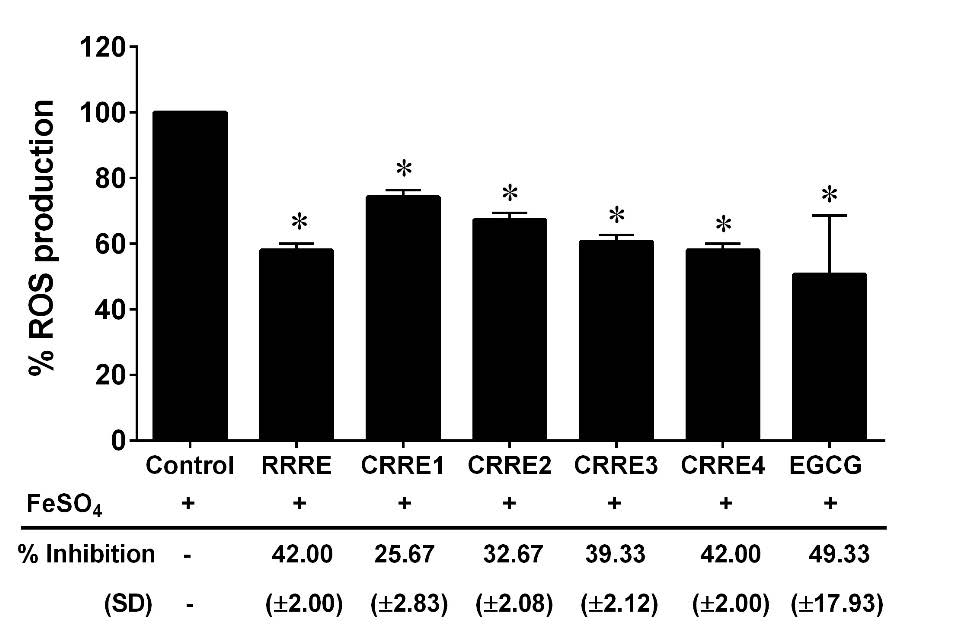
Figure 2. Effect of the extracts on intracellular ROS production in RAW264.7 cells. The data are presented as mean ± SD. *P < 0.05 compared to control.
Effect of the extracts on in vitro nitric oxide secretion and lipid peroxidation
The Griess reaction was used to determine the inhibition of LPS-mediated NO generation in RAW264.7, and the nitrite level in the cultured medium was quantified using a spectrophotometer. Interestingly, RRRE and CRREs at non-toxic dose (200 µg/ml) significantly reduced LPS-induced NO generation compared to control (Figure 3). The RRRE also had the strongest inhibitory effect on NO production from the RAW264.7 murine macrophage cell line (58.33% inhibition), followed by CRRE4 (57.33% inhibition), CRRE1 (51.67% inhibition), CRRE3 (48.00% inhibition), and CRRE2 (41.67% inhibition). Furthermore, all extracts demonstrated the ability to suppress linoleic acid peroxidation. RRRE exhibited the most potent inhibitory effect on linoleic acid peroxidation, with the IC50 value was 37.59 ± 0.95 µg/ml. Followed by CRRE4, CRRE3, CRRE1, and CRRE2 showed progressively lower inhibitory effects with an IC50 of 48.51 ± 0.71, 57.63 ± 1.78, 72.07 ± 1.05, and 80.06 ± 1.26 µg/ml, respectively (Table 6).
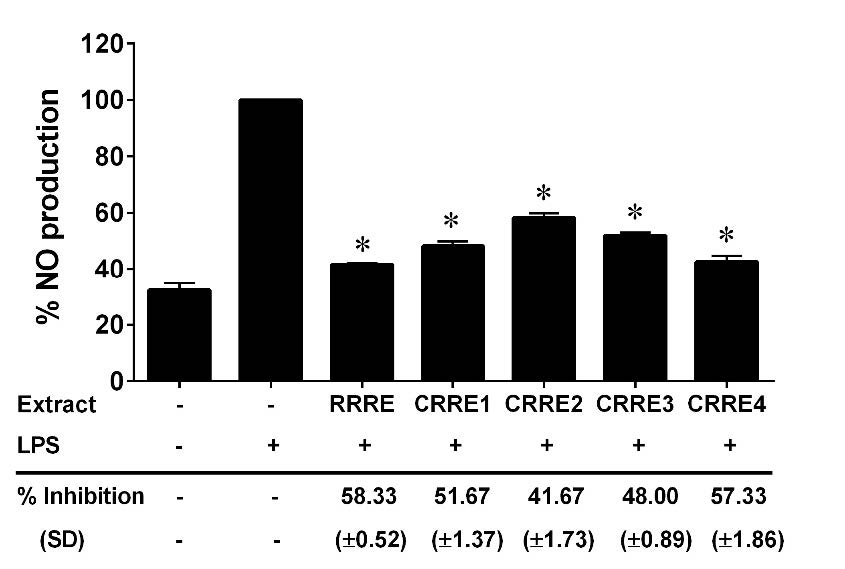
Figure 3. Effect of the extracts on NO production in RAW264.7 cells. The data are presented as mean ± SD. *P < 0.05 compared to control.
Table 6. The IC50 values of the extracts on lipid peroxidation.
|
Extracts |
IC50 of lipid peroxidation (µg/ml) |
|
RRRE |
37.59 ± 0.95 |
|
CRRE1 |
72.07 ± 1.05ab |
|
CRRE2 |
80.06 ± 1.26ab |
|
CRRE3 |
57.63 ± 1.78ab |
|
CRRE4 |
48.51 ± 0.71a |
|
γ-Oryzanol (Positive control) |
34.73 ± 0.73 |
Note: Values are means ± SD.
a P-values (P < 0.05) was considered statistically significant between RRRE and CRREs (One-way ANOVA)
b P-values (P < 0.05) was considered statistically significant between CRRE4 and other CRREs (One-way ANOVA)
Effect of the extracts on in vitro glycation of bovine serum albumin
When BSA/glucose was incubated for two weeks, fluorescence increased considerably. Adding 400 µg/ml of RRRE and CRREs to BSA/glucose media lowered fluorescence intensity compared to BSA/glucose alone. RRRE demonstrated considerably higher levels of the % inhibition of advanced glycation end products (AGEs) production (53.00%) compared to CRREs. While CRRE1, CRRE2, CRRE3, and CRRE4 were found to suppress AGE formation by 30.67%, 27.67%, 22.00%, and 39.00%, respectively (Figure 4).
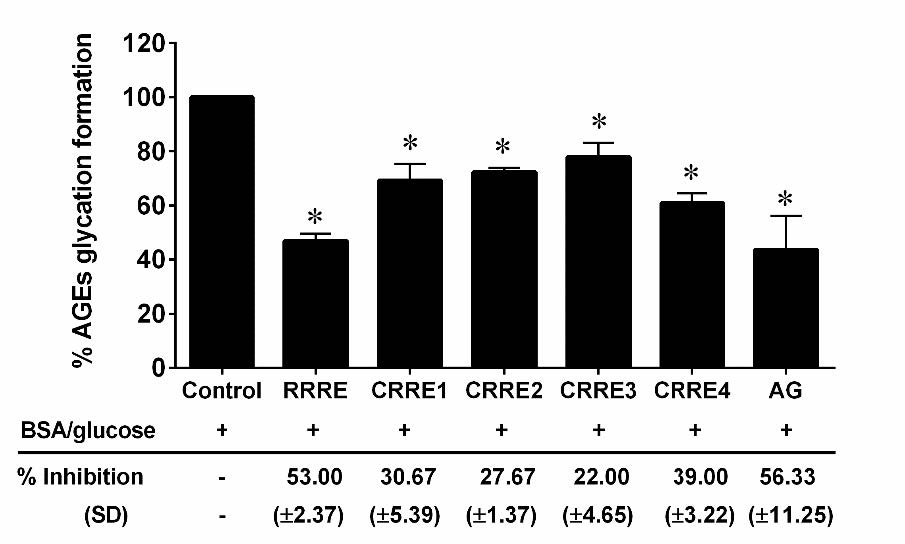
Figure 4. Effect of the extracts on AGEs formation. The data are presented as mean ± SD. *P < 0.05 compared to control.
DISCUSSION
Red rice is a pigmented rice with a long tradition of being one of Thailand's major crops. It is noted for being high in phytochemicals, which have a variety of health benefits. Red rice is a unique cereal that is cooked and eaten whole. Food processing often alters the natural phytochemicals of red rice. In our hands, the effects of cooking on the phytochemical components and biological properties of raw red rice were determined.
Our findings revealed that raw red rice contained 3.6 times more phenolic compounds than cooked red rice using an electric rice cooker, an electric pressure rice cooker, a microwave cooker, or boiling. Phenolic molecules are extremely reactive species, and heating can cause complicated physical and chemical changes such as degradation, polymerization, oxidation, and the release of bound forms of phenols (Palermo et al., 2014). This could be the cause of the phenolics being lost during cooking. According to HPLC study, the phenolic compounds that were lost during cooking were chlorogenic acid, protocatechuic acid, and vanillic acid. Similarly, (Cheng et al., 2014; Volf et al., 2014; Kamiyama et al., 2015) showed a decrease in the amount of chlorogenic acid, protocatechuic acid, and vanillic acid when food processing temperatures increased.
The flavonoid contents of raw red rice changes after cooking, similar to phenolic compounds. Total flavonoid contents, or catechin and epicatechin, flavonoid compounds found in red rice, were lower in cooked red rice than in raw red rice. Wu et al. (2019) found that steaming, microwaving, and boiling significantly reduced flavonoid concentration in food. The considerable flavonoid loss seen after food processing may be ascribed to the combined effects of heat degradation and flavonoid components leaking into cooking water (Tiwari and Cummins, 2013). As a result, this drop could be attributed to flavonoid breakdown or migration into boiling water. While red pigmental proanthocyanidin in red rice are oligomers and polymers containing flavanol-3-ol units. The common units are (epi) catechins and (epi) gallocatechins, which result in procyanidin and prodelphinidin structures, respectively (Pintha et al., 2015). These findings demonstrated that the proanthocyanidin found in raw and cooked red rice was procyanidin (catechin and/or epicatechin), with raw red rice having a higher concentration during heating at higher temperatures resulting in considerable loss of proanthocyanidin in cooked red rice.
Rice contains high levels of vitamin E and g-oryzanol, both of which have been linked to improved health. In the present study, raw red rice had considerably greater mean levels of α-tocopherol, α-tocotrienol, g-tocopherol, g-tocotrienol, and g-oryzanol compared to cooked red rice, according to HPLC analysis. Vitamin E and g-oryzanol are sensitive to oxygen, temperature, and light (Khuwijitjaru et al., 2004; Pignitter et al., 2019). Therefore, cooking reduced vitamin E and g-oryzanol levels in cooked red rice.
After examining the phytochemicals in red rice during the cooking process, we detected a reduction in phytochemical contents compared to raw red rice. The decreasing in phytochemical contents may be attributed to factors such as cooking-induced loss, breakdown, conversion to other compounds, and vaporization. Red rice, as an alternative to white rice, provides several diabetes benefits. The decreased phytochemical contents of cooked red rice may have an impact on biological activity. As a result, we were interested in the anti-diabetes properties of cooked red rice. Previous experimental studies have indicated that overproduction of free radicals and defects in antioxidant defense are involved in the etiology of diabetes (Opara, 2002). Free radicals can have multiple centers, including oxygen, nitrogen, sulfur, and carbon. These frequently include reactive oxygen species (ROS), e.g., superoxides, singlet oxygen, and hydroxy radicals; reactive nitrogen species (RNS), e.g., nitric oxide, which accelerated formation related with hyperglycemia (Halliwell and Guttreridge, 1999). These reactive particles damaged the cell membrane and accelerated the production of AGEs (Rajendiran et al., 2018). Therefore, we evaluated the antioxidant, anti-NO production, anti-lipid peroxidation, and anti-glycemic activities of cooked red rice.
The results suggested that cooked red rice extract retained antioxidant activities based on the DPPH and ABTS assays. Furthermore, cooked red rice extract decreased ROS and NO production in RAW264.7 cells. Although, the overall phenolic, flavonoid, and proanthocyanidin in cooked red rice extract were lower than those in raw red rice extract due to bioactive compounds loss during cooking. Surprisingly, cooked red rice extract demonstrated in vitro lipid peroxidation and AGEs production comparable to raw red rice extract. Several phytochemicals found in cooked red rice have demonstrated anti-diabetic properties through various mechanisms. Chlorogenic acid has been reported to inhibit glucose-6-phosphatase activity, reduce intestinal glucose absorption, and improve insulin sensitivity (Meng et al., 2013). Catechin and epicatechin, common flavonoids in red rice, are known to enhance pancreatic β-cell function and protect against oxidative stress-induced damage (Fatima et al., 2022). g-Oryzanol and tocotrienols, vitamin E analogs present in red rice, exhibit hypoglycemic effects by modulating lipid metabolism, suppressing inflammation, and improving insulin signaling pathways (Saji et al., 2019). These bioactive compounds contribute synergistically to glycemic control, making cooked red rice a promising functional food for diabetes management.
Among the tested cooking methods, boiled red rice (CRRE4) consistently retained the highest levels of phytochemicals, including phenolic, flavonoid, and proanthocyanidin compounds, and demonstrated superior antioxidant and anti-glycation activities. These findings suggest that boiling is the most effective method for preserving the anti-diabetic properties of red rice. This practical insight is particularly relevant for individuals with diabetes, for whom the consumption of red rice cooked via boiling may offer greater health benefits compared to other methods, such as pressure or microwave cooking.
CONCLUSION
This study discovered a decrease in phytochemicals contents such as phenolic compounds, flavonoid compounds, proanthocyanidin, vitamin E, and g-oryzanol in cooked red rice compared to raw red rice, which could be attributed to loss, breakdown, or vaporization during cooking. Cooked red rice, on the other hand, offers anti-diabetes features such as antioxidant, anti-NO production, anti-lipid peroxidation, and anti-glycemic activities, which are similar to raw red rice, especially boiled red rice. The findings suggested that boiled red rice is a healthy food alternative for diabetes patients due to its retained phytoconstituents and anti-diabetes properties.
ACKNOWLEDGMENTS
The authors wish to acknowledge the School of Medical Sciences, University of Phayao, and the School of Traditional and Alternative Medicine, Chiang Rai Rajabhat University for the use of their facilities and support.
AUTHOR CONTRIBUTIONS
Chakkrit Khanaree and Wanisa Punfa assisted in conducting the experiments, performed the statistical analysis and data visualization, and wrote the manuscript. Komsak Pintha, Payungsak Tantipaiboonwong and Maitree Suttajit designed and conducted all of the experiments and wrote the manuscript. All authors have read and approved of the final manuscript.
CONFLICT OF INTEREST
The authors declare that they hold no competing interests.
REFERENCES
Anitha, R.K., Manorama, W., Sunitha, J., and Sreedhar, M. 2017. Glycemic index of selected newly released rice varieties of Northern Telangana region. International Journal of Current Microbiology Applied Science. 6(7): 4300-4304.
Cheng, Y., Xu, Q., Liu, J., Zhao, C., Xue, F., and Zhao, Y. 2014. Decomposition of five phenolic compounds in high temperature water. Journal of the Brazilian Chemical Society. 25(11): 2102-2107.
Choi, C.W., Kim, S.C., Hwang, S.S., Choi, B.K., Ahn, H.J., and Lee M.Y. 2002. Antioxidant activity and free radical scavenging capacity between Korean medicinal plants and flavonoids by assay-guided comparison. Plant Science. 163: 1161-1168.
Fatima, M.T., Bhat, A.A., Nisar, S., Fakhro, K.A., and Al-Shabeeb Akil, A.S. 2022. The role of dietary antioxidants in type 2 diabetes and neurodegenerative disorders: An assessment of the benefit profile. Heliyon. 9(1): e12698.
Foster-Powell, K., Holt, S.H., and Brand-Miller, J.C. 2002. International table of glycemic index and glycemic load values: 2002. American Journal of Clinical Nutrition. 76(1): 5–56.
Halliwell, B. and Gutteridge, J.M.C. 1999. Free radicals in biology and medicine. In Halliwell, B. and Gutteridge, J.M.C., editors. Free Radicals in Biology and Medicine, 3rd Edition, Oxford University Press, Oxford. p. 1-25.
Jadhav, S.R. 2021. The golden rice bran: Red rice and its health benefits. International Journal of Science and Research (IJSR). 10(3): 775-781.
Kamiyama, M., Moon, J.K., Jang, H.W., and Shibamoto, T. 2015. Role of degradation products of chlorogenic acid in the antioxidant activity of roasted coffee. Journal of Agricultural and Food Chemistry. 63(7): 1996–2005.
Khanaree, C., Punfa, W., Tantipaiboonwong, P., Suttajit, M., Chewonarin, T., Pangjit, K., and Pintha, K. 2021. The attenuation of TNF-α-mediated inflammatory responses in human lung adenocarcinoma cell line by perilla seed and seed meal extract. Chiang Mai University Journal of Natural Sciences. 20(4): e2021074.
Khuwijitjaru, P., Taengtieng, N., and Changprasit, S. 2004. Degradation of gamma-oryzanol in rice bran oil during heating: An analysis using derivative UV-spectrophotometry. Silpakorn University International Journal. 4: 154-165.
Meng, S., Cao, J., Feng, Q., Peng, J., and Hu, Y. 2013. Roles of chlorogenic acid on regulating glucose and lipids metabolism: A review. Evidence-based Complementary and Alternative Medicine. 2013(6778): 801457.
Muñiz, A., Garcia, A.H., Pérez, R.M., García, E.V., and González, D.E. 2018. In vitro inhibitory activity of Acca sellowiana fruit extract on end products of advanced glycation. Diabetes Therapy: Research, Treatment and Education of Diabetes and Related Disorders. 9(1): 67–74.
Nayeem, S., Sundararajan, S., Ashok, A.K., Abusaliya, A., and Ramalingam, S. 2021. Effects of cooking on phytochemical and antioxidant properties of pigmented and non - pigmented rare Indian rice landraces. Biocatalysis and Agricultural Biotechnology. 32: 101928.
Opara, E.C. 2002. Oxidative stress, micronutrients, diabetes mellitus and its complications. Journal of the Royal Society for the Promotion of Health. 122: 28-34.
Palermo, M., Pellegrini, N., and Fogliano V, 2014. The effect of cooking on the phytochemical content of vegetables. Journal of the Science of Food and Agriculture. 94: 1057–1070.
Phannasorn, W., Khanaree, C., Wongnoppavich, A., and Chewonarin, T. 2017. The effect of purple rice (Oryza sativa L. indica) extract on the inflammatory response in a colon cancer cell line and dextran sulfate-induced tumor promotion in the rat colon. Molecular and Cellular Toxicology. 13(4): 433-442.
Pignitter, M., Grosshagauer, S., and Somoza, V. 2019. Stability of vitamin E in foods. In Weber, P., Birringer, M., Blumberg, J., Eggersdorfer, M., Frank, J., editors. Vitamin E in Human Health. Nutrition and Health. Humana Press, Cham. p. 215-232.
Pintha, K., Yodkeeree, S., and Limtrakul, P. 2015. Proanthocyanidin in red rice inhibits MDA-MB-231 breast cancer cell invasion via the expression control of invasive proteins. Biological & Pharmaceutical Bulletin. 38(4): 571–581.
Pintha, K., Yodkeeree, S., Pitchakarn, P., and Limtrakul, P. 2014. Anti-invasive activity against cancer cells of phytochemicals in red jasmine rice (Oryza sativa L.). Asian Pacific Journal of Cancer Prevention. 15(11): 4601–4607.
Punfa, W., Khanaree, C., Pintha, K., Suttajit, M., and Tantipaiboonwong, P. 2022. Protective effect of perilla leaf extract against ROS formation and inflammation induced by TNF-α in A549 human lung carcinoma cell line. Songklanakarin Journal of Science & Technology. 44(2): 361.
Punfa, W., Tantipaiboonwong, P., Pintha, K., Suttajit, M., and Khanaree, C. 2024. Evaluation of phytoconstituents, nutritional quality, and in vitro biological activities of red rice ethanolic extract from different regions of Chiang Rai and Phayao. Journal of Current Science and Technology. 15(1): 84.
Rajendiran, D., Packirisamy, S., and Gunasekaran, K. 2018. A review on role of antioxidants in diabetes. Asian Journal of Pharmaceutical and Clinical Research. 11(2): 48-53.
Saji, N., Francis, N., Schwarz, L.J., Blanchard, C.L., and Santhakumar, A.B. 2019. Rice bran derived bioactive compounds modulate risk factors of cardiovascular disease and type 2 diabetes mellitus: An updated review. Nutrients. 11(11): 2736.
Saragih, B., Rachmawati, M., Marwati, and Suhardi. 2017. Nutrition and blood glucose response of food formulated four types of local flour east kalimantan added plant extracts tiwai (Eleuthera americana Merr). IOSR Journal of Environmental Science, Toxicology and Food Technology. 11(2): 37-43.
Sun, Q., Spiegelman, D., van Dam, R.M., Holmes, M.D., Malik, V.S., Willett, W.C., and Hu, F.B. 2010. White rice, brown rice, and risk of type 2 diabetes in US men and women. Archives of Internal Medicine. 170(11): 961–969.
Tantipaiboonwong, P., Pintha, K., Chaiwangyen, W., Chewonarin, T., Pangjit, K., Chumphukam, O., Kangwan, N., and Suttajit, M. 2017. Anti-hyperglycaemic and anti-hyperlipidaemic effects of black and red rice in streptozotocin-induced diabetic rats. ScienceAsia. 43: 281–288.
Tiwari, U. and Cummins E. 2013. Factors influencing levels of phytochemicals in selected fruit and vegetables during pre- and post-harvest food processing operations. Food Research International. 5: 497 –506.
Veni, B.K. 2019. Nutrition profiles of different colored rice: A review. Journal of Pharmacognosy and Phytochemistry. SP2: 303-305.
Volf, I., Ignat, I., Neamţu, M., and Popa, V. 2014. Thermal stability, antioxidant activity, and photo-oxidation of natural polyphenols. Chemical Papers. 68(1): 121-129.
Wu, X., Zhao, Y., Haytowitz, D.B., Chen, P., and Pehrsson, P.R., 2019. Effects of domestic cooking on flavonoids in broccoli and calculation of retention factors. Heliyon. 5: e01310.
OPEN access freely available online
Natural and Life Sciences Communications
Chiang Mai University, Thailand. https://cmuj.cmu.ac.th
Chakkrit Khanaree1, Payungsak Tantipaiboonwong2, Komsak Pintha2, Maitree Suttajit2, and Wanisa Punfa1, *
1 School of Traditional and Alternative Medicine, Chiang Rai Rajabhat University, Chiang Rai 57100, Thailand.
2 Division of Biochemistry, School of Medical Sciences, University of Phayao, Phayao 56000, Thailand.
Corresponding author: Wanisa Punfa, E-mail: wanisapun@hotmail.com
ORCID:
Chakkrit Khanaree: https://orcid.org/0000-0003-4870-8465
Payungsak Tantipaiboonwong: https://orcid.org/0000-0003-1435-8882
Komsak Pitha: https://orcid.org/0000-0003-3547-6861
Wanisa Punfa: https://orcid.org/0000-0002-8862-0743
Total Article Views
Editor: Nisit Kittipongpatana,
Chiang Mai University, Thailand
Article history:
Received: August 2, 2024;
Revised: May 18, 2025;
Accepted: June 19, 2025;
Online First: July 15, 2025