 ISSN: 2822-0838 Online

Assessing Efficiency of Soil Sulfur Extractants for Fragrant Rice Production
Sirilak Chaiboontha, Chananath Chanauksorn, Aziz Ahmed, Choochad Santasup, Chanakan Prom-u-thai, Jim Wang*, and Fapailin Chaiwan*Published Date : June 25, 2025
DOI : https://doi.org/10.12982/NLSC.2025.048
Journal Issues : Number 3, July-September 2025
Abstract Various chemical extractants have been used for assessing soil sulfur (S) availability for fertilizer recommendations. Currently there is no specific extractant associated with fragrant rice production although S fertilization enhances productivity and aroma intensity as characterized by 2-Acetyl-1-Pyrroline (2AP) content. Field trials were established in five locations to evaluate chemical extractants for plant-available S in acid soils, which represent most fragrant rice production in the north and northeast Thailand. Fragrant rice cultivar KDML105 was grown under a range of S fertilizer rates. Soil samples were collected before planting and at 7 days after S fertilization and extracted with 0.01M Ca(H2PO4)2, 0.25M KCl (40°C), 1N NH4OAc, and distilled H2O followed by turbidimetric S detection. The extracted S was related to rice grain yield, 2AP content and S in leaf. The 0.01M Ca(H2PO4)2 extracted the most S from these acid soils followed by H2O, 0.25M KCl (40°C), and 1 N NH4OAc, but all highly correlated with each other (r = 0.95-0.99, P < 0.01). The 1N NH4OAc, 0.25M KCl (40°C), and distilled H2O, had significantly positive correlations with grain 2AP content at three out of 5 locations, while 0.01M Ca(H2PO4)2 had two. The 1N NH4OAc, which generally had higher correlation coefficients with grain 2AP (r = 0.63-0.83, P < 0.05) and S in leaf (r = 0.79-0.81, P < 0.01), was selected for assessing S deficiency for fragrant rice production in lowland acid soils with a critical soil test S level of 13.9 mg/kg. Rice grain 2AP content was highly and linearly related to soil organic matter (Y = 1.65X+2.40, R2 = 0.84, P < 0.01). The enhancement for fragrant grain yield by S fertilization was found more likely in low organic matter (OM) soils rather in OM-rich S-deficient soils.
Keywords: Fragrant rice, Sulfur, 2AP, Soil test extractant, Acid soils
Funding: The authors are grateful for the Agricultural Research Development Agency (ARDA).
Citation: Chaiboontha, S., Chanauksorn, C., Ahmed, A., Santasup, C., Prom-u-thai, C., Wang, J., and Chaiwan, F. 2025. Assessing efficiency of soil sulfur extractants for fragrant rice production. Natural and Life Sciences Communications. 24(3): e2025048.
INTRODUCTION
Sulfur (S) is an essential nutrient that is required for the adequate growth and development of plants, plays an important role as a constituent of essential amino acids (cysteine, methionine) involved in chlorophyll production in plants. In rice, S fertilization enhances the number of tillers, spikelets per panicles, and helps to mitigate abiotic stresses such as drought and salinity (Bolger et al., 2022; Shah et al., 2022; Om et al., 2023). Ramandeep et al. (2024) found that S metabolites could contribute to synergism in interactions of plant and rhizosphere microorganisms in enhancing S mineralization. Especially, applying S fertilizer in fragrant rice not only enhances yield but also 2AP, a key compound that controls aromatic quality (Chaiboontha et al., 2023).
Sulfur amendment promotes 2AP formation by influencing S-adenosylmethionine decaboxylase (SAMDC) which catalyzes the conversion of precursors such as putrescine, spermidine and spermine to Δ1 –pyrroline and 2AP (Chutipaijit and Sompornpailin, 2011; Renuka et al., 2022). Application of S fertilizer to a S-deficient soil increased the aroma, grain quality and grain yield of rice (Suwannarit et al., 1997). Additionally, sulfur influenced the growth, yield contributing traits and yield of boro rice (AKM et al., 2023). While S fertilization has been established for various plants crops, it has not been well documented for fertilization of fragrant rice cultivars, especially in Thailand where fragrant rice accounts for 53.67% of world consumption (Ministry of Commerce, 2022). On the other hand, soil inorganic S contents vary throughout the year due to seasonal fluctuation as a result of changes of the balance between microbial activity, leaching, surface runoff, atmospheric inputs, plant uptake, plant senescence inputs and fertilizer addition (Blair et al., 1993; Ramandeep et al., 2024). For this reason, soil sulfur testing for fertilizer recommendations often does not reflect crop S requirements (Cihacek et al., 2015).
Different techniques have been used to extract available S from soil, generally including two main categories with the one focusing on measurement of primarily inorganic S and the other one on inorganic S plus a fraction of organic S that become available during growing season. Different salt solutions including phosphates such as Ca(H2PO4)2, and KH2PO4; chlorites such as CaCl2, NH4Cl, LiCl2, and MgCl2; as well as acidic solutions such as NH4OAc+acetic acid, Bray I, HCl along with deionized water (H2O) have been used for inorganic S extraction (Blair et al., 1993). For inorganic plus a fraction of organic S, especially the ester sulfates; alkaline solutions such as NaHCO3 (0.5 N), NaOH and neutral 1N NH4OAc, as well as 0.25M KCl with heat treatment at 40°C have been showing promising in predicting plant available S in the soil (Anderson et al., 1992).
Among these different extraction techniques, Suzuki (1978) reported that phosphate solutions could be used as effective method for the estimation of available S contents of lowland rice soils although they were originally proposed for upland crops that gave high correlation coefficients. According to Warman and Sampson (2008), Ca(H2PO4)2-H2O was effective for extracting plant-available soil S compared to 0.1M CaCl2, Bray 1 and de-ionized water. On the other hand, others showed that CaCl2 extraction with Inductively coupled plasma atomic emission spectroscopy (ICP–AES) detection was best correlated with S added to soils after comparison of six extractions including 1M NH4OAc, KH2PO4, Ca(H2PO4)2, CaCl2, Morgan, and Mehlich 3 (Ketterings et al., 2011). Anderson et al. (1992) reported that 0.25M KCl extractant (heat 40°C) had the highest correlation between soil S test level and % maximum yield after comparing water, 0.01M Ca(H2PO4)2, 0.5M NaHCO3, and 0.25M KCl heated for 3 h at 100, 80, 40, or 25°C on soils from 18 field trials. Cihacek et al. (2015) also found that KCl extractant (at room temperature) was more effective than Ca(H2PO4)2, KH2PO4, 0.25M KCl (40°C), H2O, Diethylenetriamine-pentaacetic acid (DTPA), and Mehlich 3 extractants.
Although phosphate solutions such as Ca(H2PO4)2, and KH2PO4 extractants are commonly used to predict S availability, these extractants were originally proposed for upland soils (Suzuki, 1978). In Thailand, other extraction methods solutions including 1N NH4OAc and 0.25M KCl are also used and recommended for assessing general plant-available S in the soil (Sukitprapanon et al., 2015; Jaisue et al., 2021). However, there has been less reported work for estimation of available S contents for lowland rice soils, especially for the fragrant rice production. As S is one of the candidate nutrients playing an important role in enhancing grain yield and 2AP content in fragrant rice, it is therefore important to evaluate different extractants for adequate soil S testing for efficient fertilizer recommendation for fragrant rice production. This will lead to reduced costs of rice production by decreasing the amount of S fertilizer used. The objective of this research is to evaluate the effectiveness of extractants for soil S testing for fragrant rice production.
MATERIALS AND METHODS
Field experiment and tissue analysis
Field trials were established at 5 sites in Chiang Rai and Surin Provinces of Thailand in a randomized complete block design (RCBD) with 4 replications in 2021. Specifically, Chiang Rai consisted of 2 locations (Chiang Rai 1, Chiang Rai 2), and Surin had 3 locations (Surin 1, Surin 2 and Surin 3).These locations represented main fragrant rice production area of northern and northeastern Thailand. Each trial site consists of treatment plots of 5 m × 3 m separated by bunds of 0.5 m width and 0.5 m height. The water outlets of plots were prepared to ensure that the drained water would not enter the inlet of neighboring plots. Seeds of fragrant rice variety Khao Dawk Mali 105 (KDML 105) were prepared by germinating seeds in the prepared seed beds to obtain 30-day old seedling. Seedlings were transplanted into the fields with three seedlings/hill and 25×25 cm spacings between hills, during rice plant growth weed and pest were controlled by applying 2,4-D dimethyl ammonium and carbosulfan as recommended by the Rice Department (RD) of Thailand. Five rates of S at 0 (control), 30, 60, 90, and 120 kg S/ha as (NH4)2SO4 along with 57 kg P2O5/ha and 57 kg K2O/ha were applied as one-time basal fertilizer, broadcast by hand 7 days after transplanting. The rest of N in the form of urea was applied to make up to a total 138 kg N/ha as recommended by the RD of Thailand with splitting application of 50% at basal and 50% at the panicle initiation stage. During the rice-growing season (July-November in 2021) in Chiang Rai, average daytime temperature and average nighttime temperature were 32.1°C and 21.9°C, respectively. The relative humidity was 63.0-96.0% and the rainfall ranged from 77.0-314.0 mm. In Surin province, average daytime temperature and average nighttime temperature were 32.0°C and 23.0°C, respectively. The relative humidity was 57.0-97.0%, and the rainfall ranged from 16.8-262.3 mm.
The rice leaf samples were collected at tillering and analyzed for total S contents by dry combustion since at this stage rice plants uptake the most S for their growth to develop stems and agronomic yields (Om et al., 2023; Mahmuda et al., 2024). The rice yield was obtained from each treatment plot by harvesting grain at maturity with the help of sickles approximately 25–30 days after completion of flowering. The grain aroma intensity was determined for 2AP based on extraction using indirect steam distillation of uncooked brown rice samples in a two-neck round- bottom flask followed by separation using dichloromethane in a rotary evaporator. The concentrated extract was then analyzed by capillary gas chromatography-mass spectrometry (GC-MS) (Mahatheeranont et al., 2001).
Soil sample collection and analysis
Initial soil samples before planting and fertilization were taken from the fields in April 2021 from five locations and analyzed for basic soil physical and chemical properties (Table 1). Soil pH was measured using a glass electrode with a 1:1 soil: water mixture, organic matter content (OM) was determined using the wet oxidation method (Walkley and Black) (Suraj, 2020), NH4+-N was determined by incubation method (Figueiredo et al., 2019; Nils and Hans, 2024) and available P was determined using the Bray-II method (Food and Agriculture Organization of the United Nations, 2021). Exchangeable K was determined by flame photometry after extraction with ammonium acetate (pH 7.0) and Fe determined by DTPA extraction followed by ICP-OES detection. Initial soil plant-available S was also determined using four different extractants including 0.01M Ca(H2PO4)2, 0.25M KCl (40°C), 1N NH4OAc, and distilled H2O followed by turbidimetry after precipitation of SO42- with Ba2+ from added BaCl2 and detected with a spectrophotometer (GENESYS 20, Thermo Scientific) at 420 nm wavelength (Tables 2 and 3). The four extractants were chosen based on their widespread usage with the consideration of accuracy, easiness and low cost of extractions for predicting S availability in both upland and rice paddy soils (Suzuki, 1978; Dobermann and Fairhurst, 2000; Jaisue et al., 2021). Since the presence of OM suppressed BaSO4 precipitation and the soil with high OM content also had high S concentrations of organic colloids coprecipitated with the BaSO4 resulting in a higher S measurement, charcoal was used to remove the OM from the solution to ensure accuracy of measurement (Anderson et al., 1992) Besides soil samples taken prior to planting and fertilization, additional soil samples from S treatment plots at the above five locations were also taken 7 days after S fertilizer treatments were applied. These soil samples were used to assess different levels of plant-available S over a range at each location using four extractant methods, and were related to rice yields, S uptake as well as grain 2AP content. All soil samples were air-dried and sieved to pass 2 mm sieve before use for analysis (Table 4).
Table 1. Soil physical and chemical properties of five locations used for field trials before planting and fertilization.
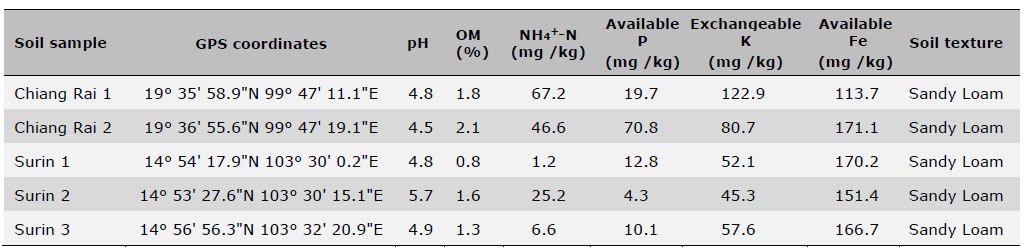
Note: Data are means of two replicates. Coefficient of variation was < 5% for all samples.
pH (1:5, soil: water), Organic matter (OM): Walkley-Black method,
NH4+-N: incubation method, Available P: Bray II, Exchangeable K: NH4OAc.
Table 2. Four extractants used for soil S analysis.
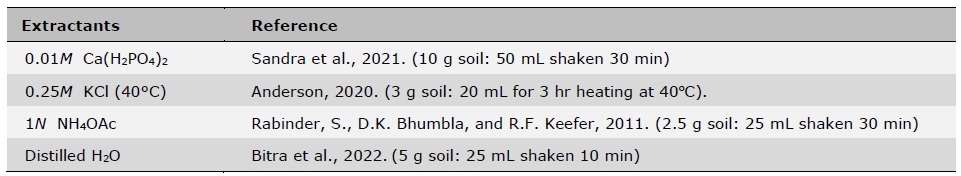
Table 3. Soil extractable S in field trials prior to rice planting and fertilization determined using four different extractants.
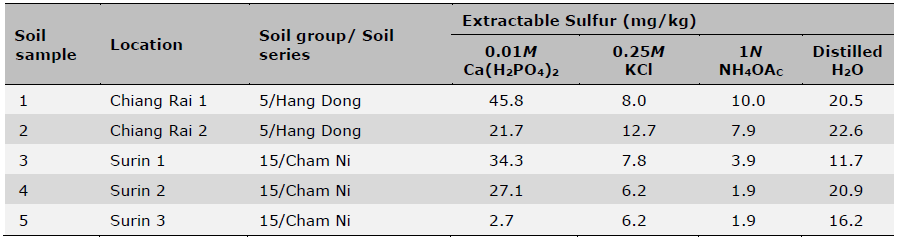
Note: Data are means of two replicates. Coefficient of variation was < 5% for all samples.
Table 4. Soil extractable S for different trial locations as determined by four extractants 7 days after S fertilizer application.
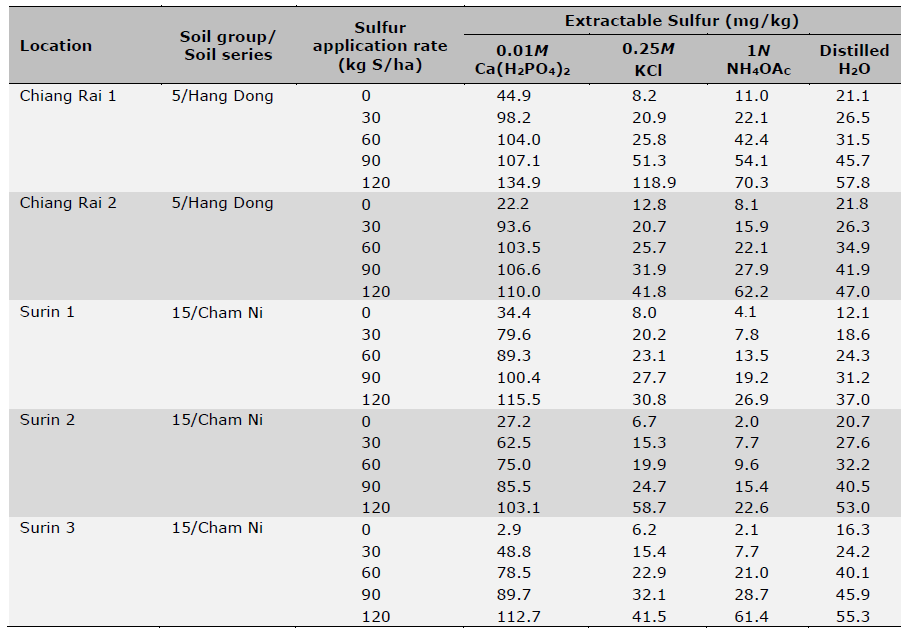
Note: Data are means of four replicates. Coefficient of variation was < 5% for all samples.
Statistical analysis
Statistical analysis of the data was carried out by R software version 4.3.1. Means were compared using a one-way ANOVA. The differences between treatments were compared using the Least Significant Difference (LSD) at a significant level of α = 0.05. Pearson correlation analysis was used to estimate soil extractable S, grain yields, 2AP content and S in leaf of fragrant rice at a significance level of α = 0.05.
RESULTS
Effect of S fertilization rate on grain yield, 2AP content and leaf S
Sulfur fertilization effects on rice yield, grain 2AP content as well as leaf S content are shown in Tables 5, 6, 7, respectively. In general, there were significant differences among S rate treatments except for Chiang Rai 1 (Table 5). Three out of 5 sites had the highest yields at 30-60 kg S/ha, and the other 2 sites at 90 kg S/ha. Sulfur rates also affected 2AP content in rice grains with large variations in trials of some locations (Table 6). Significant differences among S rate treatments were observed in 2 out of 5 location trials with the highest 2AP levels reached at 90 kg S/ha. Sulfur soil amendment also increased leaf S concentrations in rice at tillering stage (Table 7). The leaf S concentration varied significantly across S application rates in all locations except Chiang Rai 1 and Chiang Rai 2, which had high soil S levels by four extraction methods (Table 3). For the three locations of significant effects of S fertilization, the highest leaf S concentration was recorded at 90 kg S/ha (Surin 3 and 5) and 60 kg S/ha (Surin 4). The greatest increase in leaf S levels in response to S fertilization occurred at the lowest soil S level at Surin 5 (by 85.6%), followed by Surin 4 (by 17.1%) and Surin 3 (by 7.9%).
Table 5. Effect of S fertilization rates on grain yield of KDML 105 rice cultivar.
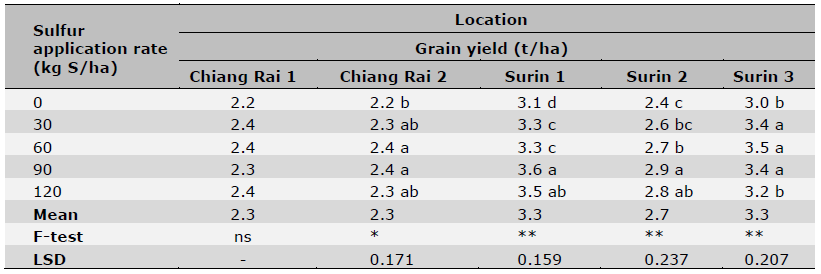
Note: Data are means of four replicates. Coefficient of variation was < 5% for all samples.* = significant (P < 0.05),
** = highly significant (P < 0.01) and ns = non-significant (P > 0.05). Means in the same column followed by different letters indicate significant differences at P < 0.05.
Table 6. Effect of S fertilization rates on grain 2AP content of KDML 105 rice cultivar.
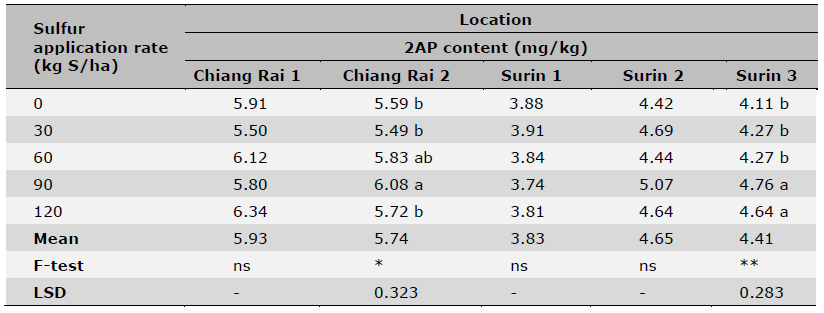
Note: Data are means of four replicates. Coefficient of variation was < 5% for all samples. * = significant (P < 0.05),
** = highly significant (P < 0.01) and ns = non-significant (P > 0.05). Means in the same column followed by different letters indicate significant differences at P < 0.05.
Table 7. Effect of S fertilization rates on leaf S levels of KDML 105 rice cultivar.
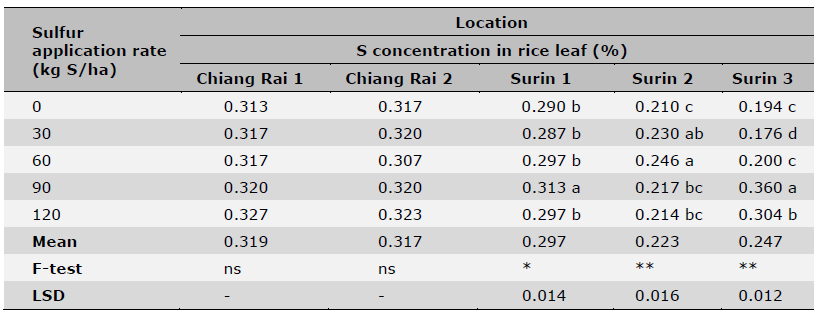
Note: Data are means of four replicates. Coefficient of variation was < 5% for all samples.*=significant (P < 0.05),
**= highly significant (P < 0.01) and ns = non-significant (P > 0.05). Means in the same column followed by different letters indicate significant differences at P < 0.05.
On the other hand, table 8 revealed that four soil S extractants are significantly, positively, and linearly correlated with each other with very high correlation coefficients r = 0.95-0.99 (P < 0.01). The highest correlation coefficients were between 0.01M Ca(H2PO4)2 and 0.25M KCl (40°C) and between 1N NH4OAc and distilled H2O, which showed r = 0.99 (P < 0.01).
Table 8. Correlation coefficient (r) for linear relationship between extractable S by different extractions.
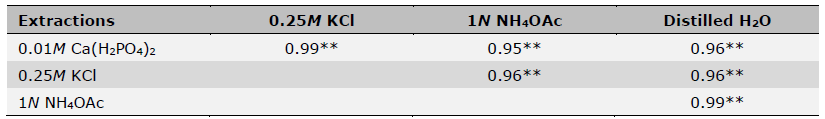
Note: ** significant at P < 0.01
Correlation between extractable S, grain yield, 2AP content
Table 9 showed linear correlations of soil extractable S of different methods with rice grain yield, grain 2AP content and leaf S concentration across S fertilization rates at each location. Among the four extraction methods, 0.01M Ca(H2PO4)2 demonstrated significant correlations with grain yields at all 5 locations as compared to the rest three extractants which had significant correlations at 4 out of 5 locations. However, 0.25M KCl (40°C) and distilled H2O had all significant correlations at α = 0.01 level, whereas 0.01M Ca(H2PO4)2 and 1N NH4OAc had some at α = 0.05 level. Between grain 2AP content and soil extractable S, 0.25M KCl (40°C), 1N NH4OAc as well as distilled H2O methods showed significant correlations in 3 out of 5 locations, while 0.01M Ca(H2PO4)2 had 2 out of 5. As for the correlations with S in rice leaf, all four soil S extraction methods showed 2 significant correlations with S in rice leaf at 2 out of 5 locations with slightly higher coefficients found for 1N NH4OAc.
Table 9. Correlation analysis between different S extractions, grain yield, 2AP content and leaf S contents under different S application rates at 5 different soil sample/locations.
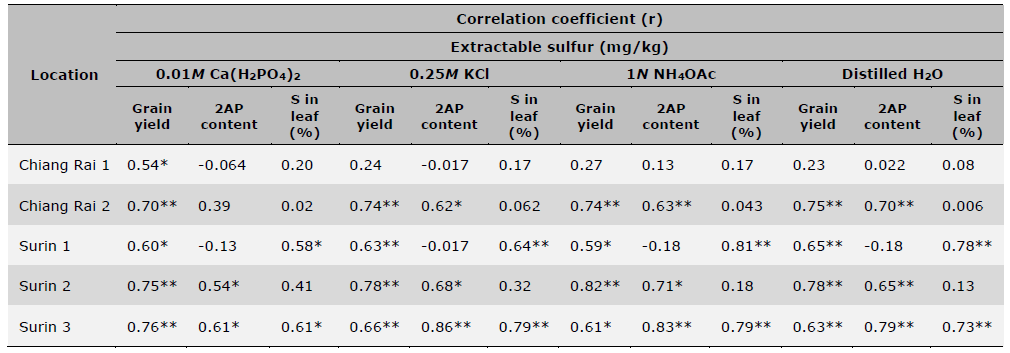
Note: * = significant (P < 0.05), ** = highly significant (P < 0.01), ns = non-significant (P > 0.05).
DISCUSSION
Sulfur fertilization significantly increased rice grain yields in all locations except Chiang Rai 1. Specifically, applying fertilizer S at 30, 60, 90, 90, and 60 kg/ha increased grain yield 9.1%, 9.1%, 16.1%, 20.0%, and 16.7% for the five locations, respectively, compared to the control (Table 5). This result was consistent with the general requirement of S by rice regardless of rice cultivars.
It is well known that measurable amounts of plant-available S using different extraction methods could be influenced by various soil properties such as cation exchange capacity (CEC), total and organic S, pH, etc. (Seal et al., 2005). Therefore, the measurements should be practical and offer an alternative approach for S management that captures the field with S-deficient soils (Jaisue et al., 2021). In this study, the four evaluated methods gave a variable range of extractable S across five locations: 0.01M Ca(H2PO4)2 ranged from 2.7-45.8 mg/kg, 0.25M KCl (40°C) 6.2-12.7 mg/kg, 1N NH4OAc 1.9-10.0 mg/kg, and distilled H2O 11.7-22.6 mg/kg (Table 3). The average percentage of extractable S measured by 0.01M Ca(H2PO4)2 was 68.9%, 80.5%, and 30.4%, greater than 0.25M KCl (40°C), 1N NH4OAc, and distilled H2O, respectively. On the other hand, while these four extraction methods yielded different ranges of soil test S values, they were highly correlated (Table 8), suggesting that they are extracting very similar soil pools of plant-available S with varying proportionality. This would suggest that in general any one of these methods could be used for characterizing plant-available S for these soils.
Critical soil test value (CSTV) for plant-available S based on quadratic plateau model with the sufficiency interpretation at 95% of relative yield plateau of all five locations across soil test levels were derived for the four S extraction methods using a procedure described by Mallarino and Blackmer (1992). As shown in Figure 1, the CSTV for S was 79.8, 20.0, 13.9 and 30.4 mg/kg, respectively, for 0.01M Ca(H2PO4)2, 0.25M KCl (40°C), 1N NH4OAc, and distilled H2O, respectively. Much higher CSTV for S by 0.01M Ca(H2PO4)2 extraction as compared to the rest three extraction methods was surprising since low CSTV values of 5.88 mg/kg, < 9.0 mg/kg and < 11–13 mg/kg were reported including those for Jasmine rice- growing soils (Sanitmatcharo et al., 2017; Dobermann and Fairhurst, 2000; Shawl et al., 2021). On the other hand, it is known that phosphate is more strongly absorbed on soil colloids than sulfate and soil pH further compounds the effect on this difference (Curtin and Syers, 1990; Searle, 2012). When soil pH is in the neutral and alkaline range, soil particles predominantly carry negative charges and sulfate ions are present in soil solution. The phosphate extraction of solution sulfate was much less influenced by the interaction with soil colloid particles. However, in acidic pH range, soil particles carry more positive charges which absorb sulfate. The stronger interaction of phosphate with soil colloids would enable phosphate capable of much stronger displacement of sulfate adsorbed on soil colloids and stronger than other extractions such as acetate and chloride ions in NH4OAC and KCl (Curtin and Syers, 1990; Shahsavani et al., 2006). In a study of 86 Indian soils with pH ranging from 4.5 to 10.6, Sahrawat et al. (2009) showed generally greater extractable S by Ca(H2PO4)2 than by CaCl2 in acidic soils other than in neutral and alkaline soils. In our study, the evaluated soils of the five locations had pH ranging from 4.5 to 5.7, this very acidic nature of these fragrant rice- growing soils likely prompt the very high CSTV of 79.8 mg/kg for S by 0.01 M Ca(H2PO4)2.
It is also interesting that the CSTV for S level by distilled H2O (30.4 mg/kg) was higher than those of 1N NH4OAc (13.9 mg/kg) and 0.25M KCl (40°C) (20 mg/kg). This was likely due to the greater dispersion of organic matter in H2O (Maynard et al., 1987). Appiah and Ahenkorah (1989) found that the amount of SO42--S extracted by H2O at the 1:5 ratio was the highest in comparison with that of diluted HCl and salt extractants on 15 soil samples. Cihacek et al. (2015) also reported that H2O had high extractable S using turbidometry detection followed by KH2PO4, Ca(H2PO4)2, and KCl (40°C) extractions. On the other hand, 1N NH4OAc extraction yielded the lowest CSTV for plant-available S in these acidic soils, lower than 26.5-30 mg/kg reported for those of other region soils (Khan et al., 2012; Sanitmatcharo et al., 2017). 1N NH4OAc method along with 0.25M KCl (40°C) had been used for measurement of inorganic S plus a fraction of the organic S in common pH soils (Anderson et al., 1992). Considering the relative extractability and plant availability of the major forms of soil S, i.e., sulfate ion (SO42--S) which is primarily adsorbed by clays, Fe and Al oxides and the adsorption generally increases as pH decreases, the behavior of these extractants likely vary for different soils S.
Applying S fertilizer also enhanced 2AP content although significant increases were only observed in 2 out of 5 locations including location 5, the lowest soil S site, across S fertilization rates. Overall, grain 2AP content did show gradual elevation with increasing S fertilizer rates compared to the control. Chaiboontha et al. (2023) found that application of S fertilizer at the appropriate rate 90 kg S/ha in low soil S increased grain yield and 2AP content by approximately 13.0% and 9.5%, respectively, compared to the common fertilization practice (using fertilizer mix without S). On the other hand, applying S fertilizer to soils with high OM content may not be needed, because 95% of the total soil S is in organic form, which can become available during the OM degradation throughout the growth season (McLaughlin, 2020; Rai et al., 2020). For the soil with low or deficient S, increasing soil OM content could promote an increase of 2AP content in rice grain. Chinachanta et al. (2020) recently studied KDML 105 variety production in an organic rice farming system and found that higher soil OM levels built in by continued application of composted manure and green manures not only enhanced soil quality indicators such as total N, humic acid, and microbial populations, but also contributed to approximately 3.5 times higher 2AP in rice grain than in that of the conventional rice farming with just chemical fertilizers. In our study, generally higher rice grain 2AP content was found in locations where soils had higher OM contents (e.g. locations 1 and 2), whereas the lowest grain 2AP content was observed in location 3 where the soil had the lowest OM content. Surprisingly, based on mean 2AP contents across all S fertilization plots within a location (Table 5) and SOM content for each location soil (Table 1), it was found that grain 2AP content was highly and linearly related to OM (Y = 1.65X+2.40, R2 = 0.84, P < 0.01). This result further emphasized the importance of SOM on fragrant rice grain 2AP accumulation. The fact that in this study four out of five locations responded significantly to S fertilization treatments with yield increase (Table 4), three locations with S uptake (Table 6) and only two locations with grain 2AP (Table 5) suggested that fragrant rice was more sensitive to yield improvement by S fertilization of S-deficient soils but less sensitive to rice grain 2AP accumulation. In addition, due to the generally higher grain 2AP content observed in high SOM locations, S application in low SOM fields would be more meaningful to increase rice yield as well as 2AP content.
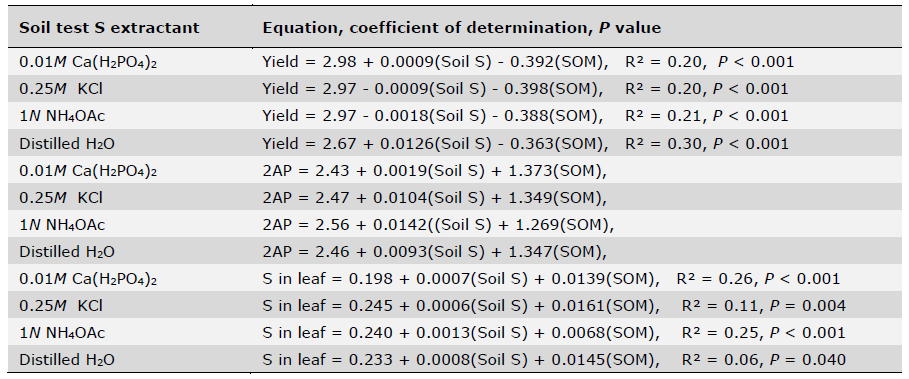
The strong relation between 2AP and SOM also prompted the exploration of multi-variable linear relations including SOM along with soil test S as determined by different extractants to relate to fragrant rice yield, 2AP, and S contents in the leaf. Table 10 shows these multi-variable relations using only data of control plots across all five locations with available SOM data. The regressions also demonstrate a much better description of rice grain 2AP with both soil test S and SOM with similar coefficient of determinations (R2 = 0.61-0.69) than rice yield (R2 = 0.20-0.30) and S in leaf (R2 = 0.06-0.26). These results further indicate the importance of SOM in positively influencing rice grain 2AP for fragrant rice production.
Table 10. Multi-variable regression of yield, 2AP or S in the levels with soil test S based on different extractants and soil organic matter across five trial locations.
As far as which extraction method is more suitable soil test method for predicting fragrant rice S fertility, several factors may need to be considered especially in acidic soils. Although 0.01 M Ca(H2PO4)2 had been widely used for assessing available S for common crops and upland soils (Suzuki, 1978; Warman and Sampson, 2008; Rabinder et al., 2011; Bayram and Hakerlerler, 2022), our study clearly showed that it yielded much higher CSTV for S than those reported in the literature (Anderson et al., 1992), even though it showed correlation with rice yields of all five locations across fertilization rates. On the other hand, 1N NH4OAc extraction showed generally higher correlations with rice grain 2AP content and S in rice leaf than 0.01M Ca(H2PO4)2, 0.25M KCl (40°C), and distilled H2O as well as better fit based on quadratic plateau model of relative yield across all five locations to generate CSTV for soil S (Table 8, Figure 1). According to Kasinam et al. (2022) found that available sulphur extracted by 0.5M NH4OAc showed the highest correlation with dry matter yield, total plant uptake, 0.5M NH4OAc extractant was rated as most promising extractant for assessing S availability for rice in acid soils. In addition, the easiness to make 1N NH4OAc extraction and its wide adoption for soil assessment of other plant-available nutrients enable the implementation in a routine soil testing laboratory and could be used for predicting soil S requirement for fragrant rice production. Nonetheless, it should be pointed out that all four S methods could be used for assessing S-deficient soils since they are highly correlated.
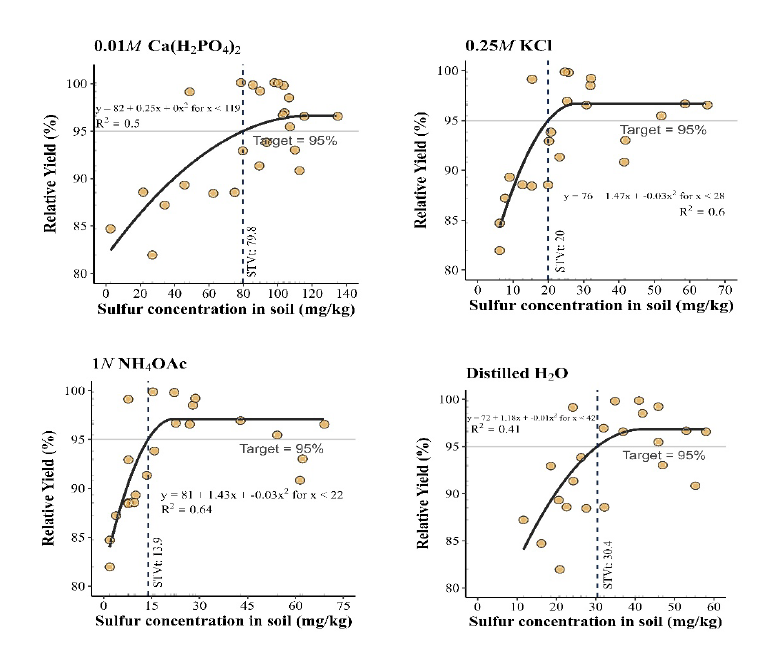
Figure 1. Critical level of soil extractable S at 5 different locations by using 0.01M Ca(H2PO4)2, 0.25M KCl, 1N NH4OAc and Distilled H2O.
CONCLUSION
Four extractants, 0.01M Ca(H2PO4)2 ,0.25M KCl (40°C), 1N NH4OAc and distilled H2O, showed variable ranges of available S in acidic soils (pH 4.5-5.7) for fragrant rice production. Average extractable S from soils was in the order of 0.01M Ca(H2PO4)2 > distilled H2O > 0.25M KCl > 1N NH4OAc. However, the extractable S by all four methods were highly correlated (r = 0.95-0.99, P < 0.01), suggesting the characterization of similar pools of plant-available S in these very acidic soils. Considering correlations between grain yield, 2AP content, leaf S concentration across all locations and the CSTV for available S, 1N NH4OAc was considered suitable and effective method for determining soil S and recommended as extractant for assessing available S in soils for lowland fragrant rice production especially in acid soils. This study also demonstrated that potentially SOM could be considered together with soil test S for managing fertility for enhancing yield and 2AP levels. However, the current study focused primarily on acid soils. More diverse soils/locations may be included in future research to develop a more comprehensive prediction tool for fragrant rice production. Nonetheless, this study indicates the importance of characterizing soil test S in low-S acid soils for managing fragrant rice fertilization.
ACKNOWLEDGEMENTS
The author would like to acknowledge Dr. Duangjai Suriyaarunroj for advice and guidance throughout this research.
AUTHOR CONTRIBUTIONS
Sirilak Chaiboontha assisted in conducting the experiments, performed the statistical analysis and wrote the manuscript. Chananath Chanauksorn assisted in conducting the experiments. Aziz Ahmed performed the statistical analysis and data visualization. All authors have read and approved of the final manuscript.
CONFLICT OF INTEREST
No potential conflict of interest was reported by the authors.
REFERENCES
AKM, A.B., Razita, J.P., Nahar, S., Md, K.H., Moaz, H.P., Cihan, D., Celaleddin, B., and Mohammad, S.I. 2023. Response of sulphur and boron on growth, yield traits and yield of Boro rice (BRRI dhan28) at high Ganges river floodplain of Bangladesh. ISPEC. Journal of Agricultural Sciences. 7(1): 158-172.
Anderson, G.C., Lefroy, R., Chinoim, N., and Blair, G. 1992. Soil sulphur testing. Sulphur in Agriculture. 16: 6-14.
Anderson, G.C. 2020. Sulfate sorption measured by a buffering index over a range of properties of soils from south Western Australia. Soil Research. 58: 651–661.
Appiah, M.R. and Ahenkorah, Y. 1989. Determination of available sulphate in some soils of Ghana using five extraction methods. Biology and Fertility of Soils. 8: 80-86.
Bayram, S.E. and Hakerlerler, H. 2022. Determination of the most suitable method to predict the available sulfur content in cotton growing soils: Evidence from Aegean coast. Turkish Journal of Agriculture - Food Science and Technology. 10: 1944-1949.
Bitra, Y., Pallerla, V., YR, H.S.R., Bagathi, G., and Meraj, A. 2022. Sulphur fractionation in different soils: A review. The Pharma Innovation Journal. 11(7): 86-90.
Blair, G.J., Lefroy, R.B.D., Chinoim, N., and Anderson, G.C. 1993. Sulphur soil testing. Plant and Soil. 155: 383-386.
Cihacek, L., Yellajosula, G., Jacobson, K.A., and Swenson, L. 2015. Comparison of seven SO4 -S extraction methods for analysis by turbidimetry or ICP spectrometry. Communications in Soil Science and Plant Analysis 46: 2649–2659.
Chaiboontha, S., Chanauksorn, C., Thammapichai, P., Santasup, C., and Chaiwan, F. 2023. Sulfur application rates affected grain yield and 2-acetyl-1-pyrroline content in fragrant rice -IAMBEST 2023: 4th International Conference. May 24-6, 2023, Proceedings, TOPIC A: Agriculture, Chumphon, Thailand.
Chinachanta, K., Herrmann, L., Lesueur, D., Jongkaewwattana, S., Santasup, C., and Shutsrirung, A. 2020. Influences of farming practices on soil properties and the 2-acetyl-1-pyrroline content of Khao Dawk Mali 105 rice grains. Applied and Environmental Soil Science. 2020: 8818922
Chutipaijit, S. and Sompornpailin, K. 2011. Polyamines in plant response to various abiotic stresses. Srinakharinwirot Science Journal. 27: 1. https://ejournals.swu.ac.th/index.php/sej/article/view/1455
Curtin, D. and Syers, J.K. 1990. Extractability and adsorption of sulphate in soils. Journal of Soil Science. 40: 305–312.
Dobermann, A. and Fairhurst, T. 2000. Rice: Nutrient disorders & nutrient management. Potash & Phosphate institute of Canada (PPIC) and International Rice Research Institute (IRR). Chapter 3, Mineral Deficiencies; sulfur deficiency; p. 90-94.
Figueiredo, C.C.d., Coser, T.R., Moreira, T.N., Tairone, P.L., Ailton, T.d.V., and Jorge P.F. 2019. Carbon mineralization in a soil amended with sewage sludge-derived biochar. Applied Sciences. 9: 4481.
Food and Agriculture Organization of the United Nations. 2021. Standard operating procedure for soil available phosphorus Bray I and Bray II method. https://openknowledge.fao.org/server/api/core/bitstreams/1e4693b1-9ee2-4e29-91d9-e2f310a8c384/content (Accessed 22 October 2023).
Shawl, A., Wassie, H., and Wondwosen, T. 2021. Effects of phosphorus and sulfur on yield and nutrient uptake of wheat (Triticum aestivum L.) on Vertisols, North central, Ethiopia. Heliyon 7: e06614.
Jaisue, N., Tawinteung, N., Worphet. A., and Khurnpoon, L. 2021. Distribution and management of total and available sulfur under Durian orchard soils in the eastern Thailand. International Journal of Agricultural Technology. 17: 1767-1778.
Ketterings, Q., Miyamoto, C., Mathur, R.R., Dietzel, K., and Gami, S. 2011. A comparison of soil sulfur extraction methods. Soil Science Society of America Journal. 75: 1578.
Khan, M.R., Tarafder, M.A., Rahman, M.H., and Khan, M.K. 2012. Comparison of soil sulphur extractants and determination of critical limit for sesame. Bangladesh Journal of Nuclear Agriculture. 23-24: 53-61.
Kasinam, D., Indira, S., Surbala, D.N., Edwin, L., and Gopimohan, S.N. 2022. Status and distribution of sulphur in acid soils of Imphal East district, Manipur. International Journal of Plant & Soil Science. 34(20): 492-503.
Mahatheeranont, S., Keawsa-Ard, S., and Dumri, K. 2001. Quantification of the rice aroma compound, 2-acetyl-1-pyrroline, in uncooked Khao Dawk Mali 105 brown rice. Journal of Agricultural and Food Chemistry. 49: 773–779.
Mahmuda, A., Mofijul, I.S.M., Mohammad, N.I., Muhammad, S.R., Aminul I., Mariam K., Mosud, I., and Md. Rafiqul I. 2024. Optimizing rice yield and nutrient uptake: Investigating the interaction between nitrogen and potassium in wet season rice cultivation. Advances in Agriculture. 2024: 4984165.
Mallarino, A.P. and Blackmer, A.M. 1992. Comparison of methods for determining critical concentrations of soil test phosphorus for corn. Agronomy Journal. 84: 850-856.
Mark, P., Claire, A., Patrick, F., David, W.T., Tim, S., and Connor, P.J. 2022. The role of Sulphur (S) in crop production. [Cited 2023 October 16]. Available from: https://www.fertilizer-assoc.ie/wpcontent/uploads/2023/01/The-RoleofSulphur-in-Crop-Production-Tech-Bulletin-no.-6.pdf.
Maynard, D.G., Kalra, Y.P., and Radford, F.G. 1987. Extraction and determination of sulfur in organic horizons of forest soils. Soil Science Society of America Journal. 51: 801-805.
McLaughlin, M. 2020. Technical bulletin: Sulfur in soils. Fertiliser Technology Research Centre. https://sciences.adelaide.edu.au/fertiliser/system/files/media/documents /2020-01/factsheet-sulfur-in-soils.pdf (Accessed 1 February 2023).
Ministry of Commerce. 2022. Exporting of Thai Jasmine rice. https://www.ditp.go.th/contents_attach/780244/780244.pdf (Accessed 15 October 2023).
Nils, C.T.E. and Hans, W.O. 2024. An incubation system for the simulation of ammonia emissions from soil surface-applied slurry: Effect of pH and acid type. Agronomy. 14: 1078.
Om, P.N., Paras, K., Bindu, Y., Meenakshi, D., and Atul, K.J. 2023. Sulfur nutrition and its role in plant growth and development. Plant Signaling and Behavior. 18(1): 2030082.
Rabinder, S., Bhumbla, D.K., and Keefer, R.F. 2011. Chapter 7: Recommended soil sulfate-s tests. https://udextension.s3.amazonaws.com/lawngarden/files/2012/10/CHAP7.pdf. (Accessed 21 March 2023).
Rai, A., Singh, A.K., Mishra, R., Shahi, B., Rai, V.K., Kumari, N., Kumar, V., Gangwar, A., Sharma, R.B., Rajput, J., et al. 2020. Sulphur in soils and plants: An overview. International Research Journal of Pure & Applied Chemistry. 21: 66-70.
Ramandeep, K.S., Michael, S.C., Camden, O., and Jagmandeep, S.D. 2024. Revisiting the role of sulfur in crop production: A narrative review. Journal of Agriculture and Food Research. 15: 101013.
Renuka, N., Barvkar, V.T., Ansari, Z., Zhao, C., Wang, C., Zhang, Y., and Nadaf, A.B. 2022. Co-functioning of 2AP precursor amino acids enhances 2-acetyl-1-pyrroline under salt stress in aromatic rice (Oryza sativa L.) cultivars. Scientific Reports 12: 3911.
Sahrawat, K.L., Murthy, K.V.S., and Wani, S.P. 2009. Comparative evaluation of Ca chloride and Ca phosphate for extractable sulfur in soils with a wide range in pH. Journal of Plant Nutrition and Soil Science. 172: 404–407.
Sandra, C.P.U., Fernando, F.F.H., Valdinar, F.M., Deyse, C.O.d.S., Armando, J.d.S., and Laís, d.B.C. 2021. Available sulphur by different extractants in soils of the state of Ceará, Brazil. Revista Ciência Agronômica. 4(52): 20207508.
Sanitmatcharo, P., Thanachit, S., Anusontpornperm, S., and Kheoruenromne, I.r.b. 2017. Status of sulfur in jasmine rice growing soil and effect of sulfur fertilizer on Khao Dawk Mali 105 rice. Khon Kaen Agriculture Journal. 45: 35-46.
Seal, A.K., Bera, Mukhopadhyay, K., and Gupta, S.K. 2005. Estimation of available sulphate- sulphur: A comparative analysis with deferent extractant. Journal of Interacademicia. 9: 352-356.
Searle, P.L. 2012. Measurement of adsorbed sulphate in soils effects of varying soil: Extractant ratios and methods of measurement. New Zealand Journal of Agricultural Research. 22: 287-290.
Shah, S.H., Islam, S., and Mohammad, F. 2022. Sulphur as a dynamic mineral element for plants: A review. Journal of Soil Science and Plant Nutrition. 22: 2118-2143.
Shahsavani, S., Ardalan, M., and Sistani, K.R. 2006. Sulphate adsorption in soils of north and northeast Iran. Communications in Soil Science and Plant Analysis. 37: 1587-1596.
Shawl, A., Wassie, H., and Wondwosen, T. 2021. Effects of phosphorus and sulfur on yield and nutrient uptake of wheat (Triticum aestivum L.) on Vertisols, north central, Ethiopia. Heliyon. 7(3): e06614.
Sukitprapanon, T., Suddhiprakarn, A., Kheoruenromne, I., Anusontpornperm, S., and Gilkes, R.J. 2015. Forms of acidity in potential, active and post-active acid sulfate soils in Thailand. Thai Journal of Agricultural Science. 48: 133-146.
Suraj, P. 2020. Organic matter determination (Walkley -black method). https://doi.org/10.13140/RG.2.2.22043.00807
Suwannarit, A., Kreetapirom, S., Buranakarn, S., Suriyapromchai, P., Varanyanond, W., and Tungtrakul, P. 1997. Effects of sulfur fertilizer on grain qualities of Khaw Dauk Mali-105 rice. Kasetsart Journal. 31: 305-316.
Suzuki, A. 1978. Sulfur nutrition and diagnosis of sulfur deficiency of rice plants. The Japan Agricultural Research Quarterly. 12: 7-11.
Thambhitaks, K. and Kitchaicharoen, J. 2021. Valuation of external costs of wet-season lowland rice production systems in northern Thailand. Chiang Mai University Journal of Natural Sciences. 20(3): e2021057.
Warman, P.R. and Sampson, H.G. 2008. Evaluation of soil sulfate extractants and methods of analysis for plant available sulfur. Communications in Soil Science and Plant Analysis. 23: 793-803.
OPEN access freely available online
Natural and Life Sciences Communications
Chiang Mai University, Thailand. https://cmuj.cmu.ac.th
Sirilak Chaiboontha1, 2, Chananath Chanauksorn3, Aziz Ahmed4, 5, Choochad Santasup1, Chanakan Prom-u-thai1, 6, Jim Wang4, *, and Fapailin Chaiwan1, *
1 Department of Plant and Soil Sciences, Faculty of Agriculture, Chiang Mai University, Chiang Mai 50200, Thailand.
2 Chiang Rai Rice Research Center, Rice Department, Chiang Rai 57120, Thailand.
3 Surin Rice Research Center, Rice Department, Surin 32000, Thailand.
4 School of Plant, Environmental and Soil Science, Louisiana State University Agricultural Center, Baton Rouge, 70803, LA, United States.
5 Center for Environmental Sciences, University of Sindh, Jamshoro, 76080, Sindh, Pakistan.
6 Lanna Rice Research Center, Chiang Mai University, Chiang Mai 50200, Thailand.
Corresponding author: Jim Wang, E-mail: jjwang@agecenter.lsu.edu
Fapailin Chaiwan, E-mail: fapailin.c@cmu.ac.th
ORCID ID: Fapailin Chaiwan: https://orcid.org/0000-0002-4015-6398
Total Article Views
Editor: Tonapa Pusadee,
Chiang Mai University, Thailand
Article history:
Received: October 24, 2024;
Revised: April 27, 2025;
Accepted: May 19, 2025;
Online First: June 27, 2025