 ISSN: 2822-0838 Online

Pesticide Residues Detection in Agricultural Products
Braja Manggala, Chatchawan Chaichana*, Wahyu Nurkholis Hadi Syahputra, and Wasin WongwilaiPublished Date : July 10, 2023
DOI : https://doi.org/10.12982/NLSC.2023.049
Journal Issues : Number 3, July-September 2023
Abstract Pesticides have been the most often used substance in recent decades to protect agricultural goods from pests affecting farmers, especially in conventional agriculture. Pesticides are effective in preventing and removing pests. On the other hand, pesticides risk human health since they may be found in agricultural goods for an extended time. As a result, it is critical to have a robust analytical procedure in place to monitor pesticide residues in agricultural products. Chromatography, Raman spectroscopy, and Ultraviolet-visible (UV-VIS) - Near Infrared (NIR) are methods used to identify pesticide residues, and each has benefits. Additionally, a cutting-edge technique called hyperspectral imaging has recently been employed. This review paper discusses the most current application of those approaches, combined with machine learning and chemometrics, in identifying pesticide residues in agricultural goods such as crops, vegetables, and fruits. The approach's basic principles, benefits, and drawbacks will be briefly addressed. Our findings indicate that those methods provide precise and stable results for identifying pesticide residues in agricultural products. However, most of those methods are possessed a high initial cost, complex processes, time-consuming, which is inappropriate with the agricultural modern concept, especially related to smallholder farmers. Hence, shortly, a low-cost, portable, and highly accurate internet-connected device must be developed.

Keywords: Pesticide residue, Chromatography, Raman spectroscopy, UV-VIS-NIR spectroscopy, Hyperspectral imaging
Citation: Manggala, B., Chaichana, C., Syahputra, W. N. H. and Wongwilai, W. 2023. Pesticide residues detection in agricultural products: A review. Natural and Life Sciences Communications. 22(3): e2023049
INTRODUCTION
Food safety issues have raised global health concerns with frequent pesticides contamination of food products. Pesticides can harm the human body by damaging the digestive and respiratory systems as well as the skin, which can adversely effect human health. Eating pesticide-contaminated food is one of the main ways of coming into contact with pesticides (Xu et al., 2017). However, these effects range from short-term (e.g., skin and eye irritation, headaches, dizziness, and nausea) to chronic impacts (e.g., cancer, asthma, and diabetes) depending on several factors (Kim et al., 2017).Pesticides not only harm human health but also disrupts the surrounding environment. It has been estimated that less than 0.1% of pesticides applied to crops actually reaches the target pest, the rest enters the environment haphazardly, which might directly expose the area, and affect non-target organisms (Arias-Estévez et al., 2008). In general, small amounts of pesticides may be left on agricultural products in a transparent layer after their application.
Several practices have been applied to prevent agricultural products from being contaminated with pesticides, including organic farming, which can be implemented through open, semi-closed, or closed farming systems. In the conventional organic farming system, the farmers might apply pheromones to disturb pest mating cycles or use mechanical control such as control trapping to manage pests. However, these prevention techniques might not be effective against all pests, making the use of pesticides unavoidable. At the same time, the condition of semi-closed and closed farming systems is more conducive due to the use of isolation material, which suppresses the system's interaction with the surrounding ambient. Despite both farming systems being effective in preventing most pests, these techniques are not yet suitable for fruit trees, staple crops, and plants taller than 30 cm (Kozai et al., 2015).
Therefore, the detection and discrimination of pesticide residues remain of great importance. Currently, chromatography methods are mostly used for dectecting pesticide residues, as they provide highly accurate and precise result. Although the outcome of this method is reliable, its use for in-situ analysis has been constrained by the initial cost, complex process, and time-consuming analysis (Liu et al., 2021). Furthermore, spectroscopy techniques such as Raman and UV-VIS-NIR spectroscopy have been deployed to assist in the discovery of pesticide residues on agricultural products. Pesticides can be easily identified based on their unique fingerprint features that are collected using spectroscopy techniques (Li et al., 2021). Recently, the Hyperspectral Imaging System (HSI) has been used to detect pesticide residues by extracting both spectral and spatial data from the product. This makes it possible to map the distribution of pesticide residues over the entire surface (Jun et al., 2019).
Spectroscopy and HSI are approaching techniques that require chemometrics or machine learning methods to quantify the pesticide residue values. Once the equation is established, detecting pesticide residue in the future will become easier. The strategy of integrating computational methods can also be applied to chromatography techniques making the identification and classification of pesticide residues much easier and faster (Chaya et al., 2020).
This work reviews the techniques of detecting pesticide residues in agricultural products using several methods such as; gas-chromatography-mass spectrometry (GC-MS), High-Pressure Liquid Chromatography (HPLC), Ultra Performance Liquid Chromatography (UPLC), Raman spectroscopy, UV-VIS-NIR spectroscopy, and Hyperspectral Imaging System (HSI). Furthermore, this study briefly discusses the application of these methods with chemometrics or machine learning.
Application of chromatography methods for pesticide residues detection of agricultural product
Basic Concept of Chromatography Methods
Chromatography is a separation technique that involves applying a mixture of molecules onto a surface or into the solid/fluid stationary phase (stable phase). The mixture is then separated from each other while moving with the assistance of a mobile phase. The separation is based on the differential distribution of the molecules between the mobile and stationary phases (Hage, 2018). Subtle differences in the partition coefficients of the compounds lead to different retention of the stationary phase and thus affect the separation. According to mobile phase-type, the chromatography method divides into several phases such as gas (GC), liquid (LC), or supercritical (SFC). Whereas the stationary phase may be a liquid or, more usually, a solid (Ismail and Nielsen, 2010). Figure 1 shows the mechanism of chromatograph in general. The selection of chromatography type is typically adjusted to the characteristics of the test sample.
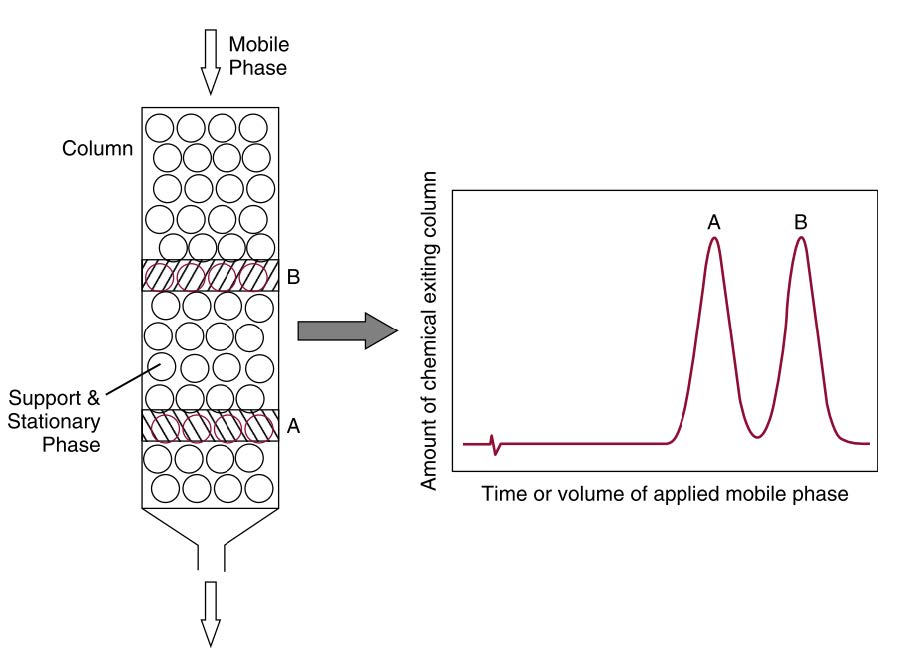
Figure 1. The separation mechanism of a chromatographic system, demonstrated by using a column to separate two chemicals, A and B.
Gas chromatography, commonly known as GC, is a technique that uses gas for the mobile phase and immobilized liquid or solid packed in a closed tube for the stationary phase. The basic principle of GC separation is based on the application of heat and is typically used to separate mixtures containing thermally stable, volatile compounds. These compounds are then separated based on several properties, such as boiling point, molecular size, and polarity (Blumberg, 2021). The GC method was also combined with other methods, such as Mass Spectroscopy (MS), resulting in a new technique called GC-MS. By combining two methods the advantages of each technique can be merged into a single form. The MS system assists the GC system in providing detailed structural information on most compounds (Stauffer, E. 2008). Therefore, the GC method is suitable for pesticide residue detection and gives accurate & precise results at the nanogram to microgram level (Vaye et al., 2022).
Liquid chromatography (LC) is a chromatography technique that uses a liquid for the mobile phase. Separation takes place based on the interactions between the sample and the mobile and stationary phase. Furthermore the performance of the LC method was improved by combining the technique with a high-pressure (HPLC) and upgrading it to ultra-pressure system (UPLC). Instead of using the force of gravity, the HPLC solvent travels under high pressure obtained through a pump to overcome the pressure drop in the packed column. This system helps the HPLC techniques to reduce the time separation. At the same time, the UPLC method increases the system's pressure and allows for smaller particle sizes in the column. Both techniques are used to detect pesticide residues because of the universality of the detection mode.
Application of chromatography methods to detect pesticide residue
The advantage of using chromatography for evaluating pesticide residue, including GC-MS, HPLC, and UPLC are precise and consistent results obtained. This is particularly important given that the threshold for pesticide residues in agricultural products is extremely low. For Instance, Su et al. (2017) investigated chlorpyrifos and imidacloprid residues in Jujube fruit. According to the authors, the GC-MS method identified low residual chlorpyrifos and imidacloprid concentrations of 0.009 and 0.001 mg/g, respectively. In a similar GC-MS study, Walorczyk (2014) assessed multigrade pesticide residues (e.g., azoxystrobin, boscalid, dimoxystrobin, thiacloprid, etc.) in lupine, white mustard, and sorghum. The results exhibited 0.01, 0.05, and 0.5 mg/kg spiking levels. The author added UPLC testing as a method, which signified an average low standard deviation (RSD) of 7%.
Additional examples of pesticide residue detection are presented below; the explained cases indicate that the chromatography methods served as techniques for controlling and monitoring pesticide residue. Chu et al. (2020) investigated 39.32% of strawberries collected in the fields of Anhui Province, China, which contained pesticide residues. The GC-MS, HPLC-MS, and UPLC-MS methods were used, and at least two pesticides were found in 75% of the samples. In addition, many studies have been conducted around the world looking at pesticide residues in fruits and vegetables: such as in Argentina, with 56% of the 65% samples contained pesticides exceeding the Maximum Residue Limit (MRLs) value (Mac Loughlin et al., 2018), in Italy, more than 53% vegetables had pesticide residue (Santarelli et al., 2018), in China in total 66.7% of 78 samples were positive with pesticide residues above the MRL (Yang et al., 2016). Lastly, the conditions for successful control of pesticide residues were demonstrated by Brazil, which was presented by Jardim and Caldas (2012). In their study conducted between 2001 to 2010, involving 13,556 samples, the authors found that only 3% of the samples contained pesticides above the MRL. Pesticide monitoring and control results could be used as a rationale for pesticide regulation in a given region, including the establishment of the maximum limit for each pesticide, field use guidelines, and manuals for removing pesticide residues.
Cleaning contaminated agricultural products remain challenging since not all pesticide residues can be dissolved and removed in this process. In a particular study on Chinese kale conducted in Thailand, 85% of the sample with multiple pesticide residues was washed under running water. Consequently, profenofos residues were successfully reduced through running water treatment by 55%. However, water doesn’t apply to vegetables containing cypermethrin residues. Instead additional washing treatment with vinegar have to be employed (Wanwimolruk et al., 2015). In the tomatoes, handling with water could remove chlorothalonil and thiophanatemethyl to 85%, whereas tomatoes containing oxadixyl only lost 42% pesticide residue, from 0.35 mg/kg to 0.17 mg/kg (Kwon et al., 2015). The washing technique with running water is not effective on all pesticide residues. Although agricultural products can not be free from pesticides, at least the remaining pesticides are still safe if consumed by humans. Additionaly, the washing process requires extra time and incurs additional costs. Whereas if MRLs and pesticide recommendations are followed, the residual value of the pesticides will be partially lowered, which will cut down on the time and expense associated with cleaning up pesticide residues.
Table 1 exhibits pesticide residue analysis using chromatography techniques on various agricultural products. The GC-MS method was more frequently used in pesticide residue assessment than other chromatography techniques as it has greater sensitivity and selectivity due to the long and narrow columns (Yang, 2018). Additionally, the separation process is based on temperature and is suitable for volatile and semi-volatile pesticides. However, some pesticides exhibits low volatility and high polarity, which makes them unsuitable for direct analysis by GC method (Hogendoorn, 2006). Thus, the application of a corresponding liquid chromatograph is highly recommended. Moreover, the combined LC method with triple quadrupole (QqQ) and mass-spectrometry had simultaneously determined more than 50 pesticides (Blasco and Picó, 2007).
Table 1. Pesticide residue levels in agricultural products using chromatography methods.
|
Detection Method |
Class of Pesticide (Number of Pesticides) |
Agricultural Product |
Concentration (mg/kg) |
Ref |
|
GC-QqQ-MS/MS |
Multiclass Pesticide (180) |
Blackcurrant |
0.001 – 2.04 |
(Walorczyk, 2014) |
|
LC-MS/MS |
Multiclass Pesticide (30) |
Various tea leaves (4) |
0.01 – 0.1 |
(Lozano |
|
GC-MS/MS |
Multiclass Pesticide (56) |
|||
|
GC-MS/MS |
Multiclass Pesticide (170) |
Avocado and almond |
0.01 – 0.05 |
(Lozano |
|
GC-MS |
Multiclass Pesticide (19) |
Vegetables (8) |
0.008 – 1 |
(Alamgir Zaman Chowdhury et al., 2013) |
|
GC-MS and |
Multiclass Pesticide (16) |
Fruits and vegetables (12) |
0.02 – 1.32 |
(Jallow et al., 2017) |
|
GC-MS/MS |
Multiclass Pesticide (14) |
Maize |
0.04 – 0.1 |
(Facco et al., 2015) |
|
HPLC |
Ethion and Imidacloprid |
Cucumber |
0.867 – 1.207 |
(Leili et al., 2016) |
|
HPLC-MS/MS |
Multiclass Pesticide (83) |
Vegetables, fruits, herbs, and spices (54) |
0.007 – 3.02 |
(Kowalska |
|
HPLC-DAD |
Multiclass Pesticide (21) |
Cabbage, lettuce, and tomato |
0.002 – 0.317 |
(Diop et al., 2016) |
|
LC-MS/MS |
Multiclass Pesticide (8) |
Oregon cannabis flower |
0.14 – 3.5 |
(Maguire |
|
UPLC-MS/MS |
Multiclass Pesticide (54) |
Crude Pollen |
0.0066 – 4.516 |
(Tong et al., 2016) |
|
UHPLC-MS/MS and GC-MS/MS |
Multiclass Pesticide (80) |
Vegetables (10) |
0.003 – 0.5 |
(Ramadan |
|
UPLC-MS/MS |
Multiclass Pesticide (43) |
Strawberry |
0.002 – 2.5 |
(Wang et al., 2022) |
|
GC-ECD, |
Dithiocarbamates |
Lettuce |
0.002 |
(Pizzutti |
|
GC-FPD |
Organophosphate |
Vegetables and fruits (17) |
0.0003 – 0.1 |
(Polyiem |
|
GC-MS |
Pyrethroid, Organophosphate, and Organochlorine |
Vegetables, fruits, fish, and fish feed |
0.03 – 1.535 |
(Rahman |
|
UHPLC-MS/ |
Multiclass Pesticide (49) |
Hemp and hemp products |
0.0001 – 0.384 |
(Michlig |
Note: LC: Liquid-Chromatography; GC: Gas-Chromatography; MS: Mass-Spectrometry; QqQ: Triple Quadrupole; DAD: Diode Array Detection; UP: Ultra-performance; HP: High-Performance; ECD: Electron Capture Detector; PFPD: Pulsed Flame Photometric; ITD: Ion Trap Detector; FPD: Flame Photometric Detection
Machine learning (ML) has recently been applied in many sectors, including chemistry. While chromatography methods can be coupled with machine learning, there are few works that discusses application of this approach. Machine learning implementation on pesticide residues is still relatively unknown, even though ML can improve the application for detecting unknown samples. The analysis of ML is necessary to extract meaningful biological data recorded by the chromatography method.
Fernández-Albert (2014) outlined a computational chromatography workflow that includes sample preparation, chromatography data acquisition, data processing, statistical analysis, sample identification, and biological interpretation. In chromatography methods, data processing typically involves signal filtering and peak picking, also known as peak detection. This stage is aimed to select the correlated features (sample signal) for ML data input (Zhang et al., 2009). Generally, Retention Time (RT) was used as data input for ML algorithms, besides mass-to-charge (m/z) and intensity data parameters (Zohora et al., 2019) For instance, Zohora et al. (2019) used RT in GC-MS in combination with Convolutional Neural Networks (CNN). The findings demonstrated that using CNN and Support Vector Machine (SVM) could classify breath samples with 100% accuracy for both algorithms. However, due to low specificity, the generated model predictions could not be used to estimate unknown samples during the training stage. Furthermore, the GC-MS method produces high-dimensional data containing noise; one sample can generate over 9 million high-resolution variables (Skarysz et al., 2018). It is required for more intense data pre-processing, reducing data outliers, and preserving essential data.
The qualitative and quantitative algorithms were coupled with the HPLC-Diode-Array Detection (DAD) method to predict phytochemical compounds. The calibration curve was constructed by combining absorbance peak areas from 11 different isoquercitrin concentrations ranging from 0 to 1000 ppm. Then, the ANN, SVM, and Adaptive-neuro Fuzzy Inference System (ANFIS) were employed to generate model predictions. The ANFIS algorithm held the best model prediction with a coefficient determination (R2) of 0.9998 and root-mean-squared error (RMSE) of (0.0002). The generated model was able to estimate the value of the unknown sample given inputs such as the concentration of the standard, composition of the mobile phases, and pH value (Usman et al., 2021).
Chromatography data could be employed in supervised and unsupervised algorithms, such as Principal Component Analysis (PCA), Hierarchical Clustering (HCA), etc. Furthermore, Volatile Organic Compound (VOC), known as “volatilomics”, has been used as a way to determine food fingerprinting as demonstrated by Lytou et al. (2019). These compounds can be evaluated using the GC method as well. The VOCs profile of walnut oils was assessed for the classification between conventional and organic walnut oils. In the result section, if was found that the HCA algorithm successfully grouped conventional farming walnut together with organic farming walnut. At the same time, 72.3% of the data variance could be explained by the PCA algorithm's first two Principal Components (PC). The HCA and PCA algorithms were created using each walnut's RT and the peak areas as the primary data (Kalogiouri et al., 2021). In addition, a research conducted by Barberis et al. (2022) emphasized a new non-invasive method for in-situ sampling of apple cultivars employing GCxGC-MS devices and successfully classified six apple cultivars using the PCA algorithm. The untargeted analysis using GCxGC-MS discovered the pesticide residues contained in the sample. Unfortunately, the author only used the PCA algorithm to classify apple cultivars and did not perform the computational process of the pesticide detection. Table 2 shows the model prediction establishment using machine learning based on chromatography data.
Implementing machine learning in chromatography has improved unknown samples' classification and determination process. There was a promising result for combining both methods (Table 2).However, in order to achieve high accuracy and precise model prediction, it is important to perform the feature selection process correctly and identify the most important variables. Furthermore, this step strongly connects with dimensionality reduction, which removes irrelevant and redundant data, leading to a small error (Khalid et al. 2014). Feature selection can be done automatically or manually.
Table 2. The application of chromatography methods coupled with machine learning.
|
Detection Method |
Matrix |
Algorithm |
Model Evaluation |
Ref |
|
GC-MS |
Metabolomics monitoring through human breath diagnostics (Medicine field) |
ChromAlignNet (Deep Learning) |
Accuracy ~ 1 and 0.85 (for simple data sets and very complex data sets, respectively) |
(Li and Wang, 2019) |
|
GC-MS |
Trimethylsilyl Derivatives of Metabolites (Medicine field) |
SVM, ANN, DNN, CNN, and RF |
Accuracy of SVM: 86.7% and error ± 3%. (Unstable model prediction due to true positive classification only shows at ± 30%) |
(de Cripan |
|
GC-MS |
Essential Oils (Natural Sciences) |
RF |
Predictability Accuracy: 98% and OOBE: 2.28 ± 1.44% |
(Lebanov |
|
HPLC |
Oligonucleotides |
SVR and LM |
Accuracy of SVR: 0.999 and RMSE 0.076 |
(Enmark |
|
LC |
Chromatography Conditions for Purification in Organic Synthesis |
FFNN, CNN, and LSTM |
Accuracy of LSTM: 0.950 ± 0.001 (For one solvent) and 0.982 ± 0.001 |
(Vaškevičius et al., 2021) |
A Convolutional Neural Network (CNN) was used to find precise peak detection (feature selection). The CNN algorithm divided the LC-MS data into three classes: class 1 – noise, class 2 – one or more peaks, and class 3 – uncertain peak. In Figure 2, class 2 was picked as the data representative and played a role as data input for ML. Class 1was considered as irrelevant data with the sample, lowering the quality of the prediction model. Meanwhile, signals of class 3 were too noisy, tiny, or odd to be assigned to a peak. This group contained a peak but required particular attention from an expert (Melnikov et al. 2020).
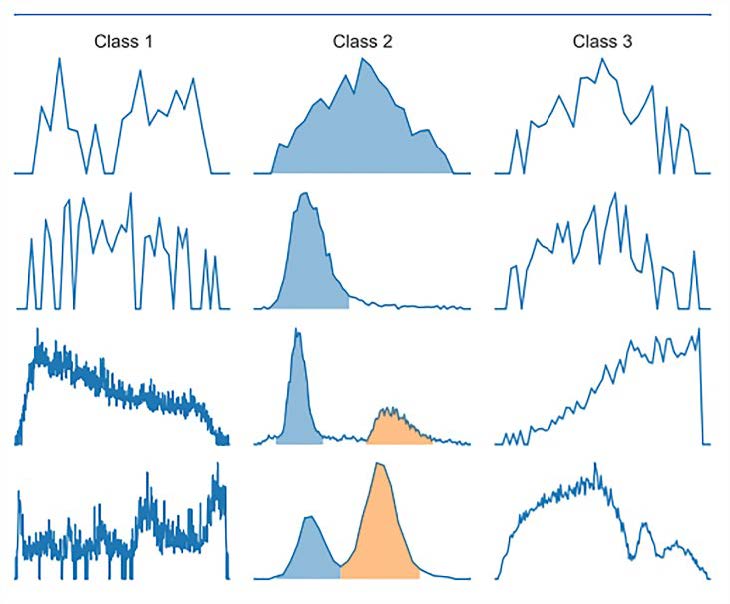
Figure 2. ROI examples from each Class 1 ROIs are classed as noise; Class 2 ROIs are classified as one or more peaks, and Class 3 ROIs are defined as uncertain peaks. The blue and orange fill reflect the highest integration areas.
Besides the benefit of chromatography methods, these methods have disadvantages. One of the apparent downsides is the amount of data generated, which causes a problem in handling the data. Excessive data elevates the predictive model's complexity, lowering its performance and perhaps resulting in overfitted or under-fitted predictions; furthermore, not all data obtained is relevant to the samples. Thus, ML or a chemometric approach is vital to interpret the data and categorizing each sample's fingerprint (Deconinck et al. 2013). Moreover, these methods are multistage sample preparation, which complicates the detection procedures, especially for common people, and negatively impacts the environment by leaving a large carbon footprint. It is noteworthy that the initial investment cost is high—between $15,000 and $22,000—and that ongoing maintenance expenses will be costly. (Jornet-Martínez et al. 2017). These drawbacks make the chromatography unsuitable for modern rapid assessment, which needs real-time monitoring. In addition, small-holder might have a hard time accessing these methods.
Application of Raman spectroscopy for pesticide residues detection of agricultural product
Basic concept of Raman spectroscopy
Raman spectroscopy measures the relative frequency at which a sample scatters radiation. During the illumination time, the light will stimulate molecules in a tissue; some light might be reflected, absorbed, or scattered, and a small portion of the light will be emitted at a different wavelength by the molecules (Synetos and Tousoulis, 2017). This technique slightly differs from other spectroscopy methods, which utilize an actual frequency incident on the radiation light. Only a small amount of Raman scattering is contained in one incident light; most light constitutes Rayleigh scattering. The portion of Raman scattering radiation is approximately 1x10⁻⁷ of the scattered light (Bumbrah and Sharma, 2016).
The scattered light of inelastic (Raman scattering) has a different frequency, either lower or higher, from the incident radiation (hv0). A lower frequency of scattered radiation is called Stokes lines (hv0 – hv) because the scattered radiation has lost its initial energy equal to the molecular vibrations. While a higher frequency, known as anti-Stokes lines (hv0 + hv), has obtained energy equivalent to molecular vibrations (the energy difference between vibrational modes is denoted by hv) as shown in Figure 3 (John and George, 2017)(Shipp et al., 2017).
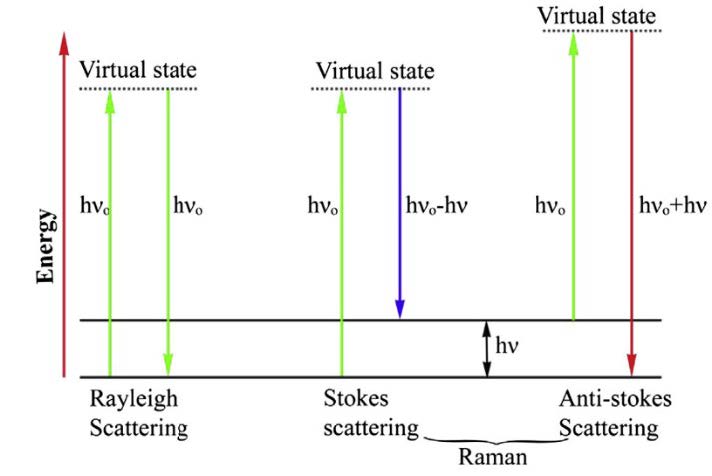
Figure 3. Rayleigh and Raman scattering.
Raman spectrophotometers are categorized as either dispersive or non-dispersive. The components and measurement paths for both Raman spectroscopy are shown in Figure 4 (Yang and Ying, 2011). An interferometer is used in non-dispersive Raman spectrophotometers, but a prism or grating is employed in dispersive Raman spectrophotometers (Bumbrah and Sharma, 2016). Significant Raman scattering can be acquired using the laser in the visible region. But simultaneously, a fluorescence signal also created in this area can interfere with the Raman signal measurement. Besides that, dispersive Raman spectroscopy is a great technique for aqueous-phase sample detection. While acquiring high-resolution spectra is still hard (Zhang et al., 2021).
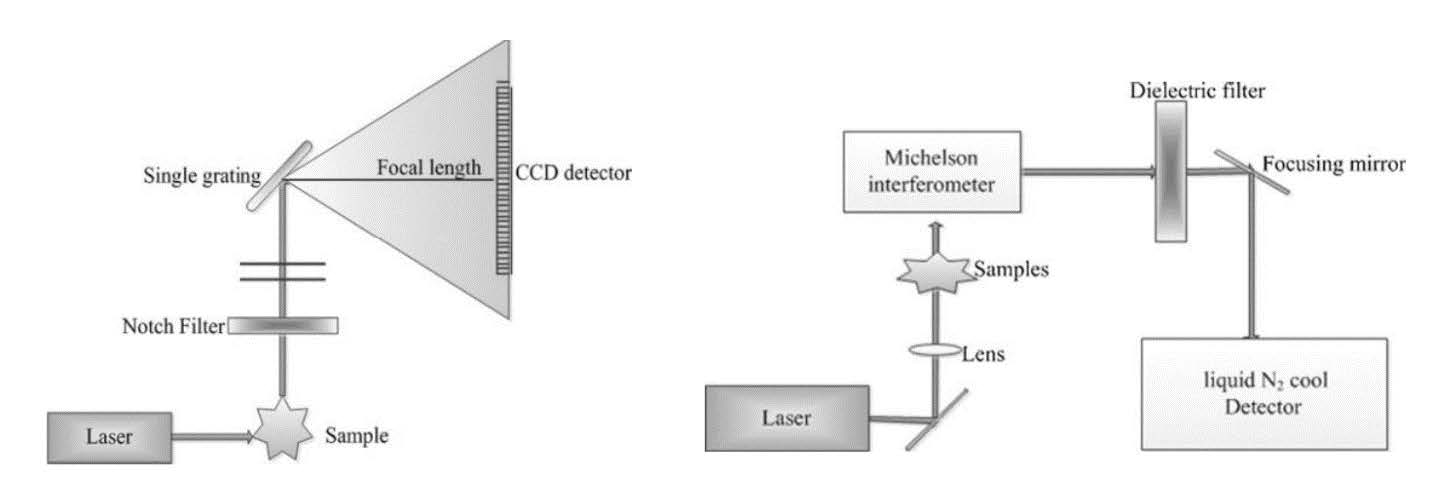
Figure 4. Schematic diagram of a) dispersive and b) Fourier transform Raman spectrophotometer.
The Fourier Transform (FT)-Raman spectrophotometer employs a Michelson interferometer. This technique is one of the non-dispersive methods using an Nd:YAG laser (1064 nm) combined with either an InGaAs or liquid nitrogen–cooled Ge detector. This technique aims to quench Rayleigh and fluorescence signals and give a stable wavelength measurement. In addition, the operation of this method is more manageable, and the result shows a high spectral resolution with great wavelength accuracy (Yang and Ying, 2011). At the same time, the FT-Raman method is limited to testing at temperatures below > 2,500C, aqueous phase samples, and black samples since these compounds will mask the Raman signal (Kizil and Irudayaraj, 2018).
Raman spectroscopy utilizes various detectors, including the charge transfer device (CTD), charge-injection device (CID), and charge-coupled device (CCD). However, the CCD detector is typically preferred as the capturing device for its advantageous features, such as low dark current and high sensitivity to Raman signals. These properties make it well-suited for detecting faint Raman signals and minimizing noise factors (Bumbrah and Sharma, 2016) (Shipp et al., 2017).
Due to the low portion of Raman scattering, it is necessary to find a suitable wavelength; thus, a generated signal contains no discernible photoluminescence. As a result, the obtained Raman signal has no background and a remarkable signal-to-noise ratio. Three wavelengths provide minimal fluorescence whilst maintaining a comparatively high Raman intensity, such as 532, 785, and 1,064 nm (Hara et al., 2018) (Tuschel, 2016). In order to get a specific wavelength, a laser is used as a light source in current Raman spectroscopy. Due to their highly monochromatic nature and high beam flux, lasers are a source of photons, and this light source is essential because the Raman effect is weak. The Stokes line is typically 1000 times weaker than the Rayleigh scattering component (Mohammed, 2011). The development of Raman spectroscopy continues to be carried out to overcome the weak signal, so it is easier to detect, such as Surface-enhanced Raman-spectroscopy (SERS), Coherent anti-Stokes Raman spectroscopy (CARS), and Tip-Enhanced Raman Spectroscopy (TERS)) (John and George, 2017).
SERS is a vibrational spectroscopy approach in which the sample is adsorbed on a colloidal metallic surface (silver, gold, or copper) to increase the strength of Raman signals (Bumbrah and Sharma, 2016). Thus, the SERS approach has excellent sensitivity for detecting pesticide residues and has become a rapid alternative method for evaluating pesticide contamination (Xu et al., 2017).
Application of Raman spectroscopy to Detect Pesticide Residue
Applications of Raman spectroscopy are far-reaching in nanomaterials, covering the biological, chemical, and medical fields (John and George, 2017). Furthermore, Raman spectroscopy has been applied in agriculture, such as on fruits, vegetables, crops, meat, dairy, oil, and beverages, to detect alteration, adulteration, biochemical information, etc. (Yang and Ying, 2011). Additionally, Raman spectroscopy is an appropriate method for safety control, notably in identifying pesticide residues.
Implementing one of the Raman spectroscopy kinds, known as dispersive Raman spectroscopy, without any enhancement for pesticide residue detection is challenging due to the weak naturally generated Raman signal. Thus, only a few works discuss its performance. Dhakal et al. (2014) proposed an innovative dispersive Raman spectrometer for pesticide residue detection on apple surfaces. The proposed design included a 785 nm laser excitation source, a CCD camera, and a rotational analysis of the entire sample surface. The result exhibited 6.69 mg/kg pesticide residue on the apple surface within less than 4 s. Although this method has great potential, pesticide residue detection below 1 mg/kg still requires further development.
Based on the findings of Dhakal et al. (2014), it could be concluded that identifying pesticide residues using dispersive Raman spectroscopy is ineffective for low-concentration detecting molecules, making it challenging to identify pesticide residue fingerprints. However, the necessity to detect pesticide residues in fruits and vegetables is generally at low concentrations. Therefore, improving the dispersive Raman spectroscopy technique's sensitivity and specificity is necessary. It has been shown that using a specific laser in conjunction with this technique reduces the impact of fluorescence while revealing the presence of pesticide residues. (Ranjan et al., 2014) (Bumbrah and Sharma, 2016).
An approach using another basic Raman method, i.e., FT-Raman, can detect pesticide residues at low concentrations due to reduced laser-induced fluorescence. In research about pesticide residue detection over fruit and vegetable surfaces, it was declared that utilizing the FT-Raman method could identify pesticide residues on the sample surfaces. However, a specific light source with 1064 nm excitation must be deployed to suppress the fluorescence effect (Zhang et al., 2006). In another instance, a novel FT-Raman technique was developed as a quantitative measurement for Fenthion in an emulsifiable concentrate sample. The calibration curves were constructed using a Fenthion standard solution in xylene on the band areas of 2951, 1065, 661, and 604 cm-1. The result showed a Limit of Detection (LODs) and RSD at 0.14 – 0.36 M and 0.4 – 6.8%, respectively. While wavelength 802 cm-1 was used to normalize the data to compensate for excitation energy fluctuations Armenta et al. (2005). as cited in Armenta et al., (2005)).
According to Armenta et al., (2005), FT-Raman spectroscopy is undoubtedly an alternative to chromatographic detection methods. At the same time, low sensitivity and high LODs limits are problematic for detecting low pesticide residue concentrations. In line with the previous statement, apart from the poor sensitivity of the FT-Raman method, certain pesticides do not provide good Raman scattering or even do not have a Raman spectrum in all cases (Boyaci et al., 2015).
Therefore, the SERS method has been employed to enhance the weak Raman signal. So, Raman spectroscopy becomes more sensitive for pesticide residues from low to high concentrations. The pesticide residue identification using SERS enhancement coupled with dispersive Raman spectroscopy demonstrated a low LODs value on average of 5.33 x 10⁻⁴ µM. Gold nanorods (Au NRs) were deployed to strengthen the Raman signal on thiram and thiabendazole residue on fruit surfaces (Hu et al., 2020). In another instance, D. Zhang et al. (2019) investigated pesticide residue on tea leaves and discovered the LODs of typical chlorpyrifos solutions at 10-10 M, resulting in great sensitivity. Meanwhile, the amount of pesticide residue found ranged from 1 x 10⁻⁴ to 0.287 mg/kg.
The interaction between adsorbed molecules and the surface of nanoparticles is critical to the effectiveness of the SERS method, which results in a low LOD. Furthermore, the most exploited nanoparticles in the SERS technique are gold (Au), silver (Ag), and copper (Cu). More than that, the physical properties of different substrates, such as sizes, shapes, and components, will have varying effects on the increment in Raman intensity. These differences in physical properties can largely affect "hot spots” on the substrate. The hot spots are discovered in the interstitial spaces between metal nanoparticles and can produce significant local field amplification due to local surface plasmon resonance (LSPR). The hot spots are surface plasmons that are highly localized and caused by sharp protrusions (e.g., rods, stars) (Yuan et al., 2012; Pang et al., 2016; Xu et al., 2017).
Jiao et al. (2019) designed a pure worm-like AuAg substrate to improve the SERS signal detection of apple pesticide residues. This substrate could help the SERS method lower its detection limit on thiram up to 0.03 ppm. Worm-like AuAg nanochain interconnected ultrafine on ~6.2 nm. In another substrate shape, Sivashanmugan et al. (2017) deployed nanoplasmonic Au/Ag/Au in the nanorod shape to detect some pesticides, such as cypermethrin, carbaryl, permethrin, and phosmet. The result showed a detection limit of 0.0035 (10-8 M). The obtained LOD of nanorod shape presented a much lower pesticide detection than a pure worm-like substrate, owing to the nanorod substrate having many angles, which could provide more “hot spots”. However, comparing performance between different substrates is difficult since numerous SERS substrates are created, and no standardised procedure exists.
In order to detect chlorpyrifos (CPF) in soil, He et al. (2019) researched substrate size's effect on Raman signals. They utilized five different sizes of gold nanoparticles (Au NPs), including 11, 13, 14, 25, and 42 nm. The study found that deploying 42 nm Au NPs produced a noteworthy Raman signal due to the intense electric field force among the materials. It provided a limit of detection (LOD) of 0.025 mg/kg.
Au and Ag are the preferred substrates because of their benefits, such as low cost, simple preparation, and favourable enhancement than other materials (Xu et al., 2017), and are the most frequently used materials for detecting pesticides. Table 3 summarizes the application of the SERS method for pesticide residue detection in agricultural products. The SERS technique demonstrated its ability to reveal pesticide residue either inside or on the surface of the fruit (Figure 5).
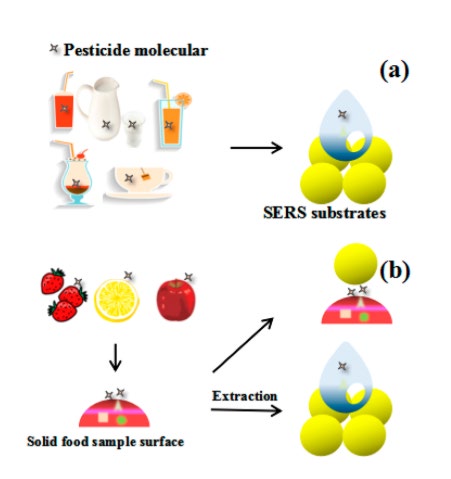
Figure 5. SERS Method in Pesticide Residues Detection (a) in liquid and (b) on the surface.
Table 3. Pesticide residue detection using SERS method in agricultural products.
|
Agricultural Product |
Class of Pesticide |
Substrate |
LOD |
Ref |
|||
|
Apple surface |
Omethoate and chlorpyrifos |
AuNPs |
1.63 and 2.64 µg cm-2 |
(Chen et al., 2018) |
|||
|
Peach |
Thiacloprid, prefonofos, and oxamyl |
Au@Ag NPs |
0.01, 0.1, and |
(Yaseen et al., 2019) |
|||
|
Orange and apple |
Methyl parathion |
AuNR |
1 µM (0.3 ppm) |
(Wu et al., 2019) |
|||
|
Apple and tomato |
Carbaryl, phosmet, and azinphos-methyl |
Au |
4.51, 6.51, and |
(Liu et al., 2013) |
|||
|
Apple |
Thiram |
AuNS |
10-10 M (0.000035 ppm) |
(Jian Zhu |
|||
|
Fruits and vegetables (5) |
Parathion-methyl, triazophos, and phosmet. |
Snowflake-like AuNP |
0.026 ng/cm2, |
(Huang et al., 2020) |
|||
|
Apple peel |
Acephate, cypermethrin, and tsumacide. |
Au/DW |
10-3 ng/cm2, |
(Wang et al., 2018) |
|||
|
Adzuki Bean |
Paraquat |
AgNPs |
0.8 µg/kg |
(Tsen et al., 2019) |
|||
|
Grape |
Difenoconazole |
Au@AgNPs |
48 µg/kg |
(Wang et al., 2019) |
|||
Note: AuNP: Gold Nanoparticles; Au@Ag: silver-coated gold; NR: Nanorod; NS: Nanostar; DW: Dragonfly wing.
Numerous studies have addressed improving the Raman signal using a variety of substrates and have successfully discovered pesticide residues below the MRL value. However, the reproducibility of results using the SERS method became its limitation, which referred to the SERS signal for each measurement (Yang et al., 2021). Pang et al. (2016) speculated that another reason for the low reproducibility came from the different Raman instrument systems, causing a variety of configurations.
SERS has a lot of potential as a field detection method. Because of technological advances, the signal detector may now be miniaturized to the size of a hand, making this method more viable for field detection; the device is called a portable Raman spectrometer. However, most of the device was built by a company, and only a few works developed low-cost devices. A work conducted an experiment regarding hand-held and bench-top Raman spectrophotometers. Pesticide residues on basmati rice on-site, such as acephate, carbendazim, thiamethoxam, and tricyclazole, were assessed using a Raman spectrometer device. Due to environmental conditions, the results of the Raman signal intensity between bench-top and hand-held Raman spectrometers were quite different. Lab-scale Raman spectrometer had better accuracy, as indicated by the Raman intensity value, which only reacted to the characteristics of pesticides. Despite the noise signal, the hand-held Raman spectrometer could still provide a fingerprint of every pesticide. In terms of results, the detection limit of the hand-held Raman spectrometer was 0.61 ppb, higher than the lab method's 0.34 ppb. Even so, the LOD of the Raman hand-held spectrometer was still acceptable because it was far below the Basmati Rice MRL value of 10 ppb (Logan et al., 2022).
More than that, a Raman spectrometer device was developed based on a smartphone. A smartphone-based Raman spectrometer was built with an easy user interface (UI). It could also be removed from the smartphone application list, which meant the Raman measurement did not disturb the normal function of the smartphone. The proposed method was combined with paper-based SERS chips and a 785 nm laser to obtain a notable intensity of Raman scattering. As a result, the device successfully detected crystal violet at concentrations of 10-2 M, 10-3 M, and 10-4 M. Unfortunately, the evaluation did not include a discussion of economic issues (Zeng et al., 2019).
The SERS technique requires the user to prepare the substrate to be applied, which adds to the method's complexity for field measurements. The less preparation performed on the sample, the easier the measurement; accordingly, a technique is needed to shorten the substrate's fabrication time. Kumar et al. (2017) designed an in situ measuring substrate based on AgNR coated with polydimethylsiloxane (PDMS). During the field measurements, the proposed substrate would be attached to the apple so that the portable Raman spectrometer could be operated immediately. The Raman intensity of AgNR embedded in PDMS was similar to that of the AgNR substrate.
Pan et al. (2021) carried out research to develop an in-situ surface-enhanced Raman spectroscopy (SERS) method to detect pesticides (acetamiprid) directly, without the need for extraction. Pesticide residues on cabbage leaves had been effectively identified using silver-coated gold nanoparticles (Au@AgNPs) as a substrate, either through extraction or directly on the cabbage leaf. The detection limit values in the extracted and cabbage leaf samples were 0.08 g/mL and 0.14 mg/kg, respectively. Therefore, the RSD value was 4.37 - 10.63%. The ease of sample pre-treatment was one of the critical benefits of the proposed method, which had tremendous potential for on-site and non-destructive detection.
The SERS technique can identify various pesticide residues in agricultural products in certain cases. However, with a note, the detection object must be treated first. Identifying Chlorpyrifos (CPF) and 2, 4-Dichlorophenoxyacetic acid (2, 4-D) in apple peels produced positive findings, indicating that Raman intensity could display features at the relevant wavelength (Wang et al., 2022). The complex matrix remains unexplored despite much research on detecting mixed pesticide residues. According to Pang et al. (2016), it needs a lot of direct testing on field items since other unknown analytes easily disrupt Raman intensity.
Nowadays, Raman data is combined with machine learning, such as chemometrics, ANN, and deep learning. Due to its selectivity for complex objects, ML might help the Raman spectrometer to distinguish each pesticide residue. Identifying pesticide residue with ML aid can be done in two ways; qualitative (classification) and quantitative (which reaches the detail value).
Weng et al. (2019) established pesticide residue quantitative (PLSR (partial least square regression), SVM, and RF) and qualitative (SVM, K-nearest neighbors (KNN), and Naïve Bayesian (NB) and RF) model predictions on paddy irrigation water. Paddy water was treated with fonofos, phosmet, and sulfoxaflor pesticides in this case. The measurement was done using a portable Raman spectrometer and AuNRs as SERS’s substrate. As a result, the KKN algorithm was the most robust classification model with 100% accuracy in both the calibration and validation sets. Table 4 shows the quantitative result.
However, Raman spectroscopy contains numerous spectra data, which need pre-processing steps to reduce uncorrelated information, especially for the portable Raman spectrometer. Zhu et al. (2018) tried detecting chlorpyrifos residues in tea using SERS method combined with chemometric models. Quantitative (table 4) and qualitative (PCA, BPANN, and KNN) were applied in this project pairing with three pre-processing methods: SNV, 1st derivative, and 2nd derivative. The KNN algorithm with the 2nd derivative pre-processing method, with an accuracy of 100%, was the most consistent classification model. In the comparison, the KNN with both SNV and 1st derivative method only reached 99.12% of accuracy.
To the best of the authors' knowledge, no study has been done to measure the solution of multigrade pesticides mixed such that ML can categorize based on each pesticide's fingerprint. Pesticides are commonly used in more than one type in the field. Uninformed prediction algorithms will struggle to differentiate each residue.
Simple linear regression was employed as a straightforward approach to estimate (quantitative) pesticide residue on fruit quickly. For instance, applying SERS to discover Omethoate residue in peaches generated R2 values of 0.98289 and 0.98 as assessment values based on standard solution and peach extract, respectively, using simple linear regression (Yaseen et al., 2018). However, the SERS method provides a vast number of spectra data, which sometimes needs data reduction to omit unrelated data without losing the original data essence. Furthermore, since simple linear regression is limited to a specified wavelength, incorporating matrices with complicated fingerprints leaves the prediction model quite prone to noise and overfitting. Hence, chemometric and ML are more suitable for model establishment on the SERS method.
Table 4. The application of raman spectroscopy methods coupled to detect pesticide residue with machine learning.
|
Detection Method |
Agricultural Product |
Algorithm |
Model Evaluation |
Ref |
|||
|
SERS |
Apple and tomato |
PLS |
R = 0.94 and 0.91 Error = 1.41 and 0.83 |
(Liu et al., 2013) |
|
||
|
SERS |
Paddy Water |
PLSR, SVM, and RF |
R2c = 0.99952 RMSEC = 0.27 |
(Weng et al., 2019b) |
|
||
|
SERS |
Tea |
PLS, GA-PLS, siPLS, and siPLS-GA |
R2c = 0.97 RMSEC = 0.25 |
(Jiaji Zhu et al., 2018) |
|
||
|
SERS |
Tea |
PLS and SVM |
R2 = 0.97 and 0.98 RMSECV = 2.34 and 1.35 |
(Zhu et al., 2021) |
|
||
|
SERS |
Rape Plants Leaf |
PLS |
R2c = 0.96 RMSEC = 2.65 |
(Lin et al., 2018) |
|
||
|
SERS |
Rice |
PLS |
Rc = 0.9868 RMSEC = 1.26 |
(Huang et al., 2015) |
|
||
|
SERS |
Wheat |
PLS |
R2c = 0.9885 RMSEC = 1.02 |
(Aheto et al., 2022) |
|
||
|
SERS |
Peach |
PLSR and RFR |
R2c = 0.8622 and 0.9003 RMSEC = 0.1193 and 0.1015 |
(Du et al., 2020) |
|
||
|
SERS |
Wheat |
PLSR, SVR, and RF |
RMSECP = 0.00735 Recovery = 94.12 – 106.63% |
(Weng et al., 2019a) |
|
||
|
SERS |
- |
CNN |
R2 = 0.999 |
(Zhang et al., 2022) |
|
||
|
SERS |
- |
SVM, KNN, DT, and AdaBoost |
Accuracy = 92.46% |
(Sahin et al., 2022) |
|
||
SERS: Surface-enhanced Raman spectroscopy; PLSR: partial least square regression; SVM: Support vector machine; RFR: Random Forest regression; GA: Genetic algorithm; si: Synergy interval; KNN: K-nearest neighbors; DT: Decision tress; AdaBoost: Adaptive boosting.
Commonly, both the chemometric and ML algorithms are integrated with the pre-processing method. One of the PLS abilities is to reduce data dimensionality, which can be applied to spectral data information. Huang et al. (2016) exhibited the use of PLS as the main algorithm and cooperated with three pre-processing data algorithms: multiple scattering corrections (MSC), standard normal variate (SNV), and normalization. The prediction model based on the original spectrum had the lowest R2 value in this study, with a value of 0.9766.
Meanwhile, applying the pre-processing algorithm increased the evaluation value to 0.9874 and 0.679 for R2c and RMSEC, respectively. In addition, the results of the prediction model with other pre-processing methods also gave excellent results, with R2 values of 0.9848 and 0.9867 for SNV and normalization, respectively. More than that, the estimation value of phosalone extracted from pakchoi showed an excellent recovery percentage, with a range of 94.68 – 102.82%. This number indicated that the prediction model had reached the stage where it could accurately predict the value of phosalone with a low risk of underfitting or overfitting. Despite human and instrument errors, pre-processing is essential.
Noteworthy, adequate data must be used to build prediction models in order to properly feed the prediction model created. In one case, the authors used a dataset of 14 samples to identify the presence of chlorpyrifos in pears, with R2 values of 0.8622 for PLS and 0.9003 for RFR (Random Forest Regression) (Du et al., 2020). It should be emphasized that the dataset employed in the prediction model must be of high quality so that the prediction model does not overfit or underfit.
Application of ultraviolet (UV), visible (VIS) to near-infrared (NIR) spectroscopy for pesticide residues detection of agricultural products
Basic concept of UV-VIS-NIR spectroscopy
UV, VIS, and Infrared (IR) spectroscopy have been widely employed as a non-invasive technique to reveal bio-information about agricultural objects. Thus, the user, in this case, farmers, can adjust the treatment to improve the quality of the matrix. Compared to the Raman and fluorescence methods, the UV, VIS, and IR methods are more straightforward since the three radiations have the most considerable portion in one incident light wave. Consequently, there will be fewer data interference, and measurements may be taken directly without further preparation of the objects or substrates.
There is a law concerning the fall of light in the aforementioned chapter. Most practical applications in the field rely on light transmittance or reflection. While the laboratory scale usually appoints absorbance mode. Field measurements typically include solid objects and are ideal candidates for data gathering with the reflection mode. The term "spectral reflectance" refers to the ratio of energy incident on a surface to energy reflected by it, measured as a function of wavelength. However, several factors affect reflectance value results, such as object surface roughness and texture, particle size and distribution, etc. (Picollo et al., 2019).
The visible region is responsible for pigment compounds, such as anthocyanins, chlorophylls, carotenoids, etc., (Makky and Soni, 2014). Hence, detecting pesticide residues at this wavelength is tricky because most pesticide residues on fruits and vegetables are colorless. Additionally, because most pesticides have double bonds in their chemical composition, moving the atoms demands a significant amount of energy. Thus, the UV spectrum will be more appropriate due to its high energy (A. De Caro, 2015). For example, organic acids and benzoic acids, one of the structural compounds in pesticides, have been detected at wavelength ranges of 235 nm to 335 nm (Yu et al., 2018). Additionally, pesticide residues might also be discovered at wavelengths close to the UV, around 400 - 450 nm (Jamshidi et al., 2016).
The foundation of UV-VIS spectroscopy is the molecules' outer valence electron transition, which produces an absorption spectrum of 200–780 nm. At the same time, IR can be divided into three sub-regions; Near-Infrared (NIR) of 780 – 2,500 nm, Mid-Infrared (MIR) of 2,500 – 25,000 nm, and Far-Infrared (FIR) of 2.5 µm – 1 mm. NIR absorption is linked to molecular vibration and oscillation of oxygen-hydrogen (O-H), carbon-hydrogen (C-H), carbon-oxygen (C-O), nitrogen-hydrogen (N-H), and sulfur-hydrogen (S-H), particularly overtones and combinations of fundamental vibrations (Yu et al., 2018).
A spectrometer usually consists of a light source (i.e., xenon, tungsten, or deuterium), a sample holder, a dispersion element, and a detector (i.e., photodiode array (PDA) or CCD) (A. De Caro, 2015). The placement of each component depends on the needs. Figure 6 shows a typical bench-top UV-VIS spectrometer diagram. In the portable version, the sample is placed at the end of the sequence diagram, and the light source and detector are oriented in the same direction using an optical fiber (reflectance mode). The dispersion element is placed close to the sensor in a portable spectrometer. Notably, stray light situations, which generate noise in the data, frequently impede the usage of portable spectrometers. As a result, this equipment is commonly used in conjunction with a probe to limit natural light interference.
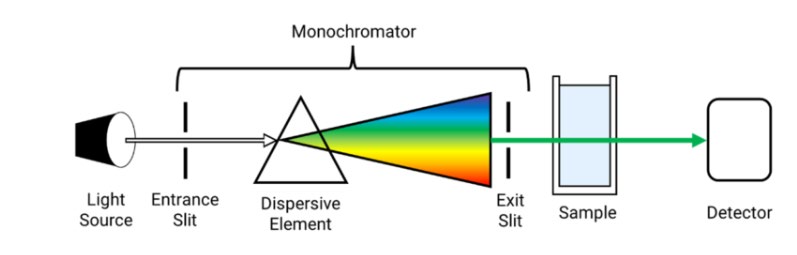
Figure 6. UV-Visible spectrometer diagram.
The components of the NIR method are nearly identical to those of the UV-VIS spectrometer method. However, a Fourier Transform (FT) technique for the NIR spectrometer exists. The FT-NIR type is a technology that employs an interferometer to generate modulated light. Interferometry is a technology that extracts information from the interference of superimposed waves (Nicolaï et al., 2007). Furthermore, FT-NIR is utilized to solve the issues associated with conventional NIR. The benefits of FT-NIR include very high resolution, rapid and precise frequency determinations, simultaneous detection of all wavelengths concurrently, and higher signal-to-noise ratios. In addition, several kinds of NIR spectrometers are based on their monochromators, including scanning monochromators, PDA spectrometers, laser-based systems, and liquid crystal tubal filters (LCTF) (Kusumaningrum et al., 2017).
Application of UV-VIS-NIR spectroscopy to detect pesticide residue
The UV-VIS-NIR spectroscopy methods, as is well known, can be used to determine the internal condition of an object, and they are not limited to agricultural objects. The information acquired from the object will benefit personal and industrial purposes. Those wavelengths' third applications include freshness, plant health, fruit maturity level, quality, etc. (Theanjumpol et al., 2013; Makky and Soni, 2014; Husted, 2015; Hemrattrakun et al., 2021). Furthermore, the benefits of all three methods extend to the post-harvest stage, such as detecting defects, pesticide residues, and quality control during shelf life (Theanjumpol et al., 2014; Riza et al., 2017; Li et al., 2021; Riza et al., 2022). The performance of these three methods—bench-top or portable—for detecting pesticide residues in agricultural products was discussed in this paper, along with a brief discussion of their benefits and drawbacks.
There were very few records of the detection of pesticide residues using the UV-VIS laboratory-scale approach. It is quite tricky to obtain pesticide fingerprints inside the visible area. Sahu et al. (2020) investigated the ability of a UV-Visible spectrometer and FTIR to detect the flonicamide insecticide in vegetables. The results of spectral acquisition exhibited that the highest absorbance occurs at a wavelength of 580 nm and a LOD value of 0.007 µg/mL. Even though the results showed a LOD value that could touch the trace level, the obtained wavelength value from the insecticide came from complex processes that took quite a long time. Thus, implementing the bench-top UV-VIS is not in accordance with the interests of the field, which requires speed in the process. In order to carry out the detection procedure quickly and correctly, intact samples are also needed to identify pesticide residues on agricultural products.
In addition to the utilizing of visible spectrum, relatively few UV applications can still be observed. Using a bench-top UV spectrometer, Omer and Fakhre (2019) attempted to find pyriproxyfen and chlorothalonil residues in cucumber and cabbage. Based on the findings, this instrument could measure pesticide residues up to 0.131 mg/kg. The fact that the UV method might find pesticide residues below the MRL threshold indicated its sensitivity, according to the result. However, since the sample had to be produced in liquid form (destructive) and necessitated several chemical solutions, thus, a lot of preparation was required in this study to detect a single sample. In another instance, the detection was carried out for pesticide residue (imidacloprid) in apple juice, orange juice, and peach juice. Although the detection limit was not specified in this study, it was possible to deduce that the UV spectrum could detect standard solutions at a concentration of 0.036 mg/mL and identify pesticide residue absorbance fingerprints at each concentration (0 to 10.29 mg/ML)(Ji et al., 2013). However, because of its great size, the UV device can not be carried freely, making it unsuitable for direct detection in the field.
Satisfactory findings were obtained in an experiment to detect and measure the residual fungicide on lettuce intact using a hand-held spectrometer based on UV-VIS, according to Steidle Neto et al. (2020). The UV-VIS technique had a detection limit of 0.49 mg/kg and a quantification (LOQ) limit of 1.41 mg/kg. This result indicated that the portable UV-VIS spectrometer could detect pesticide residues on the object below the MRL threshold (non-destructively).
Likewise, Ngo et al. (2022) developed a novel hand-held spectrometer by integrating an NSP32m-W1 nanolambda detector into a 3D design (Figure 7). This tool used the reflectance approach, covering the 380–840 nm wavelength range. Then the calibration data comprised 68 pesticide data, 54 fungicide data, and 50 plant growth hormone data (evaluation parameters in Table 5). This cutting-edge hand-held spectrometer had a detection limit of 0.01 mg/kg for pesticide residues in bok choy, oriental mustard, and lettuce. Although the production cost of the device was not evaluated in this study, a rough calculation might be used to estimate that there were cost savings of 80%. The portable device’s operation was susceptible to influence from stray. Thus, a probe's help was necessary to lessen the interference.
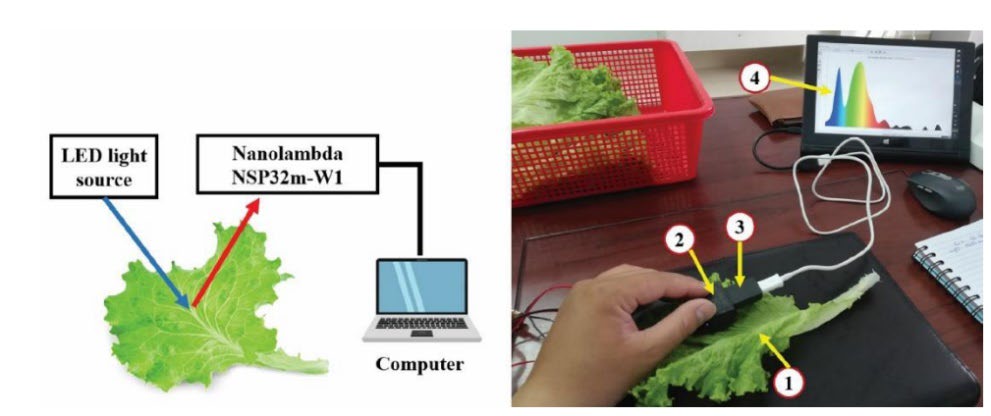
Figure 7. Schematic diagram of a novel portable UV-Vis spectrometer (1) lettuce leaf sample; (2) spectrometer holder; (3) spectrometer; (4) computer.
At the same time, results from bench-top NIR reflectance spectroscopy used to evaluate the presence of pesticide residues in pepper were likewise satisfactory. In contrast to the UV-VIS method, the laboratory version of the NIR method is a non-destructive technique that may measure materials without undergoing any preparation, saving time and enabling the testing of a greater variety of samples (Sánchez et al., 2010). Despite being a quick procedure, the initial calibration of the NIR spectroscopy technique using a sample of known composition took a lot of time and resources (Yeong et al., 2019). As a result, the bench-top or portable NIR approach was paired with the use of computing to determine pesticide residue value.
A silicon diode array makes the NIR method not require an InGaAs array, making it possible to miniaturize this method. The Field Spec 4 spectrometer is one of the portable NIR instruments (manufactured). Because of its compact size and ability to display accurate spectra readings, this device may be used to collect data immediately in the field. According to Dai et al. (2010) and Misal and Deshmukh (2016), the NIR portable device categorization value reached 93%. Despite the fact that silicon diode arrays are less expensive than InGaAs detectors, this sensor is well-known for its optimal wavelength operating below 1000 nm (Yeong et al., 2019).
Furthermore, changes in temperature and humidity will have a significant impact on the results of the scans. These two elements may impact the NIR lab scale less, but using portable NIRs in the field will always get around this (Nicolaï et al., 2007). Aside from produced devices, developing equipment based on digital cameras that span the NIR-Red spectrum to detect pesticide residues on agricultural items was highly viable (Widjaja Putra and Soni, 2017). Hence, smallholders like farmers could trace pesticide residue on their farms. However, the proposed device based on a digital camera must still be assessed further for pesticide residue detection.
Several gadgets combined visible and infrared spectrums to detect pesticide residues on fruits and vegetables—for example, diazinon residue detection in cucumber. The spectrometer findings revealed that the most significant energy absorption area was between 450 and 470 nm and between 950 and 1,000 nm. The proposed system predicted diazinon at 8.39 mg/kg, which was 1.03 higher than the reference method (GC analysis) (evaluation value in Table 5) (Jamshidi et al., 2016). Ishkandar et al. (2021) discovered pesticide residue on the cabbage as a whole, with more satisfying findings using the same method. The minimal value detectable with this approach was 0.018 mg/kg, making it a fairly robust method for identifying pesticide residues. The prediction model parameters are listed in Table 5.
UV-VIS-NIR spectroscopy is not an indirect approach that requires multivariate calibration. Furthermore, the portable version of these three methods has issues with natural light, which might interfere with data collection (Menezes et al., 2009). Because field measurements are taken directly on things, they allow for interference from several unknown objects. Consequently, pre-processing the data is required to remove extraneous data. Table 5 shows the use of machine learning and chemometrics as algorithms to form a prediction model for the value of pesticide residues.
Table 5. The application of uv-vis-nir methods to detect pesticide residue coupled with machine learning.
|
Detection Method |
Spectral Range |
Agricultural Product |
Class of Pesticide |
Algorithm |
Model Evaluation |
Ref |
|
VIS-NIR+ |
450–1,000 nm |
Cucumber |
Diazinon |
PLS |
Rcv = 0.91 SECV = 3.22 |
(Jamshidi |
|
UV-VIS+ |
400-800 nm |
bok choy, oriental mustard, and lettuce |
Insecticides (3), fungicides, and plant growth hormones. |
SMLR |
R2 = 0.86 – 0.98 RMSE = 0.12 – 2.11 |
(Ngo et al., 2022) |
|
VIS-NIR+ |
500–940 nm |
Cabbage |
Deltamethrin |
PLS |
Rc2 = 0.98 RMSEC = 0.02 |
(Ishkandar et al., 2021) |
|
FT-NIR* |
800–2,500 nm |
Chinese Kale, Cabbage, and Chili Spur Pepper |
Profenofos |
PLSR |
Rc2 = 0.95, 0.87, and 0.96. SEC = 6.93, 12,13 and 6.11 |
(Sankom |
|
VIS-NIR* |
400–2,500 nm |
Olive |
Diuron |
PLS |
Accuracy = 85.9% |
(Salguero-Chaparro |
|
NIR |
1250–2,500 nm |
Pakchoi |
Cyhalothrin |
PCA, LDA, and KNN |
Accuracy = 92% |
(Li et al., 2018) |
|
VIS-NIR+ |
350-2,500 nm |
Lettuce Leave |
Fenvalerate |
LVQ NN, and BP-NN |
Accuracy = 98.36 and 90.16% |
(Sun et al., 2013) |
|
Transmittance NIR* |
950–1,650 nm |
Lettuce Leave |
Fenvalerate and Chlorpyrifos |
SVM |
Accuracy= 99.16% |
(Sun et al., 2018) |
|
VIS-NIR+ |
350-1,800 nm |
Navel Orange |
Dichlorvos |
PSO-PLS |
Rc = 0.8732 |
(Xue et al., 2012) |
|
VIS-NIR+ |
350-1,100 nm |
Tomato |
Profenofos |
SPA-ANN |
Rc = 0.988 RMSEC = 0.141 |
(Nazarloo |
|
NIR* |
800-2,500 nm |
Paddy Rice |
carbofuran |
PLS |
R2 = 0.87 RMSEC = 6.24 |
(Rungchang et al., 2018) |
|
VIS-NIR+ |
350-2,500 nm |
Cabbage |
Chlorpyrifos and Carbendazim |
PLSR and LS-SVM |
Rc = 0.9991 RMSEC = 1.39 |
(Lu et al., 2021) |
|
NIR+ |
900 – |
Bok Choi |
Chlorpyrifos |
PLS-DA. SVM, and PC-ANN |
Accuracy = 100% |
(Lapcharoensuk et al., 2022) |
|
FTIR+ |
2,500 – 14,500 nm |
Cocoa Beans |
Multiclass (4) |
PLSR |
Rc = 0.954 SEC = 14.9 |
(Villanueva et al., 2023) |
*: Bench-top; +: Portable; SMLR: Stepwise multiple linear regression; RMSECV: root mean square errors of calibration-validation; PLSR: Partial least square regression; PCA: Principal component analysis; LDA: Linear discriminant analysis; KNN: k-Nearest Neighbor; LVQ: Learning Vector Quantization; BP-NN: Back propagation neural network; SVM: Support vector machine; PSO: Particle swarm optimization; SPA: Successive prediction algorithm; ANN: Artificial Neural Network: LS: Linear regression
In an experiment to identify boscalid and pyraclostrobin residues in strawberries, Yazici et al. (2020) discovered encouraging outcomes from applying the NIR technique. In this development, the authors created a prediction model using the PLS method, with calibration R values for the agents boscalid and pyraclostrobin of 0.89 and SEC values of 3.25 and 0.73, respectively. Unfortunately, it was apparent from the findings that the prediction model can only discriminate between low-mid-high values. According to Nicolaï et al. (2007), the RPD score in the strawberry research demonstrates that the prediction model can only make hazy predictions. Additionally, the strawberry author recommended creating a prediction model with more samples.
Aside from other considerations, such as human and equipment imperfections, using the PLS method as a modeling technique and lowering data dimensionality is still insufficient for UV-VIS-NIR spectra data types with high amounts of data and noise. As a result, the PLS approach is frequently used with the pre-processing data method. The pre-processing data strategy boosted the R2 value up to 0.84 in the investigation that exposed the chlorpyrifos-methyl residue in raw, brown, and milled rice (Rodriguez et al., 2021). Table 5 shows that the robustness model has improved.
The PCA technique, in addition to PLS, can be employed to reduce redundant and noisy data. Consequently, the proposed model's speed, accuracy, and reliability might be improved. Because PCA is an unsupervised approach, another algorithm is required to create a predictive model. Hence, ANN is the best option because it can not limit the amount of data. However, the ANN will be practical for spectrum data because of its characteristics, such as fault tolerance, which is excellent (Mijwel, 2018). By integrating the PCA and ANN algorithms, Charles (2021) attempted to create a prediction model to estimate the residue of mancozeb and thiocyclam hydrogen oxalate (THO) on tomatoes. The spectra data ranging from 200 to 1,025 nm was utilized as input, with PCA reducing the quantity of data and providing a principal component (PC). The algorithm's new components retained the original data's core information. Consequently, for the residue mancozeb, the ANN algorithm had an outstanding Rc2 value of 0.98 and an RMSEC value of 0.02 ppm. The ANN error value outperformed the RF and SVR algorithms in the THO residue prediction model while having the same R2 value. In addition, the author presented that the LOD values of UV, VIS, and NIR methods could reach 0.011 ppm for both residues.
Computational techniques estimate pesticide residue values and categorize pesticide-containing and pesticide-free samples. By inputting VIS/NIR spectral data, Nazarloo et al. (2021) distinguished between fresh and pesticide-infected tomatoes using the PLS-DA algorithm and categorized the samples with 90% accuracy. Furthermore, the investigation of the surface of the Hami melon yielded a superior prediction result of 99.17%. The authors could better discriminate fresh Hami melon from pesticide-contaminated Hami melon using the 1D-CNN algorithm than conventional identification methods (i.e., PLS-DA and SVM).
Overall, UV-VIS-NIR spectroscopy is reliable for identifying pesticide residues at both the bench-top and portable scales. The primary advantages of the scale laboratory are the stability and precision of the sample spectrum information, however, this approach is not ideal for field demands. As a result, the portable spectrometer's tiny size is better suited to practical purposes in the field. These three approaches have intermediate sensitivity, and selectivity generally remains a source of concern (Jornet-Martínez et al., 2017).
Application of hyperspectral imaging for pesticide residues detection of agricultural product
Basic concept of hyperspectral system
The rationale for developing a hyperspectral imaging (HSI) system is to overcome the constraints of current spectroscopy and imaging approaches. Spectroscopy is a technique for determining an item's spectral properties due to its interaction with light. Meanwhile, the imaging system is a mechanism for obtaining spatial data. As a result, hyperspectral was derived from both approaches, and the data collected may be seen as a three-dimensional data cube, including both spatial and spectrum data (Figure 8). Even after the data collection process, the freedom to select the region of interest (ROI) is provided by getting information from every pixel (ElMasry and Sun, 2010). The main distinction between hyperspectral and multispectral image capture is the number of wavebands exploited during picture acquisition, with hyperspectral employing a narrow waveband throughout a contiguous wavelength range (Buckner et al., 2016).
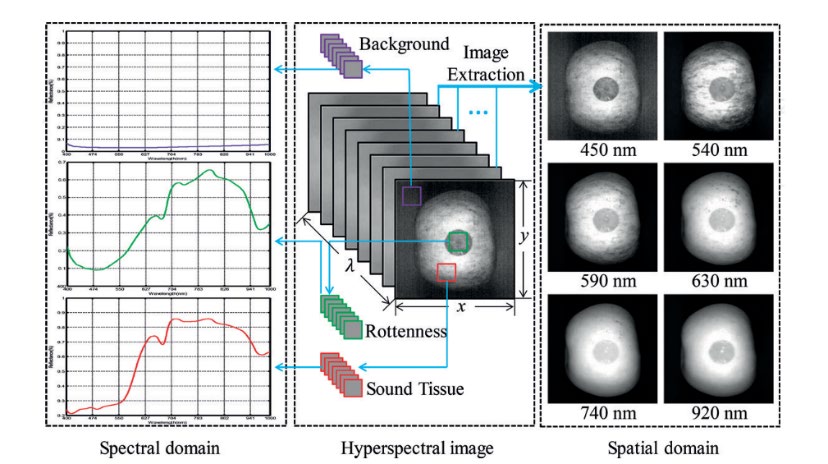
Figure 8. Schematic diagram of hyperspectral image (hypercube data).
The hyperspectral method is ideal for detecting pesticide residues since it covers a wide range of wavelengths (UV, VIS, NIR, SWIR, IR, etc.). Additionally, the impact of pesticide residues on the physical characteristics of objects may be assessed using spatial data. Since the method gathers both spatial data and a spectrum of data, identification may be performed immediately on the item without pre-treatment (non-destructive). Furthermore, there are three scanning strategies in the hyperspectral method: point-scanning (whiskbroom), line-scanning (pushbroom), and area-scanning (Figure 9). Point-scanning and line-scanning are also referred to as spatial-scanning since they shift things from point to point or line to line. At the same time, area-scanning is also known as spectral-scanning mode since this mode fixes objects in one location and then takes photos from one wavelength to another (ElMasry and Sun, 2010)(Buckner et al., 2016).
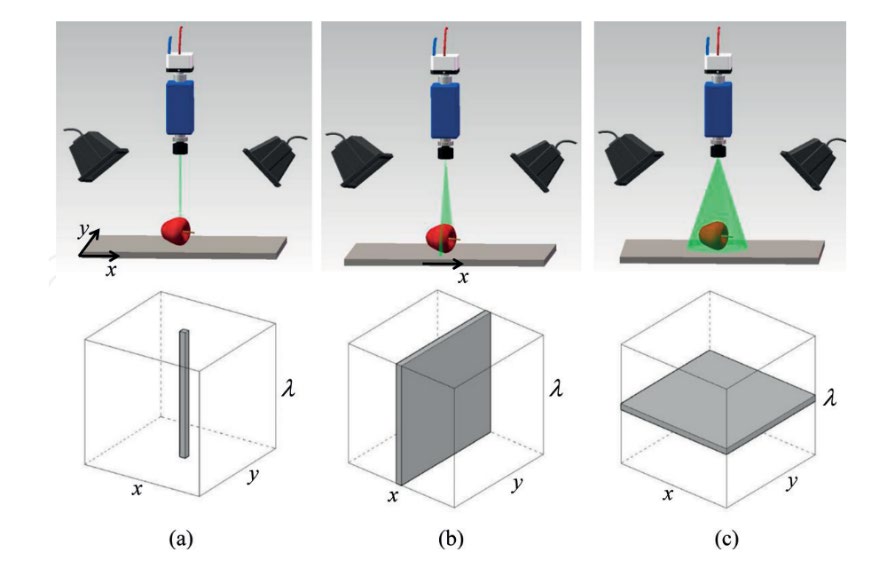
Figure 9. Hyperspectral scanning mode a) the point-scanning method or whiskbroom, b) the line-scanning method or pushbroom, and c) the area-scanning method.
In general, the hyperspectral technique's essential components are the wavelength dispersion device, camera, light source, sample place, and computer. Commonly, it has an extra part called the translation stage in the sample place. However, the installation of these components is adjusted to the requirements of the chosen scanning technique. Wavelength dispersion devices are an essential component in generating different wavelengths of light. Several types of equipment include spectrographs, filter wheels, single-shot imagers, and so on (Qin, 2010). In addition, the most often used cameras in hyperspectral technology are CCD and complementary metal oxide semiconductor cameras (CMOS). Once the light interacts with the object and goes through the dispersion component, the camera will collect the light radiation into an electrical signal (ElMasry and Sun, 2010).
There are many different light sources, including Halogen lamps, light-emitting diodes (LED), lasers, tunable sources, and others (Qin, 2010). The choice of light sources is in line with the spectrum region to be collected. Additionally, optimal lighting settings can help with data analysis and image processing, where the acquired data has minimal surface reflection, noise, or shadows.
Application of Hyperspectral Imaging to Detect Pesticide Residue
The HSI system is likewise an indirect method that necessitates calibrating the prediction model and validation of the standard method, just as UV-VIS-NIR or other spectroscopic methods. This process is like a double-edged sword, which is to endure the researchers in the early stages of establishing the calibration model. Then, pesticide residue detection will be relatively simple once the calibration and validation processes have been completed.
For instance, L. Zhang et al. (2019) constructed a model prediction to calculate the residue of omethoate on the surface of wheat grains. This investigation separated 400 wheat grain samples into 4 big groups. Each group received a different dose of omethoate treatment (i.e., pesticide-free, 1:100, 1:500, and 1:1,000). Using the HSI pushbroom mode, measurements were taken spanning the wavelength range of 866.4–1,791 nm after being left at 20°C for a week. Then, three algorithms, such as decision trees (DT), KNN, and SVM, were employed with the help of several pre-processing methods to reduce noise. The results showed the SVM algorithm produced the best classification model with a value of 98.75%, where 395 out of 400 samples were successfully classified correctly.
Undeniably, users require a massive storage space due to the volume of data that must be collected, and the HSI approach uses spatial and spectral data. Therefore, the data collected by HSI comprises object information, noise, and many redundant data. Thus, pre-processing data is necessary to lessen it. In addition, the HSI approach is well known for its multicollinearity problem because of the substantial quantity of information it can extract. The multicollinearity problem can be suppressed using multivariate analysis techniques but can not be eliminated (ElMasry and Sun, 2010; Jia et al., 2018).
Noise reduction can be accomplished manually or with the use of pre-processing procedures. Lu et al. (2017) manually eliminated the first and last 50 data points with poor signal-to-noise (S/N) values. Furthermore, Zhan-qi et al. (2018) used the Multiple Scatter Correction (MSC) algorithm to decrease the noise in the data. Both experiments produced good accuracy values of >96% and >97%, respectively, using the whole spectrum.
Alternatively, the feature selection technique can decrease noise and multicollinearity effects. This strategy eliminates irrelevant data by picking certain critical variables with the highest correlation, resulting in a more reliable prediction model. Research on the detection of pesticide residue on lettuce employed several algorithms to select variables that characterized the object of detection, including PCA, successive projections algorithm (SPA), and a combination of wavelet transform (WT) and Monte Carlo cross-validation algorithm (MD-MCCV). According to the WT-MD-MCCV algorithm selection findings, the prediction model with six input wavelengths had an Rc2 value of 0.983 and an RMSEC of 0.04 (Sun et al., 2016). Applying feature selection, Jia et al. (2018) improved the apple surface's pesticide residue classification model. The LDA algorithm coupled with SPA feature selection produced the best results, with an accuracy of 100%, a 2% improvement over the usage of the full spectrum. Furthermore, one of the advantages of feature selection is that it reduces the complexity level of the prediction model.
One of the issues preventing on-site measurements is the HSI instrument size. The HSI approach has the potential to be portable. Although many hand-held HSI devices have been developed, their application for detecting pesticide residues remains limited. The research was conducted to identify grape cyantraniprole residue using a portable HSI device. In this investigation, samples were taken from the planting region, and data was gathered there (Figure 10). The three treatments available were free-pesticide, a single dosage (70 ml per hectare), and a double dose (140 ml per hectare). The pesticide was sprayed directly onto the tree as part of the treatment. Then, the data collection period was chosen on a clear day between 11 AM and 3 PM. Data collection was done under natural light. The accuracy rating of 91.98% for the classification model created using field data demonstrated highly acceptable results (Mohite et al., 2017).
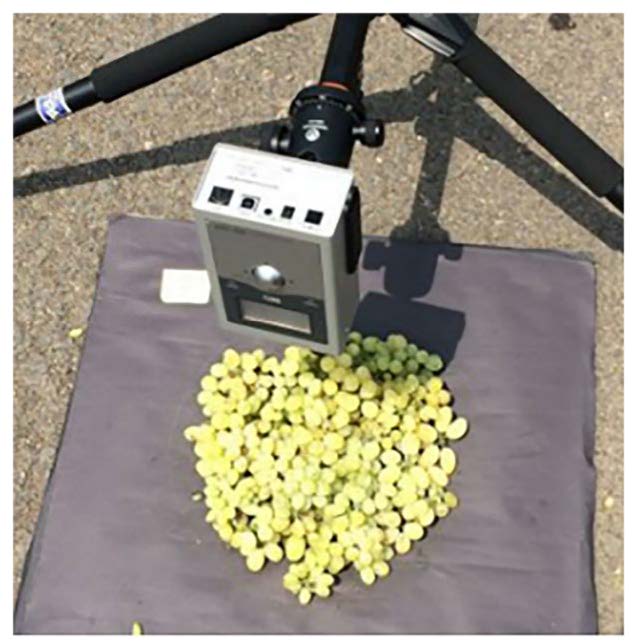
Figure 10. Portable hyperspectral experimental setup.
Currently, pests are becoming more resistant to repeated pesticide applications. Farmers are forced to use many pesticides at once as a result of this. Only using a predictive model formed from one pesticide type will make the prediction results inaccurate. He et al. (2021). established a predictive model to classify three pesticides and their mixtures (i.e., λ-cyhalothrin (LCY), trichlorfon (TCF), phoxim (Pho), and a mixture of TCF and Pho). The 1D-CNN method created three classification models utilizing the three primary pesticide data. The TCF and Pho, mixed solution data were fed into the three primary models. The findings demonstrated that the LCY model could not identify the presence of combined pesticides, which was good because no mixture solution data was fed into the LCY model. At the same time, TCF and Pho models could identify the presence of mixed solutions with an accuracy of 87.2 and 70.1%, respectively. The author claimed that although the performance had to be improved for practical use, the promising prediction findings demonstrated the ability to identify pesticide combinations.
Lastly, Jiang et al. (2017) visualized the distribution of pesticide residues in mulberry leaves using spatial HSI data. The quantitative pesticide residue value was first predicted using the developed prediction model. Furthermore, the predicted value was plotted against each pixel, with a different color for each residue level. From the results of visualization of the distribution of pesticide residues, observers could use it to find where the most frequent contamination occurs on agricultural objects. The pesticide residue distribution is shown in Figure 11.
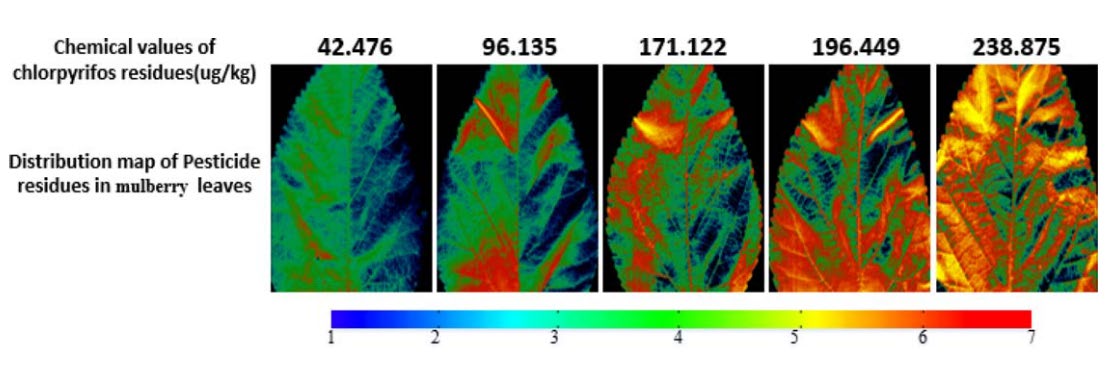
Figure 11. Pesticide residues distribution on mulberry leaves.
The visualization (Figure 11) will significantly impact if it is used to see the distribution of pesticide use in the field. Thus, pesticide use may be managed such that it does not exceed the safe level. Of course, monitoring pesticide levels in the field can not be accomplished with a bench-top HSI. Hence, field measurements are being conducted utilizing drones, robots, or other technologies, which are now referred to as Unmanned aerial vehicles (UAVs) or Unmanned ground vehicles (UGVs) (Dale et al., 2013).
DISCUSSION
According to the reviewed journals, it is clearly found that those techniques can be used for pesticide residue detection on agricultural products. The authors collected the method's abilities in a structured manner, which was reviewed in several aspects, such as initial investment, accessibility, accuracy, maturity of the method, and portability (Figure 12). The higher the assessment value (5 points) in terms of investment costs, the worse the evaluation outcomes since the device is difficult to obtain. However, for other aspects, the greater the score, the better since it reflects the device's stability in detecting pesticide residues - and the value is near to 1, indicating that this component of the method is inadequate.
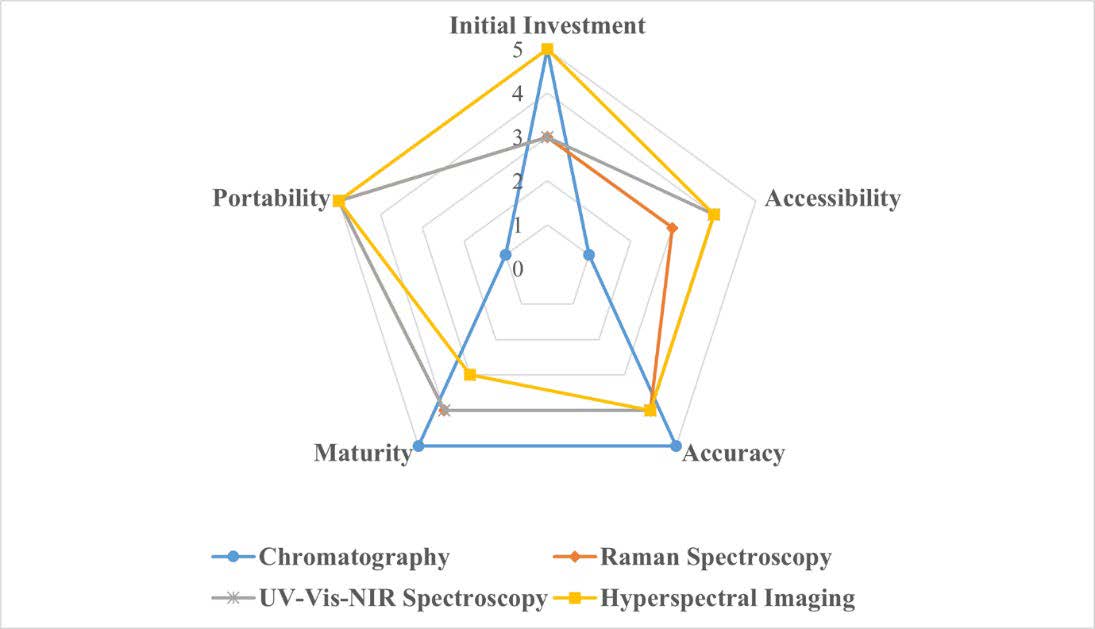
Figure 12. Spider web graph of reviewed method's aspects
The initial cost of evaluated methods is closely related to the level of accessibility; the ease of access to tools for identifying pesticide residues increases with the ease of obtaining tools. Additionally, the accessibility of the method and the detection procedure is also connected. Because of the several processes that have to be completed before seeing results, chromatography procedures and Raman spectroscopy are highly complex methods. Meanwhile, the UV-VIS-NIR and hyperspectral systems are characterized as simple because of their ability to collect data on intact samples. In terms of accuracy, all reviewed methods provide highly reliable results. Overall, the detection of the chromatography method shows stable results in various studies that touch the microgram level. Meanwhile, other methods can provide detection results at the trace level as well. Still, in several evaluated cases, the detection limit area of UV-VIS-NIR and hyperspectral methods is above the MRL value.
The chromatographic method's maturity level is very trustworthy, as was indicated by the numerous extant study outcomes. Raman spectroscopy and UV-VIS-NIR spectroscopy are one level below. Both of these methods can identify pesticide residues in agricultural products. However, in order for the error rate and accuracy to reach the desired level, the database of the prediction model for Raman and UV-VIS-NIR methods must be expanded. Hyperspectral imaging technology, one of the novel methods, is now showing remarkable promise. Although this potential has been amply demonstrated, further study is still required because so few studies have used the HSI technique. Lastly, according to the research presented in the preceding part, chromatography is the only procedure that doesn’t have a portable form. The mobile version detection method is beneficial for field data collection. Although it still needs improvement and changes so that small-holders can use the device without difficulty.
Chemical Measurement
The reviewed methods have procedural processes to obtain chemical information about agricultural samples ranging from simple to complex. Chromatography and Raman spectroscopy are categorized as complex methods due to their preparation of the sample. The chromatography method sample underwent several extraction steps in a laboratory since their basic principle is based on the separation of volatile compounds. Furthermore, the Raman spectroscopy process is the same, there is a compulsory step to produce nanoparticles before measurements. While UV/VIS/NIR spectroscopy and hyperspectral imaging have simpler procedures since their capability to collect data from intact samples. Therefore, the complex preparation procedure will always be time-consuming, especially for those working in the field, whilst methods with simple procedures will cutting-off time.
According to the reviewed works that have been discussed in the previous chapter, each method generates related chemical information about the sample and pesticide residue, which will later be used as input for ML. According to the reviewed research, chromatography methods provide data such as retention time (RT), mass-to-charge (m/z), and so on. Furthermore, the three techniques examined produced absorbance, reflectance, or transmittance values for the tested samples. Simply put, spectroscopy reveals Raman light values, whereas UV/VIS/NIR spectroscopy and hyperspectral imaging reveal Rayleigh light values. Additionally, hyperspectral imaging provides information other than spectral data, such as R, G, and B values, and so on. Therefore, the collected chemical information contains unique details data of sample and pesticide residue, which help in exposing unsafe agricultural products after the pattern recognition (ML) process.
Machine Learning
Our analysis has shown that ML and chemometrics offer great impacts in the vast majority of related work. However, when comparing the performance of ML-based algorithms with other algorithms in each paper, the authors realized that it is difficult to compare apples to apples since each paper used different datasets, pre-processing techniques, metrics, models, and parameters to solve their problems. Furthermore, the algorithms' robustness could be compared using basic index parameters such as R2 and RMSE in the regression model and accuracy and misclassification in terms of % in the classification model. As a result, based on the indices of each work, we determined that algorithms such as PLS and SVM were most typically used in generating a regression model due to their capacity to minimize data dimensionality. While PCA, LDA, KNN, and SVM algorithms were the most frequent methods to establish a classification model. Furthermore, since all our reviewed methods possessed an enormous amount of data, hence, the neural network methods needed assistance from additional algorithms, such as PCA, SPA, etc., to reduce the input data.
CONCLUSION
Pesticide substrate has been widely used in agriculture, which has a positive or negative impact. Hence, there is a need to develop and improve pesticide residue detection methods, so our foods are safe for consumption. This review paper briefly explains the implementation of those methods by describing the advantages and disadvantages of each technique. Thus, the selection process of the method to be used can be done carefully. Reviewing the methods from the viewpoint of 5 key factors—initial investment, accessibility, accuracy, method maturity, and portability—allows one to draw the conclusion that those are reliable and robust. Chromatography, Raman Spectroscopy, UV-VIS-NIR Spectroscopy, and hyperspectral imaging have been proven to detect pesticide residue at trace levels. In terms of field practices, farmers and small-holders can consider the hyperspectral method as a balanced technique in all aspects and pick the Raman Spectroscopy and UV-VIS-NIR Spectroscopy to avoid an enormous initial cost.
However, future works must be addressed along with the shifting situations that continue to arise. The practical implementation of pesticide residue detection must be done shortly; it is rare to find papers discussing it. Moreover, it is becoming increasingly important to create strategies that may be used in the field due to the evolution of rising insect resistance levels. The development of a prediction model must take into account the condition of multiple pesticide residues in agricultural products, as pest resistance increases due to farmers' excessive and varied use of pesticides.
Furthermore, in the near future, the concept of agriculture 4.0 will become increasingly widespread worldwide, requiring agricultural experts to develop internet-connected technology to support farmers with their work. Small-holders are eagerly anticipating the development of a technology that can accurately detect pesticide residue on-site threats, especially when it comes with a minimal initial cost. Lastly, since there is still a possibility to improve hyperspectral, Raman, and UV-VIS-NIR spectroscopy methods, allowing for updating features is currently regarded as inadequate. As a result, the following stage of development must include these factors while maintaining the benefits of the prior version.
CONFLICT OF INTEREST
The authors declare that they hold no competing interests.
REFERENCES
A. De Caro, C. 2015. UV / VIS Spectrophotometry. Mettler-Toledo Int. (September 2015):4–14. http://lcwu.edu.pk/ocd/cfiles/Chemistry/MSc/Chem-C-410/Fundamentals_UV_VIS.pdf.
Aheto, J.H., Huang, X., Wang, C., Tian, X., Yi, R., and Yuena, W. 2022. Fabrication and evaluation of chitosan modified filter paper for chlorpyrifos detection in wheat by surface-enhanced Raman spectroscopy. Journal of the Science of Food and Agriculture. (June). 102(15): 7323-7330.
Alamgir Zaman Chowdhury, M., Fakhruddin, A.N.M., Nazrul Islam, M., Moniruzzaman, M., Gan, S.H., and Khorshed Alam, M. 2013. Detection of the residues of nineteen pesticides in fresh vegetable samples using gas chromatography-mass spectrometry. Food Control. 34(2): 457–465.
Arias-Estévez, M., López-Periago, E., Martínez-Carballo, E., Simal-Gándara, J., Mejuto, J.C., and García-Río, L. 2008. The mobility and degradation of pesticides in soils and the pollution of groundwater resources. Agriculture, Ecosystems & Environment. 123(4): 47–260.
Armenta, S., Quintás, G., Garrigues, S., and De La Guardia ,M. 2005. Mid-infrared and Raman spectrometry for quality control of pesticide formulations. TrAC Trends in Analytical Chemistry. 24(8): 772–781.
Barberis, E., Amede, E., Dondero, F., Marengo, E., and Manfredi, M. 2022. New non-invasive method for the authentication of apple cultivars. Foods. 11(1).
Blasco, C. and Picó, Y. 2007. Liquid chromatography-mass spectrometry. P. 509–559. In: Food Toxicants Analysis. Woodhead Publishing Limited.
Blumberg, L.M. 2021. Theory of gas chromatography. Elsevier Inc.
Boyaci, I.H., Temiz, H.T., Geniş, H.E., Soykut, E.A., Yazgan, N.N., Güven, B., et al. 2015. Dispersive and FT-Raman spectroscopic methods in food analysis. RSC Advances. 5: 56606–56624.
Buckner, C.A., Lafrenie, R.M., Dénommée, J.A., Caswell, J.M., Want, D.A., Gan, G.G., Leong, Y.C., Bee, P.C., Chin, E., The, A.K.H., et al. 2016. Hyperspectral Imaging and Their Applications in the Nondestructive Quality Assessment of Fruits and Vegetables. Intech. 11(tourism): 13.
Bumbrah, G.S. and Sharma, R.M. 2016. Raman spectroscopy – Basic principle, instrumentation and selected applications for the characterization of drugs of abuse. Egyptian Journal of Forensic Sciences. 6(3): 209–215.
Charles, N.N. 2021. Rapid assessment of pesticide residues in fruits and vegetables using machine learning assisted diffuse reflectance spectroscopy by. 23 August 2021[Thesis], University of Nairobi, Kenya.
Chen, J., Dong, D., and Ye, S. 2018. Detection of pesticide residue distribution on fruit surfaces using surface-enhanced Raman spectroscopy imaging. RSC Advances. 8(9): 4726–4730.
Chhaya, K., Khanzode, A., and Sarode, R.D. 2020. Advantages and disadvantages of artificial intelligence and machine learning: A literate review. International Journal of Library and Information Science. 9: 3.
Chu, Y., Tong, Z., Dong, X., Sun, M., Gao, T., Duan, J., and Wang, M. 2020. Simultaneous determination of 98 pesticide residues in strawberries using UPLC-MS/MS and GC-MS/MS. Microchemical Journal. 156(March): 104975.
de Cripan, S.M., Cereto-Massagué, A., Herrero, P., Barcaru, A., Canela, N., and Domingo-Almenara, X. 2022. Machine learning-based retention time prediction of trimethylsilyl derivatives of metabolites. Biomedicines. 10(4): 1–15.
Dai, F., Hong, T., Zhang, K., and Hong, Y. 2010. Nondestructive detection of pesticide residue on longan surface based on near infrared spectroscopy. In: 2010 International Conference on Intelligent Computation Technology and Automation, ICICTA 2010. Vol. 2. IEEE. p. 781–783.
Dale, L.M., Thewis, A., Boudry, C., Rotar, I., Dardenne, P., Baeten, V., and Pierna, J.A.F. 2013. Hyperspectral imaging applications in agriculture and agro-food product quality and safety control: A review. Applied Spectroscopy Reviews. 48(2): 142–159.
Dhakal, S., Li, Y., Peng, Y., Chao, K., Qin, J., and Guo, L. 2014. Prototype instrument development for non-destructive detection of pesticide residue in apple surface using Raman technology. Journal of Food Engineering. 123: 94–103.
Deconinck, E., Sacré, P.Y., Courselle, P., and De Beer, J.O. 2013. Chromatography in the detection and characterization of illegal pharmaceutical preparations. Journal of Chromatographic Science. 51:791–806.
Diop, A., Diop, Y.M., Thiaré, D.D., Cazier, F., Sarr, S.O., Kasprowiak, A., Landy, D., and Delattre, F. 2016. Monitoring survey of the use patterns and pesticide residues on vegetables in the Niayes zone, Senegal. Chemosphere. 144: 1715–1721.
Du, X., Wang, P., Fu, L., Liu, H., Zhang, Z., and Yao, C. 2020. Determination of chlorpyrifos in pears by Raman spectroscopy with Random forest regression analysis. Analytical Letters. 53(6): 821–833.
ElMasry, G. and Sun, D.W. 2010. Principles of Hyperspectral Imaging Technology. P. 3–43. In: Hyperspectral imaging for food quality analysis and control.
Enmark, M., Häggström, J., Samuelsson, J., and Fornstedt, T. 2022. Building machine-learning-based models for retention time and resolution predictions in ion pair chromatography of oligonucleotides. Journal of Chromatography A. 1671:462999.
Facco, J.F., Martins, M.L., Bernardi, G., Prestes, O.D., Adaime, M.B., and Zanella, R. 2015. Optimization and validation of a multiresidue method for pesticide determination in maize using gas chromatography coupled to tandem mass spectrometry. Analytical Methods. 7(1): 359–365.
Fernández-Albert, F. 2014. Machine learning methods for the analysis of liquid chromatography-mass spectrometry datasets in metabolomics. October 2014 [thesis] Universitat Politecnica De Catalunya.
Hage, D. S. 2018. Chromatography. In Principles and Applications of Clinical Mass Spectrometry: Small Molecules, Peptides, and Pathogens (pp. 1-32). Elsevier.
Hara, R., Ishigaki, M., Kitahama, Y., Ozaki, Y., and Genkawa, T. 2018. Excitation wavelength selection for quantitative analysis of carotenoids in tomatoes using Raman spectroscopy. Food Chemistry. 258(February): 308–313.
He, Y., Xiao, S., Dong, T., and Nie, P. 2019. Gold nanoparticles with different particle sizes for the quantitative determination of chlorpyrifos residues in soil by SERS. International Journal of Molecular Sciences. 20(11): 2817.
He, W., He, H., Wang, F., Wang, S., and Lyu, R. 2021. Non-destructive detection and recognition of pesticide residues on garlic chive (Allium tuberosum) leaves based on short wave infrared hyperspectral imaging and one-dimensional convolutional neural network. Journal of Food Measurement and Characterization. 15:4497–4507.
Hemrattrakun, P., Nakano, K., Boonyakiat, D., Ohashi, S., Maniwara, P., Theanjumpol, P., and Seehanam, P. 2021. Comparison of Reflectance and Interactance Modes of Visible and Near-Infrared Spectroscopy for Predicting Persimmon Fruit Quality. Food Analytical Methods. 14(1): 117–126.
Hogendoorn, E.A. 2006. High-performance liquid chromatography methods in pesticide residue analysis. In Encyclopedia of Analytical Chemistry: Applications, Theory, and Instrumentation.
Hu, B., Sun, D.W., Pu, H., and Wei, Q. 2020. Rapid nondestructive detection of mixed pesticides residues on fruit surface using SERS combined with self-modeling mixture analysis method. Talanta. 217(April): 120998.
Huang, D., Zhao, J., Wang, M., and Zhu, S. 2020. Snowflake-like gold nanoparticles as SERS substrates for the sensitive detection of organophosphorus pesticide residues. Food Control. 108(May 2019): 106835.
Huang, S., Hu, J., Guo, P., Liu, M., and Wu, R. 2015. Rapid detection of Chorpyriphos Residues in rice by Surface-Enhanced Raman Scattering. Analytical Methods. 2015, 7: 4334-4339.
Huang, S., Hu, J., Wu, R., Liu, M., Fan, Y., Wang, X., and Guo, P. 2016. Establishment of rapid detection method of phosalone residues in pakchoi by surface-enhanced Raman scattering spectroscopy. Spectroscopy Letters. 49(2): 128–134.
Husted, S. 2015. Recent developments in fast spectroscopy for plant mineral analysis. Frontiers in Plant Science. 6(March): 1–14.
Ishkandar, D.M., Nawi, N.M., Janius, R., Mazlan, N, and Lin, T.T. 2021. Detection of deltamethrin in cabbages using visible shortwave near-infrared spectroscopy. Food Research International. 5(3): 273–280.
Ismail, B. and Nielsen, S.S. 2010. Basic principles of chromatography. In: Handbook of Analytical Techniques. p. 473–498. http://link.springer.com/10.1007/978-1-4419-1478-1_27.
Jallow, M.F.A., Awadh, D.G., Albaho, M.S., Devi, V.Y., and Ahmad, N. 2017. Monitoring of pesticide residues in commonly used fruits and vegetables in Kuwait. International Journal of Environmental Research and Public Health. 14(8): 833.
Jamshidi, B., Mohajerani, E., and Jamshidi, J. 2016. Developing a VIS/NIR spectroscopic system for fast and non-destructive pesticide residue monitoring in agricultural product. Journal of the International Measurement Confederation. 89: 1–6.
Jardim, A.N.O. and Caldas, E.D. 2012. Brazilian monitoring programs for pesticide residues in food - Results from 2001 to 2010. Food Control. 25(2): 607–616.
Ji, R., Zhao, Z., Zhang, L., Ji, L., Zhang, J., Shen, L., and Lan, X. 2013. Absorption spectra of pesticide residue about imidacloprid in fruit juices. Chemistry: An Asian Journal. 25(18): 10153–10156.
Jia, Y., He, J., Fu, H., Shao, X., and Li, Z. 2018. Apple surface pesticide residue detection method based on hyperspectral imaging. Lecture Notes in Computer Science. 11266 LNCS(31371854): 539–556.
Jiang, S., Sun, J., Xin, Z., Mao, H., Wu, X., and Li, Q. 2017. Visualizing distribution of pesticide residues in mulberry leaves using NIR hyperspectral imaging. Journal of Food Process Engineering. 40(4): 1–6.
Jiao, A., Dong, X., Zhang, H., Xu, L., Tian, Y., Liu, X., and Chen, M. 2019. Construction of pure worm-like AuAg nanochains for ultrasensitive SERS detection of pesticide residues on apple surfaces. Spectrochim Acta - Part A Molecular and Biomolecular Spectroscopy. 209: 241–247.
John, N. and George, S. 2017. Raman spectroscopy. Elsevier Inc.
Jornet-Martínez N, Moliner-Martínez Y, Molins-Legua C, Campíns-Falcó P. 2017. Trends for the development of in situ analysis devices. In Encyclopedia of Analytical Chemistry. 1–23.
Jun, S., Xin, Z., Xiaohong, W., Bing, L., Chunxia, D., and Jifeng, S. 2019. Research and analysis of cadmium residue in tomato leaves based on WT-LSSVR and VIS-NIR hyperspectral imaging. Spectrochim Acta - Part A Molecular and Biomolecular Spectroscopy. 212: 215–221.
Kalogiouri, N.P., Manousi, N., Rosenberg, E., Zachariadis, G.A., Paraskevopoulou, A., and Samanidou, V. 2021. Exploring the volatile metabolome of conventional and organic walnut oils by solid-phase microextraction and analysis by GC-MS combined with chemometrics. Food Chemistry. 363(April):130331.
Khalid, S., Khalil, T., and Nasreen, S. 2014. A survey of feature selection and feature extraction techniques in machine learning. 2014 Science and Information Conference. 372–378.
Kim, K.H., Kabir, E. and Jahan, S.A. 2017. Exposure to pesticides and the associated human health effects. Science of the Total Environment. 575:525–535.
Kizil, R. and Irudayaraj, J. 2018. Spectroscopic technique: Fourier transform Raman (FT-Raman) spectroscopy. 2nd ed. Elsevier Inc.
Kowalska, G., Pankiewicz, U., and Kowalski, R. 2020. Estimation of pesticide residues in selected products of plant origin from Poland with the use of the HPLC-MS/MS technique. Agriculture. 10(6): 192.
Kozai, T., Niu, G., and Takagaki, M. 2015. Plant factory: An indoor vertical farming system for efficient quality food production. Academic Press, Cambridge.
Kumar S, Goel P, Singh JP. 2017. Flexible and robust SERS active substrates for conformal rapid detection of pesticide residues from fruits. Sensors and Actuators B: Chemical. 241: 577–583.
Kusumaningrum, D., Lee, H., Lohumi, S., Mo, C., Kim, M.S., and Cho, B. 2017. Non-destructive technique for determining the viability of soybean (Glycine max) seeds using FT-NIR spectroscopy. Journal of the Science of Food and Agriculture. (2018), 98(5):1734-1742.
Kwon, H., Kim, T.K., Hong, S.M., Se, E.K., Cho, N.J., and Kyung, K.S. 2015. Effect of household processing on pesticide residues in field-sprayed tomatoes. Food Science and Biotechnology. 24(1): 1–6.
Lapcharoensuk, R., Fhaykamta, C., Anurak, W., Chadwut, W., and Sitorus, A. 2022. Nondestructive detection of pesticide residue (Chlorpyrifos) on Bok Choi (Brassica rapa subsp. Chinensis) using a portable NIR spectrometer coupled with a machine learning approach. SSRN Electronic Journal. 12:955.
Lebanov, L., Tedone, L., Ghiasvand, A., and Paull, B. 2020. Random forests machine learning applied to gas chromatography – Mass spectrometry derived average mass spectrum data sets for classification and characterisation of essential oils. Talanta. 208(October 2019): 120471.
Leili, M., Pirmoghani, A., Samadi, M.T., Shokoohi, R., Roshanaei, G., Poormohammadi, A. 2016. Determination of pesticides residues in cucumbers grown in greenhouse and the effect of some procedures on their residues. Iranian Journal of Public Health. 45(11): 1481–1490.
Li, M. and Wang, X.R. 2019. Peak alignment of gas chromatography–mass spectrometry data with deep learning. Journal of Chromatography A. 1604: 1–40.
Li, M., Zhang, X., and Jiang, Q. 2018. Qualitative identification of pesticide residues in pakchoi based on near infrared spectroscopy. IOP Conference Series: Materials Science and Engineering. 466(1): 4.
Li, Q., Huang, Y., Zhang, J., and Min, S. 2021. A fast determination of insecticide deltamethrin by spectral data fusion of UV–vis and NIR based on extreme learning machine. Spectrochim Acta - Part A Molecular and Biomolecular Spectroscopy. 247: 119119.
Lin, L., Dong, T., Nie, P., Qu, F., He, Y., Chu, B., and Xiao, S. 2018. Rapid determination of thiabendazole pesticides in rape by surface enhanced Raman spectroscopy. Sensors. 18(4): 1–14.
Liu, B., Zhou, P., Liu, X., Sun, X., Li, H., and Lin, M. 2013. Detection of pesticides in fruits by surface-enhanced raman spectroscopy coupled with gold nanostructures. Food and Bioprocess Technology. 6(3): 710–718.
Liu, S., Bai, A., Song, L., Zou, N., Han, Y., Zhou, L., Yu, C., Li, C., and Pan, C. 2021. Utilizing a rapid multi-plug filtration cleanup method for 72 pesticide residues in grape wines followed by detection with gas chromatography tandem mass spectrometry. Foods. 10(1): 2731.
Logan, N., Haughey, S.A., Liu, L., Burns, D.T., Quinn, B., Cao, C., and Elliott, C.T. 2022. Handheld SERS coupled with QuEChERs for the sensitive analysis of multiple pesticides in basmati rice. npj Science of Food. 6(1): 1–11.
Lozano, A., Rajski, Ł., Belmonte-Valles, N., Uclés, A., Uclés, S., Mezcua, M., and Fernández-Alba, A.R. 2012. Pesticide analysis in teas and chamomile by liquid chromatography and gas chromatography tandem mass spectrometry using a modified QuEChERS method: Validation and pilot survey in real samples. Journal of Chromatography A. 1268: 109–122.
Lozano, A., Rajski, Ł., Uclés, S., Belmonte-Valles, N., Mezcua, M., and Fernández-Alba, A.R. 2014. Evaluation of zirconium dioxide-based sorbents to decrease the matrix effect in avocado and almond multiresidue pesticide analysis followed by gas chromatography tandem mass spectrometry. Talanta. 118: 68–83.
Lu, X., Sun, J., Yang, N., Zhang, J., and Zhang, J. 2017. Discrimination of absence or presence of pesticide residue in mulberry leaf using VIS-NIR hyperspectral imaging and plsda. DEStech Transactions on Engineering and Technology Research. (icca).
Lu, Y., Li, X., Li, W., Shen, T., He, Z., Zhang, M., et al. 2021. Detection of chlorpyrifos and carbendazim residues in the cabbage using visible/near-infrared spectroscopy combined with chemometrics. Spectrochimica Acta, Part A: Molecular and Biomolecular Spectroscopy.257: 119759.
Lytou, A.E., Panagou, E.Z., and Nychas, G.J.E. 2019. Volatilomics for food quality and authentication. Current Opinion In Food Science. 28: 88–95.
Mac Loughlin, T.M., Peluso, M.L., Etchegoyen, M.A., Alonso, L.L., de Castro, M.C., Percudani, M.C., and Marino, D.J.G. 2018. Pesticide residues in fruits and vegetables of the argentine domestic market: Occurrence and quality. Food Control. 93(May): 129–138.
Maguire, W.J., Call, C.W., Cerbu, C., Jambor, K.L., and Benavides-Montes, V.E. 2019. Comprehensive determination of unregulated pesticide residues in oregon cannabis flower by liquid chromatography paired with triple quadrupole mass spectrometry and gas chromatography paired with triple quadrupole mass spectrometry. Journal of Agricultural and Food Chemistry. 67(46): 12670–12674.
Makky, M. and Soni, P. 2014. In situ quality assessment of intact oil palm fresh fruit bunches using rapid portable non-contact and non-destructive approach. Journal of Food Engineering. 120(1): 248–259.
Menezes, J.C., Ferreira, A.P., Rodrigues, L.O., Brás, L.P., and Alves, T.P. 2009. Chemometrics role within the PAT context: Examples from primary pharmaceutical manufacturing. Comprehensive Chemometrics. 4: 313–355.
Michlig, N., Lehotay, S.J., Lightfield, A.R., Beldoménico, H., and Repetti, M.R. 2021. Validation of a high-throughput method for analysis of pesticide residues in hemp and hemp products. Journal of Chromatography A. 1645:462097.
Mijwel, M.M. 2018. Artificial neural networks advantages and disadvantages. (March).
Misal, R.M. and Deshmukh, R.R. 2016. Nondestructive detection of pesticide residue on banana surface based on near infrared spectroscopy. International Journal of Science and Research. 5(8): 2013–2016.
Mohammed, A. 2011. Theoretical studies of Raman scattering. Abdelsalam Mohammed.
Mohite, J., Karale, Y., Pappula, S., Shabeer, T. P. A, Sawant, S.D., and Hingmire, S. 2017. Detection of pesticide (Cyantraniliprole) residue on grapes using hyperspectral sensing. Sensing for Agriculture and Food Quality and Safety IX. P.102170.
Nazarloo, A.S., Sharabiani, V.R., Gilandeh, Y.A., Taghinezhad, E., Szymanek, M. 2021. Evaluation of different models for non-destructive detection of tomato pesticide residues based on near-infrared spectroscopy. Sensors. 21(9): 1–13.
Nazarloo, A.S., Sharabiani, V.R., Gilandeh, Y.A., Taghinezhad, E., Szymanek, M., and Sprawka, M. 2021. Feasibility of using VIS/NIR spectroscopy and multivariate analysis for pesticide residue detection in tomatoes. Processes. 9(2): 1-13a.
Ngo, V.D., Hoang, L.T.A., Pham, V.C., Ngo, V.H., and Tran, P.H. 2022. Estimation of pesticide residues on leafy vegetables using a developed handheld spectrometer. Biointerface Research in Applied Chemistry. 12(6): 8163–8173.
Nicolaï, B.M., Beullens, K., Bobelyn, E., Peirs, A., Saeys, W., Theron, K.I., and Lammertyn, J. 2007. Nondestructive measurement of fruit and vegetable quality by means of NIR spectroscopy: A review. Postharvest Biology and Technology. 46(2): 99–118.
Omer, S.A. and Fakhre, N.A. 2019. Three different spectrophotometric methods for simultaneous determination of pyriproxyfen and chlorothalonil residues in cucumber and cabbage samples. Journal of Spectroscopy. 2019(2): 1-11.
Pan, T.-tiao, Guo, W., Lu, P., and Hu, D. 2021. In situ and rapid determination of acetamiprid residue on cabbage leaf using surface-enhanced Raman scattering. Journal of the Science of Food and Agriculture. 101(9): 3595–3604.
Pang, S., Yang, T.,and He, L. 2016. Review of surface enhanced Raman spectroscopic (SERS) detection of synthetic chemical pesticides. TrAC - Trends in Analytical Chemistry. 85: 73–82.
Picollo, M., Aceto, M., and Vitorino, T. 2019. UV-VIS spectroscopy. Physical Sciences Reviews. 4(4): 1–14.
Pizzutti, I.R., De Kok, A., Da Silva, R.C., and Rohers, G.N. 2017. Comparison between three chromatographic (GC-ECD, GC-PFPD and GC-ITD-MS) methods and a UV-VIS spectrophotometric method for the determination of dithiocarbamates in lettuce. Journal of the Brazilian Chemical Society. 28(5): 775–781.
Qin, J. 2010. Hyperspectral Imaging Instruments. In: Hyperspectral Imaging for Food Quality Analysis and Control. First Edit. Elsevier Inc. p. 129–172.
Ramadan, M.F.A., Abdel-Hamid, M.M.A., Altorgoman, M.M.F., Al Garamah, H.A., Alawi, M.A., Shati, A.A., Shweeta, H.A., and Awwad, N.S. 2020. Evaluation of pesticide residues in vegetables from the Asir region, Saudi Arabia. Molecules. 25(1): 205.
Rahman, M., Hoque, M.S., Bhowmik, S., Ferdousi, S., Kabiraz, M.P., and van Brakel, M.L. 2021. Monitoring of pesticide residues from fish feed, fish and vegetables in Bangladesh by GC-MS using the QuEChERS method. Heliyon. 7(3):e06390.
Ranjan, B., Huang, L., Masui, K., Saito, Y., and Verma, P. 2014. Residual pesticide detection on food with particle-enhanced Raman scattering. Nanoimaging Nanospectroscopy II. 9169(January): 916908.
Riza, D.F. Al, Suzuki, T., Ogawa, Y., and Kondo, N. 2017. Diffuse reflectance characteristic of potato surface for external defects discrimination. Postharvest Biology and Technology. 133(April): 12–19.
Riza, D.F. Al, Widodo, S., Yamamoto, K., and Ninomiya, K. 2022. External defects and severity level evaluation of potato using single and multispectral imaging in near infrared region. Information Processing in Agriculture. p.1–11.
Rodriguez, F.S., Armstrong, P.R., Maghirang, E.B., Yaptenco, K.F., Scully, E.D., Arthur, F.H., Brabec, D.L., Adviento-Borbe, A.D., and Suministrado, D.C. 2021. NIR spectroscopy detects chlorpyrifosmethyl pesticide residue in rough, brown, and milled rice. Applied Engineering in Agriculture. 36(6): 983–993.
Rungchang, S., Numthuam, S., Charoensook, R., Thongkum, P., and
Junmatong, C. 2018. Method development for pesticide determination in paddy rice using near infrared spectroscopy. International Journal of Agricultural Technology. 14(1): 123–129.
Sahin, F., Celik, N., Camdal, A., Sakir, M., Ceylan, A., Ruzi, M., et al. 2022. Machine Learning-Assisted Pesticide Detection on a Flexible Surface-Enhanced Raman Scattering Substrate Prepared by Silver Nanoparticles. ACS Applied Nano Materials. 5:13112–13122.
Sahu, D.K., Rai, J., Rai, M.K., Banjare, M.K., Nirmal, M., Wani, K., Sahu, R., Pandey, S.G., and Mundeja, P. 2020. Detection of flonicamid insecticide in vegetable samples by UV–Visible spectrophotometer and FTIR. Results in Chemistry. 2: 100059.
Salguero-Chaparro, L., Gaitán-Jurado, A.J., Ortiz-Somovilla, V., and
Peña-Rodríguez, F. 2013. Feasibility of using NIR spectroscopy to detect herbicide residues in intact olives. Food Control. 30(2): 504–509.
Sánchez, M.T., Flores-Rojas, K., Guerrero, J.E., Garrido-Varo, A., Pérez-Marín, D. 2010. Measurement of pesticide residues in peppers by near-infrared reflectance spectroscopy. Pest Management Science. 66(6): 580–586.
Sankom, A., Mahakarnchanakul, W., Rittiron, R., Sajjaanantakul, T., and Thongket, T. 2021. Detection of profenofos in Chinese kale, cabbage, and chili spur pepper using fourier transform near-infrared and fourier transform mid-infrared spectroscopies. ACS Omega. 6(40): 26404–26415.
Santarelli, G.A., Migliorati, G., Pomilio, F., Marfoglia, C., Centorame, P., D’Agostino, A., D’Aurelio, R., Scarpone, R., Battistelli, N., Di Simone, F., et al. 2018. Assessment of pesticide residues and microbial contamination in raw leafy green vegetables marketed in Italy. Food Control. 85: 350–358.
Shipp, D.W., Sinjab, F., and Notingher, I. 2017. Spectroscopy, Raman; (180.5655) Raman microscopy; (300.6230) Spectroscopy, coherent anti-Stokes Raman scattering; (170.3880) Medical and Biological Imaging. : 1–75.
Sivashanmugan, K., Lee, H., Syu, C.H., Liu, B.H.C., and Liao, J. Der. 2017. Nanoplasmonic Au/Ag/Au nanorod arrays as SERS-active substrate for the detection of pesticides residue. Journal of the Taiwan Institute of Chemical Engineers. 75: 287–291.
Skarysz, A., Alkhalifah, Y., Darnley, K., Eddleston, M., Hu, Y., McLaren, D.B., Nailon, W.H., Salman, D., Sykora, M., Thomas, C.L.P., et al. 2018. Convolutional neural networks for automated targeted analysis of raw gas chromatography-mass spectrometry data. Proceedings of the International Joint Conference on Neural Networks. 2018-July.
Stauffer, E. 2008. Gas chromatography and gas chromatography-mass spectrometry. In Fire Debris Analysis. p. 235-293
Steidle Neto, A.J., Lopes, D.C., and Silva, W.A. 2020. Feasibility of vis/nir spectroscopy to detect and estimate fungicide residues on intact lettuces. Advances in Horticultural Science. 34(2): 223–232.
Su, W.H., Sun, D.W., He, J.G., and Zhang, L.B. 2017. Variation analysis in spectral indices of volatile chlorpyrifos and non-volatile imidacloprid in jujube (Ziziphus jujuba Mill.) using near-infrared hyperspectral imaging (NIR-HSI) and gas chromatograph-mass spectrometry (GC–MS). Computers and Electronics in Agriculture. 139: 41–55.
Sun, J., Dong, L., Jin, X.M., Fang, M., Zhang, M.X., and Lv, W.X. 2013. Identification of pesticide residues of lettuce leaves based on LVQ neural network. Advanced Materials Research. 756–759: 2059–2063.
Sun, J., Ge, X., Wu, X., Dai, C., and Yang, N. 2018. Identification of pesticide residues in lettuce leaves based on near infrared transmission spectroscopy. Journal of Food Process Engineering. 41(Pt A):e12816.
Sun, J., Zhou, X., Mao, H.P., Wu, X.H., Zhang, X.D., and Gao, H.Y. 2016. Identification of pesticide residue level in lettuce based on hyperspectra and chlorophyll fluorescence spectra. International Journal of Agricultural and Biological Engineering. 9(6): 231–239.
Synetos, A. and Tousoulis, D. 2017. Invasive imaging techniques. Elsevier Inc.
Theanjumpol, P., Self, G., Rittiron, R., Pankasemsu, T., and Sardsud, V. 2013. Selecting variables for near infrared spectroscopy (NIRS) evaluation of mango fruit quality. Journal of Agricultural Science. 5(7): 146-159.
Theanjumpol, P., Self, G., Rittiron, R., Pankasemsuk, T., and Sardsud, V. 2014. Quality control of mango fruit during postharvest by near infrared spectroscopy. Chiang Mai University Journal of Natural Sciences. 13(2): 141–157.
Tong, Z., Wu, Y.C., Liu, Q.Q., Shi, Y.H., Zhou, L.J., Liu, Z.Y., Yu, L.S., and Cao, H.Q. 2016. Multi-residue analysis of pesticide residues in crude pollens by UPLC-MS/MS. Molecules. 21(12): 1652.
Tsen, C.M., Yu, C.W., Chuang, W.C., Chen, M.J., Lin, S.K., Shyu, T.H., Wang, Y.H., Li, C.C., Chao, W.C., and Chuang, C.Y. 2019. A simple approach for the ultrasensitive detection of paraquat residue in Adzuki beans by surface-enhanced Raman scattering. Analyst. 144(2): 426–438.
Tuschel, D. 2016. Selecting an excitation wavelength for Raman spectroscopy. Spectroscopy, 31(3): 14-23.
Usman, A.G., Isik, S., Abba, S.I., and Mericli, F. 2021. Artificial intelligence based models for the qualitative and quantitative prediction of a phytochemical compound using HPLC method. Turkish Journal of Chemistry. 44(5): 1339–1351.
Vaškevičius, M., Kapočiūtė-Dzikienė, J., and Šlepikas, L. 2021. Prediction of chromatography conditions for purification in organic synthesis using deep learning. Molecules. 26(9): 2474.
Vaye, O., Ngumbu, R.S., and Xia, D. 2022. A review of the application of comprehensive two-dimensional gas chromatography MS-based techniques for the analysis of persistent organic pollutants and ultra-trace level of organic pollutants in environmental samples. Reviews in Analytical Chemistry. 41:63–73.
Villanueva, E., Glorio-Paulet, P, Giusti, M.M., Sigurdson, G.T., Yao, S., and Rodríguez-Saona, L.E. 2023. Screening for pesticide residues in cocoa (Theobroma cacao L.) by portable infrared spectroscopy. Talanta. 257: 124386.
Walorczyk, S. 2014. Validation and use of a QuEChERS-based gas chromatographic-tandem mass spectrometric method for multiresidue pesticide analysis in blackcurrants including studies of matrix effects and estimation of measurement uncertainty. Talanta. 120: 106–113.
Wang, H., Ping, H., Liu, Q., Han, P., and Guo, X. 2022. Determination of pesticide residues in strawberries by ultra-performance liquid chromatography-Tandem Mass Spectrometry. Food Analytical Methods. 15(1): 85–95.
Wang, K., Sun, D.W., Pu, H., and Wei, Q. 2019. Surface-enhanced Raman scattering of core-shell Au@Ag nanoparticles aggregates for rapid detection of difenoconazole in grapes. Talanta. 191(July 2018): 449–456.
Wang, L., Ma, P., Chen, H., Chang, M., Lu, P., Chen Ning, Yuan, Y., Chen Nan, and Zhang, X. 2022. Rapid determination of mixed pesticide residues on apple surfaces by surface-enhanced Raman spectroscopy. Foods. 11(8): 1089.
Wang, M., Shi, G., Zhu, Y., Wang, Y., and Ma, W. 2018. Au-decorated dragonfly wing bioscaffold arrays as flexible surface-enhanced raman scattering (SERS) substrate for simultaneous determination of pesticide residues. Nanomaterials. 8(5): 289.
Wanwimolruk, S., Kanchanamayoon, O., Phopin, K., and Prachayasittikul, V. 2015. Food safety in Thailand 2: Pesticide residues found in Chinese kale (Brassica oleracea), a commonly consumed vegetable in Asian countries. Science of the Total Environment. 532:447–455.
Weng, S., Yu, S., Dong, R., Zhao, J., and Liang, D. 2019. Detection of pirimiphos-methyl in wheat using surface-enhanced raman spectroscopy and chemometric methods. Molecules. 24(9): 1694.
Weng, S., Zhu, W., Dong, R., Zheng, L., and Wang, F. 2019. Rapid detection of pesticide residues in paddy water using surface-enhanced Raman spectroscopy. Sensors. 19(3): 506.
Widjaja Putra, B.T. and Soni, P. 2017. Evaluating NIR-Red and NIR-Red edge external filters with digital cameras for assessing vegetation indices under different illumination. Infrared Physics and Technology 81: 148–156.
Wu, H., Luo, Y., Hou, C., Huo, D., Wang, W., Zhao, J., and Lei, Y. 2019. Rapid and fingerprinted monitoring of pesticide methyl parathion on the surface of fruits/leaves as well as in surface water enabled by gold nanorods based casting-and-sensing SERS platform. Talanta. 200(February): 84–90.
Xu ML, Gao Y, Han XX, Zhao B. 2017. Detection of pesticide residues in food using surface-enhanced Raman spectroscopy: A review. Journal of Agricultural and Food Chemistry. 65(32): 6719–6726.
Xue, L., Cai, J., Li, J., and Liu, M. 2012. Application of particle swarm optimization (PSO) algorithm to determine dichlorvos residue on the surface of navel orange with VIS-NIR spectroscopy. Procedia Engineering. 29: 4124–4128.
Yang, D. and Ying, Y. 2011. Applications of raman spectroscopy in agricultural products and food analysis: A review. Applied Spectroscopy Reviews. 46(7): 539–560.
Yang, K. 2018. Gas chromatography/pesticide residues analysis by clarus 690 gas chromatograph and sq 8 mass spectrometer. PerkinElmer, China.
Yang, X., Luo, J., Li, S., and Liu, C. 2016. Evaluation of nine pesticide residues in three minor tropical fruits from southern China. Food Control. 60: 677–682.
Yang, Y., Creedon, N., O’Riordan, A., and Lovera, P. 2021. Surface Enhanced Raman Spectroscopy: Applications in agriculture and food safety. Photonics. 8(12): 568.
Yaseen, T., Pu, H., and Sun, D.W. 2019. Fabrication of silver-coated gold nanoparticles to simultaneously detect multi-class insecticide residues in peach with SERS technique. Talanta. 196(September 2018): 537–545.
Yaseen, T., Sun, D.W., Pu, H., and Pan, T.T. 2018. Detection of omethoate residues in peach with surface-enhanced Raman spectroscopy. Food Analytical Methods. 11(9): 2518–2527.
Yazici, A., Tiryaki, G.Y., and Ayvaz, H. 2020. Determination of pesticide residual levels in strawberry (Fragaria) by near-infrared spectroscopy. Journal of the Science of Food and Agriculture. 100(5): 1980–1989.
Yeong, T.J., Jern, K.P., Yao, L.K., Hannan, M.A., and Hoon, S.T.G. 2019. Applications of photonics in agriculture sector: A review. Molecules. 24(10): 2025.
Yu, J., Wang, H., Zhan, J., and Huang, W. 2018. Review of recent UV–VIS and infrared spectroscopy researches on wine detection and discrimination. Applied Spectroscopy Reviews. 53(1): 65–86.
Yuan, H., Fales, A.M., Khoury, C.G., Liu, J., and Vo-Dinh, T. 2012. Spectral characterization and intracellular detection of Surface-Enhanced Raman scattering (SERS)-encoded plasmonic gold nanostars. Journal of Raman Spectroscopy. 2013, 44(2): 234-239.
Zeng, F., Mou, T., Zhang, C., Huang, X., Wang, B., Ma, X., and Guo, J. 2019. Paper-based SERS analysis with smartphones as Raman spectral analyzers. Analyst. 144(1): 137–142.
Zhan-qi, R.E.N., Zhen-hong, R.A.O., and Hai-yan, J.I. 2018. Identification of different concentrations pesticide residues of dimethoate on spinach leaves by hyperspectral image technology. IFAC-PapersOnLine. 51(17): 758–763.
Zhang, D., Liang, P., Ye, J., Xia, J., Zhou, Y., Huang, J., Ni, D., Tang, L., Jin, S., and Yu, Z. 2019. Detection of systemic pesticide residues in tea products at trace level based on SERS and verified by GC–MS. Analytical and Bioanalytical Chemistry. 411(27): 7187–7196.
Zhang, J., Gonzalez, E., Hestilow, T., Haskins, W., and Huang, Y. 2009. Review of Peak detection algorithms in liquid-chromatography-mass spectrometry. Current Genomics. 10(6): 388–401.
Zhang, J., Xin, P.L., Wang, X.Y., Chen, H.Y., Li, D.W. 2022. Deep Learning-Based Spectral Extraction for Improving the Performance of Surface-Enhanced Raman Spectroscopy Analysis on Multiplexed Identification and Quantitation. Journal of Physical Chemistry A. 126(14):2278–2285.
Zhang, L., Rao, Z., and Ji, H. 2019. NIR hyperspectral imaging technology combined with multivariate methods to study the residues of different concentrations of omethoate on wheat grain surface. Sensors. 19(14): 3147.
Zhang, P.X., Zhou, X., Cheng, A.Y.S., and Fang, Y. 2006. Raman spectra from pesticides on the surface of fruits. Journal of Physics: Conference Series. 28(1): 7–11.
Zhang, W., Ma, J., and Sun, D.W. 2021. Raman spectroscopic techniques for detecting structure and quality of frozen foods: Principles and applications. Critical Reviews in Food Science and Nutrition. 61(16): 2623–2639.
Zhu Jiaji, Agyekum, A.A., Kutsanedzie, F.Y.H., Li, H., Chen, Q., Ouyang, Q., and Jiang, H. 2018. Qualitative and quantitative analysis of chlorpyrifos residues in tea by surface-enhanced Raman spectroscopy (SERS) combined with chemometric models. Lebensmittel-Wissenschaft & Technologie. 97(July): 760–769.
Zhu Jian, Liu, M.J., Li, J.J., Li, X., and Zhao, J.W. 2018. Multi-branched gold nanostars with fractal structure for SERS detection of the pesticide thiram. Spectrochim Acta - Part A Molecular and Biomolecular Spectroscopy. 189: 586–593.
Zhu, X., Li, W., Wu, R., Liu, P., Hu, X., Xu, L., Xiong, Z., Wen, Y., and Ai, S. 2021. Rapid detection of chlorpyrifos pesticide residue in tea using surface-enhanced Raman spectroscopy combined with chemometrics. Spectrochim Acta - Part A Molecular and Biomolecular Spectroscopy. 250: 119366.
Zohora, F.T., Rahman, M.Z., Tran, N.H., Xin, L., Shan, B., Li, M. 2019. DeepIso: A deep learning model for peptide feature detection from LC-MS map. Scientific Reports. 9(1): 17168.
OPEN access freely available online
Natural and Life Sciences Communications
Chiang Mai University, Thailand. https://cmuj.cmu.ac.th
Braja Manggala1, Chatchawan Chaichana2,*, Wahyu Nurkholis Hadi Syahputra 1, and Wasin Wongwilai 3
1 Graduate School of Engineering in Agricultural Engineering, Department of Mechanical Engineering, Faculty of Engineering, Chiang Mai University, Chiang Mai, 50200, Thailand
2 Renewable Energy and Environment Conservation Laboratory, Department of Mechanical Engineering, Faculty of Engineering, Chiang Mai University, 50200, Thailand
3 Renewable Energy and Energy Efficiency Research Unit, Science and Technology Research Institute Chiang Mai University, Chiang Mai, 50200, Thailand.
Corresponding author: Chatchawan Chaichawan E-mail: c.chaichana@eng.cmu.ac.th
Total Article Views
Editor: Tonapha Pusadee,
Chiang Mai University, Thailand
Article history:
Received: January 10, 2023;
Revised: May 29, 2023;
Accepted: June 6, 2023;
Published online: July 4, 2023