ABSTRACT This paper provides an overview of financing mechanisms for Early Childhood Care and Education (ECCE) in Japan. It also explores the differences in the level and mechanisms of funding for public and private ECCE facilities, as well as the differences in the level of public funding by prefecture. It shows that there are differences in the level of public funding per child, as well as household financial burden, among the different types of ECCE services. This may result in an inequality in the quality of ECCE services to which children have access. Although the government has made significant efforts to mitigate the gaps by combining various financing mechanisms, it is difficult to change the overall trend, which stems from the low level of government commitment to ECCE.
Keywords: Early childhood care and education, Access, Finance, Japan
INTRODUCTION
Inspired by previous research showing high rates of return from investing in Early Childhood Care and Education (ECCE), attention has turned to determining how to ensure sustained public funding for ECCE, an under-funded sub-sector (Denboba et al., 2014). The stand-alone Sustainable Development Goal (SDG) for education, namely Goal 4, reaffirms the focus on the development of ECCE as an international community1. Evidence from best practices in ECCE systems shows that sustained public funding, combined with proper quality standards and regulation, are indispensable for ensuring access to quality ECCE services for all children (UNESCO, 2006; and Bennet, 2010). Moreover, it is important that various actors coordinate to complement government’s efforts to develop ECCE (Kim & Umayahara, 2010).
1Target 4.2 under SDG 4 is set to “by 2030, ensure that all girls and boys have access to quality early childhood development, care and pre-primary education so that they are ready for primary education” (UNESCO, 2015).
In Japan, enrollment in ECCE facilities is neither compulsory nor free for children aged 3-5 years old2. While Japan performs better than average on most ECCE outcome indicators, the literature has consistently shown notably low levels of public spending, as well as high levels of household contributions (OECD, 2012). In Japan, public expenditure on ECCE totaled only 0.1% of GDP, which was notably lower than the OECD average of 0.6% (OECD, 2014). According to OECD (2014), the share of private expenditure in pre-primary educational institutions in Japan in 2011 was 55%, which was substantially higher than the OECD average of 19%. Annual expenditure per pupil in ECCE was USD 5,591 in 2011, which was significantly lower than the OECD average of USD 7,428 (OECD, 2014). Moreover, Japan is currently promoting reforms of the traditional split system. Given this unique system and a new movement toward financing ECCE, a case study in Japan has great potential to tease out useful implications.
2Education 2030, which specifies strategies for achieving SDG 4 and its targets, explicitly encour- ages the government to provide at least one year of free and compulsory education (UNESCO, 2015). According to the review by UNESCO (2016), Japan is one of 157 countries and ter- ritories with no compulsory pre-primary education among the 207 countries and territories.
However, while many studies have analyzed ECCE financing – specifically on the level of public funding, financing schemes, and integration of the fragmented system – especially in developed countries, this issue has been little discussed in Japan (Blau & Currie, 2006; Kamerman & Gatenio-Gabel, 2007; Bennet, 2008; Cleveland&Krashinsky,2009; and Kaga et al., 2012). Although recent studies of ECCE in Japan have reviewed the general trends of its financing and the structure of the new system, analysis of the variation in the level and share of public funding by region, as well as analysis using data on both childcare and education systems, are especially limited (Ikemoto, 2011; OECD, 2012; Iwate, 2015; Kimata & Kaneko, 2015; and Nanakida, 2015). Moreover, this topic is particularly important for providing evidence-based assessments of Japan’s new comprehensive support system for ECCE.
As such, this paper provides an analytical discussion of public and private financing of ECCE in Japan.
NATIONAL EARLY CHILDHOOD CARE AND EDUCATION SYSTEM
In Japan, ECCE has been provided by two types of facilities operating under different systems within different frameworks. The first is kindergarten (youchien), which belongs to the public education system under the jurisdiction of the Ministry of Education, Culture, Sports, Science and Technology (MEXT). The second is day nursery (hoikusho), which operates within the welfare system under the jurisdiction of the Ministry of Health, Labor and Welfare (MHLW). It is worth noting that kindergartens and day nurseries each have their own long history and rich traditions3.
3The first kindergarten in Japan was established at Tokyo Women’s Higher Normal School in 1876. The first day nursery in Japan was established within Niigata Seisyu School in 1890 (Nanakida, 2015).
However, the country is currently in a transitional stage from a traditional ‘dual’ system to a comprehensive support system for ECCE. It has been argued that the unification of the kindergarten and day nursery systems, combining their respective strengths, would be the best way to provide equal access to education and childcare for every child, bearing in mind the current national changes in socio-economic circum- stances, including increasing female labor participation, declining birth rates, and the widening income gap among child-rearing families (Iwatate, 2015; and Kimata & Kaneko, 2015). A large number of children, especially those under three years old, are waiting to be enrolled in day nurseries in ur- ban areas. A new type of facility, called an ECCE Center (Nintei Kodomo-en), which functions as both a kindergarten and a day nursery, was created in 20064.
4The name of this type of facility is translated as ‘Centers for Early Childhood Education and Care’ (CO et al., 2014) by the government. However, this study calls them ECCE centers to avoid confusion.
In 2012, Japan made another significant step toward the unification of the two systems, thanks to three laws enacted by the Japanese government. The Comprehensive Support System for Children and Childcare (CSSCC) was officially launched in April 2015 as part of the Integrated Reform of the Social Security and Tax System5. Under this new system, the unified-type ECCE center has been given status as both a public education facility and a welfare facility, supervised by the Cabinet Office (CO)6.
5The official names of the three laws are: (1) Act to Revise a Part of the Laws Concerning the Promotion of a Comprehensive Provision of Education and Care for Children before Entry into Primary School; (2) Act on Child Education and Childcare Support; and (3) Act on the Adjustment of Related Laws for the Enforcement of and Act to Revise a Part of the Laws Concerning the Promotion of a Comprehensive Provision of Education and Care for Children before Entry into Primary School.
6There are four types of ECCE Centers: (1) unified, (2) kindergarten, (3) day nursery, and (4) local discretionary. The kindergarten-type ECCE center has the status of a kindergarten with the function of a day nursery. The day-nursery-type ECCE center has the status of a day nursery with the function of a kindergarten. The local-discretionary-type ECCE center has no authorized status at the national level, however they can function as ECCE centers with the authorization of the local government.
The Comprehensive Support System for Children and Childcare (CSSCC) has introduced certain innovative measures to deal with the shortage of child-rearing support services for children under three years old. First, the government has begun providing financial support to small-scale childcare facilities, called ‘community-type childcare services’ (chiiki-gata hoiku), licensed only at the municipal level. Second, the government has begun to provide financial assistance to projects, namely the ‘Community Childcare and Child-rearing Support Project’ (Chiiki Kodomo Kosodate Shien Jigyou), which are planned and implemented by local governments to respond to the various needs of each
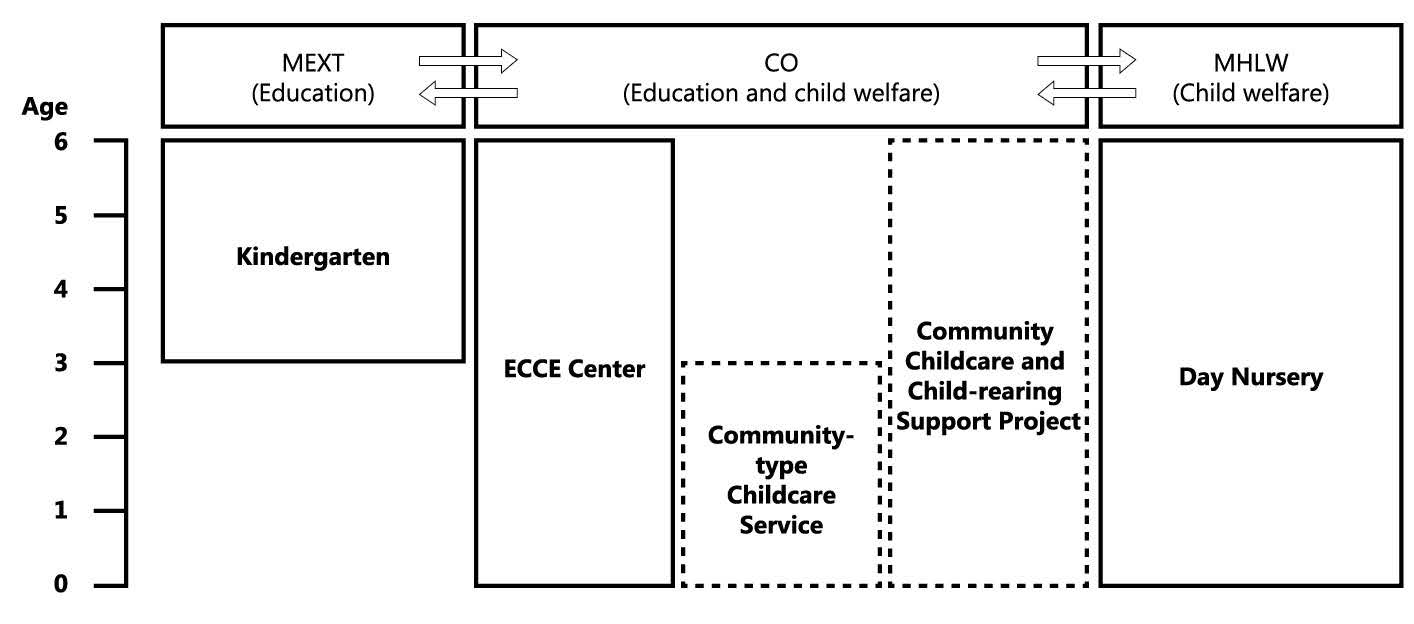
Figure 1. National ECCE system in Japan.
Source: Created by the author based on CO (2015b).
As shown in Figure 2, the number of ECCE centers doubled after the initiation of CSSCC. This increase has been attributed to an increase in the number of unified-type ECCE centers7. However, in 2015, ECCE centers still accounted for just a fraction of a percent of all ECCE facilities. Figure 2 shows that the majority of ECCE facilities are managed by private sector entities. A comparison of the basic eatures of the three types of ECCE facilities is given in Appendix A-1.
7In many cases, existing kindergartens and day nurseries have made the transition to ECCE centers.

Figure 2. Number of ECCE facilities by type and management body, 2011-2015.
Source: Created by the author based on CO (2015c), MEXT (2015a), and MHLW (2015). Note: Statistics on the number of kindergartens are as of May 1 for each year. Statistics on the number of children in day nurseries are as of October 1 for each year. Statistics on the number of ECCE Centers are as of April 1 for each year.
The changes in the content of the guidelines have also promoted decentralization. Under the new system, the municipality explicitly becomes the responsible entity for the provision of ECCE services8. Every municipality must formulate a specific plan for policy implementation every five years, based on the results of its own surveys to grasp local ECCE needs (CO, 2015). The emphasis on ECCE policy priorities has shifted to flexibly meet the diverse needs for ECCE service in different communities.
8In Japan, there are 47 prefectures, which are the first level of jurisdiction and administrative division. There are four types of prefectures: (1) metropolis (to), (2) circuit (dou), (3) urban pre- fecture (fu), and (4) normal prefecture (ken). The second level of jurisdiction and administrative division is the municipality, and each prefecture consists of a large number of municipalities. There are four types of municipality: (1) city (shi), (2) special ward (ku), (3) town (chou, some- times machi), and (4) village (son, sometimes mura).
Under CSSCC, the central government provides financial support to ECCE facilities through a facility-type benefit, regardless of their types. This benefit is mainly intended to moderate the financial burden on households, especially on those who send their children to private facilities, as well as those in the lower quintiles. All expenses of facility-type benefits for public ECCE facilities are covered by municipalities. Municipalities also cover 25% of the expenses for private facilities, since the central government only covers half of them. The remaining 25% is covered by the prefectures. The amount of facility-type benefits that each child can receive is determined by the municipalities based on his or her household income level, as well as the type and amount of ECCE service he or she receives. In general, the amount of user fees decreases as the income level of the household decreases, and thus the amount of benefits, which are calculated by subtracting the amount of user fees from the authorized price for the ECCE facility, increases. In addition, when parents or guardians send more children to ECCE facilities, the amount of facility-type benefits they can receive for each of their children increases. This is because user fees are halved for the second child, and disappear entirely for the third and later children. The facility providers pay operating and management costs, staff salaries, and other miscellaneous expenses out of the budget provided by the government and households. However, some private kindergartens opt not to receive facility-type benefits under CSSCC9. The parents and guardians of children enrolled in these private kindergartens are still eligible to receive subsidies.
9Ikemoto (2016) points out that many private kindergartens do not receive the facility-type benefit even after the introduction of CSSCC, because the financial incentives for private kin- dergartens to integrate into CSSCC are low.
LITERATURE REVIEW
In economic terms, the rationale for government intervention in the ECCE market is similar to that for basic education – market failures and equity. Blau and Currie (2006) also add the positive externality attached to the employment of low-income mothers, as a unique reason why government needs to play a role in providing ECCE services. Several series of empirical studies, typically implementing random assignments, have been conducted, mainly in the United States of America, Canada, and many European countries. These studies have found a high cost-effectiveness of ECCE in developing both cognitive and non-cognitive out-comes, as well as producing indirect benefits to society, including reduced welfare costs, reduced crime, and higher tax receipts (Schweinhart et al., 2005; Heckman & Masterov, 2007; and Havnes & Mogstad, 2009).
While the importance of the role of the government in ECCE has been, relatively speaking, commonly understood as being supported by the strong evidence of its positive outcomes, government investment in ECCE generally remains weak, even among Organisation for Economic Co-operation and Development (OECD) member countries, with the exception of France and the Nordic countries. However, some countries with relatively low levels of public funding for ECCE have significantly increased their commitment in recent years (Bennet, 2008). Comparative analyses among developing countries whose data are available also show a generally low priority of ECCE in public financing (UNESCO, 2006).
In addition to the role of government, the role of the private sector and the relative shares of public and private funding are key issues in financing ECCE. Although the benefit of private sector engagement, including offering greater choice for users and delivering innovation, should not be denied, a review of case studies in different countries shows the importance of government funding, supervision, and regulation for the private sector (Bennet, 2010). Moreover, findings are relatively consistent on the quality advantages of non-profit ECCE facilities over for-profit ECCE facilities. For instance, an analysis in Canada using four datasets found that the quality of care provided in non-profit childcare centers is significantly higher than that provided in commercial childcare centers (Cleveland & Krashinsky, 2009).
The mechanisms for financing ECCE have also frequently been a topic for debate. Bennet (2010) classified partners in this debate into two main types: those who promote supply-side funding versus consumer subsidy funding. Both financing mechanisms, including a mixture of the two, are used to fund ECCE services, especially for children under three years old (Bennet, 2010). Although it is hard to generalize, a review of the country case studies shows the advantage of the former funding mechanism in ensuring equitable access to ECCE services with good quality (OECD, 2006). Further, recent study in the Asia-Pacific region has highlighted the potential of using innovative financing mechanisms such as Social Impact Bonds (Kobe University, 2016).
Another important topic is the issue of integrating ECCE services. Since the 1970s, many have highlighted the problems in split systems, including duplication and waste of resources, as well as reduced financing and access to services for younger children. Many countries have responded to these problems either by creating inter-ministerial schemes or simply integrating national responsibility for ECCE into a single ministry. A recent cross-national study on the topic concluded that there were no clear negative consequences attached to the integration of ECCE services into the educational system (Kaga et al., 2010). Studies from countries with fragmented ECCE delivery systems show unequal access to services and wide-ranging quality, although several notable positive changes have been found as a result of recent efforts (Kamerman & Gatenio-Gabel, 2007; and Kaga et al., 2012).
In terms of financing for ECCE, Japan has lower public spending and higher household expenditure than other OECD countries (OECD, 2012). However, few have discussed how to change the level of government commitment and financing mechanisms to tackle the current challenges in providing ECCE services (Ikemoto, 2011). The Japanese government has initiated a major ECCE policy reform, making a significant step towards the unification of the dual system. Although few analyses have assessed the impact of this policy change, recent studies have shown achievements and challenges of the new policy, based on reviews of policy documents (Ikemoto, 2015; and Kimata & Kaneko, 2015). For instance, according to Ikemoto (2015), one major problem in the new system is that the central government has not yet dealt sufficiently with the risk of a widening gap between municipalities under the new highly decentralized system, due to differences in financial strength and capability.
SELECTED OUTCOME INDICATORS OF EARLY CHILDHOOD CARE AND EDUCATION
Access
In Japan, almost all 4- to 5-year- old children are enrolled in either kindergarten or day nurseries10. Figure 3 shows that around 20% of 3-year-old children did not enroll in kindergartens or day nurseries in 2014. Around one-half of children 3 years old in 2014 were 2 years old on April 1, 2014, and thus were not eligible to enroll in kindergarten that year. Figure 3 further shows that only a small proportion of children younger than 1 were enrolled in licensed day nurseries. The proportion of children enrolled in day nurseries increased with age. Around 27% and 35% of children were enrolled in day nurseries at 1 and 2 years old, respectively.
10Children who enroll in unlicensed day nurseries, such as international schools, are counted as ‘others’ in Figures 3, 4, and 5.
Figure 4 shows that around 30% of children aged 1-2 years old were enrolled in day nurseries, and this percentage slightly increased between 2011 and 2014. This slight increase may be attributable to the slight increase in the share of private day nurseries. Figure 4 also shows that the proportion of waitlisted children was small, although the importance of eliminating these lists remains un- changed11.
11Waitlisted children are those children who applied to ECCE facilities and met the enrollment criteria, but had not yet enrolled on the day when the survey was conducted (MHLW, 2016).
As shown in Figure 5, around half of the children aged 4-5 years old are enrolled in kindergartens, and around 40% of them are enrolled in day nurseries. This overall trend has not changed between 2011 and 2014, although the percentage of 4- to 5-year-olds in day nurseries has slightly increased during this time period (from 40.1% in 2011to 42.7% in 2014). Figure 5 also shows that the private sector plays an import- ant role in providing ECCE facilities in Japan, and the share of the private sector’s provision of care is gradually increasing. In 2014, 78.2% and 61.1% of 4- and 5-year-old children in kin- dergartens and day nurseries, respec- tively, were in private institutions.

Figure 3. Ratios of children by ECCE facility type by age, 2014.
Source: Created by the author based on MIC Bureau of Statistics (2016), MEXT (2015a), and MHLW (2015).
Note: Statistics on the number of children in kindergartens are as of May 1 in each year. Statis- tics on the population estimates and the number of children in day nurseries are as of October 1 in each year. Others include non-approved day nurseries, day nurseries in kindergartens, and family childcare businesses. Children enrolled in kindergarten-type ECCE centers are counted as being enrolled in kindergartens. Children enrolled in unified-type and day-nursery-type ECCE Centers are counted as being enrolled in day nurseries.

Figure 4. Percentages of children aged 1-2 years by ECCE facility type, 2011-2014.
Source: Created by the author based on MIC Bureau of Statistics (2016), MEXT (2015a), MHLW (2015), and MHLW (2016).
Note: Statistics on the number of waitlisted children are as of April 1 in each year. Statistics on the population estimates and the number of children in day nurseries are as of October 1 in each year. Others include local-discretionary-type ECCE centers, non-approved day nurseries, day nurseries in kindergartens, and family childcare businesses. Children enrolled in unified-type and day-nursery-type ECCE Centers are counted as being enrolled in day nurseries.

Figure 5. Ratios of children aged 4-5 years by ECCE facility type, 2011-2014.
Source: Created by the author based on MIC Bureau of Statistics (2016), MEXT (2015a), and MHLW (2015).
Note: Statistics on the number of children in kindergartens are as of May 1 in each year. Statistics on the population estimates and the number of children in day nurseries are as of October 1 in each year. Others include local-discretionary-type ECCE Centers, non-approved day nurseries, day nurseries in kindergartens, and family childcare businesses. Children enrolled in kindergarten-type ECCE centers are counted as being enrolled in kindergartens. Children enrolled in unified-type and day-nursery-type ECCE centers are counted as being enrolled in day nurseries.
Quality
As shown in Figure 6, the pupil-staff ratio in private kindergartens in Japan is significantly higher than that in public kindergarten. The average pupil-staff ratio in public versus private facilities in each prefecture shows a similar trend (Figure 7). With a few exceptions, most prefectures lie above the 45-degree line for kindergarten (Figure 7), which means that the pupil-staff ratio is higher in private kindergartens.
In contrast, the pupil-staff ratios of day nurseries are similar in public and private facilities (see Figure 6). However, Figure 7 shows that more prefectures have higher average pupil-staff ratios in private day nurseries, when large cities (namely, ordinance-designated cities and core cities) are excluded12. Figure 8 shows that the average pupil-staff ratio in public day nurseries is significantly higher in some large cities. Although this situation seems to vary more by prefecture for day nurseries, the pupil-staff ratio may be also higher in private facilities as in kindergartens in standard municipalities in Japan.
12In Japan, there are two categories of cities to which a part of the administrative work normally performed by prefectural governments are delegated. In descending order of the delegation level, they are: (1) ordinance-designated city (seirei shitei toshi) and (2) core city (chukaku toshi). A minimum requirement to become an ordinance-designated city or a core city is a population of 0.5 million or more and a population of 0.2 million or more, respectively. A third-rank category, called a special-case city (tokurei shi), existed until March 2015.
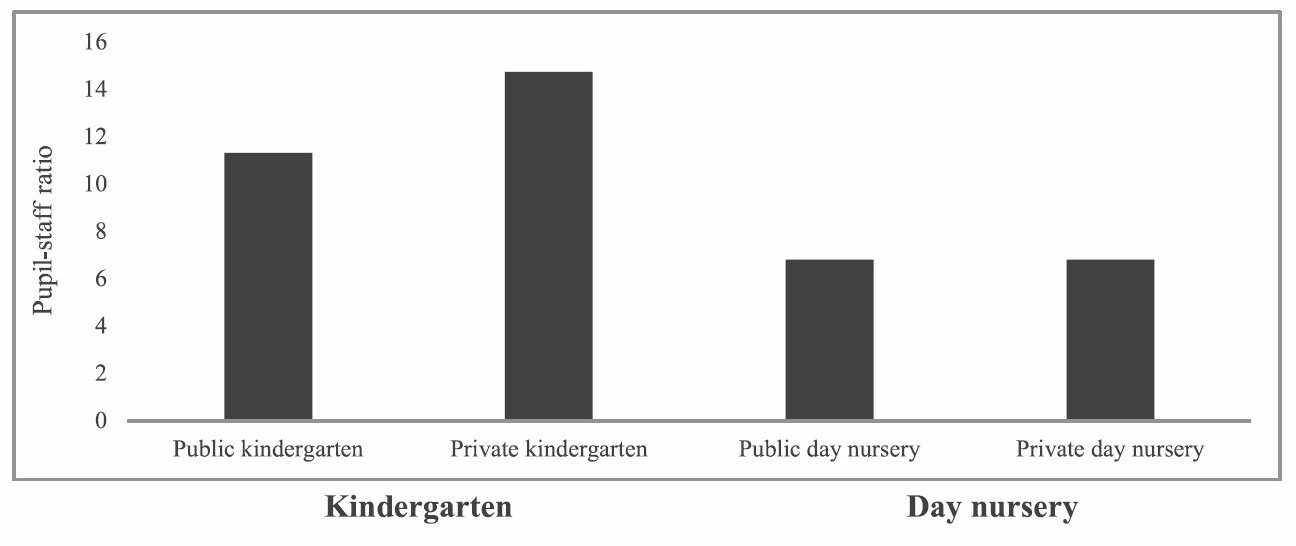
Figure 6. Pupil-staff ratio in ECCE facilities by facility type and ownership, 2014.
Source: Created by the author based on MEXT (2015b) and MHLW (2015).
Note: The number of children enrolled in the facility was divided by the number of full-time staff to calculate the pupil-staff ratio. Statistics on the number of pupils and teachers in kindergartens are as of April 1 in 2014. Statistics on the number of pupils and teachers in day nurseries are as of October 1 in 2014.
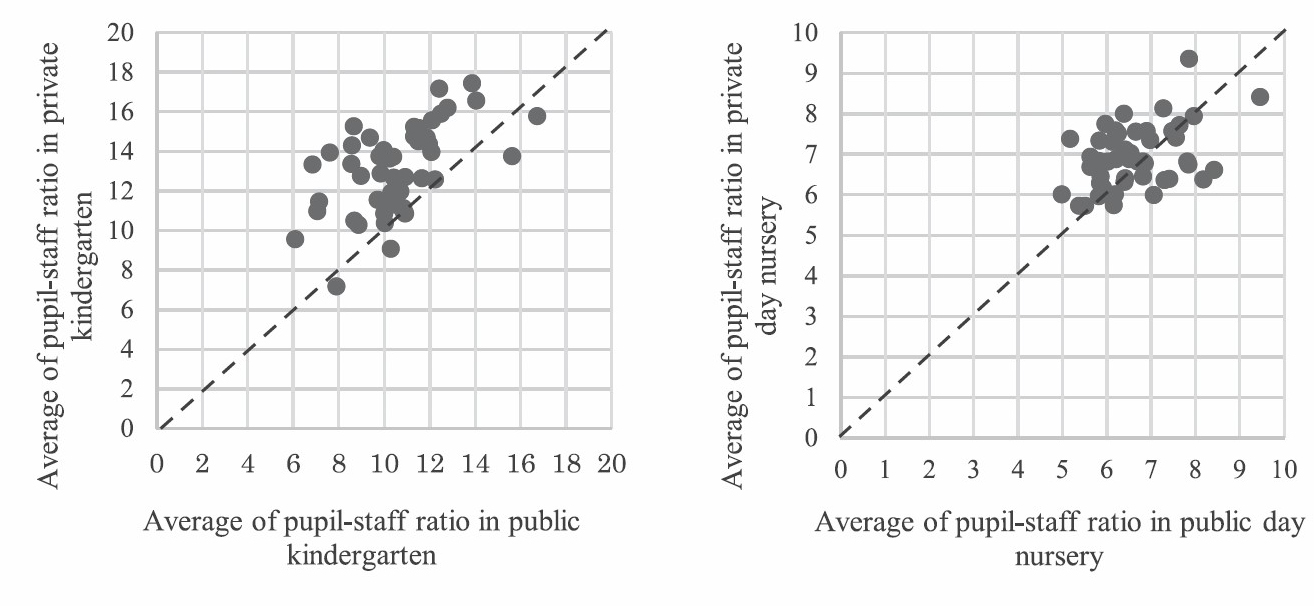
Figure 7. Pupil-staff ratio in private versus public ECCE facilities in prefectures, 2014.
Source: Created by the author based on MEXT (2015a) and MHLW (2015).
Note: Number of children enrolled in the facility was divided by the number of full-time staff to calculate the pupil-staff ratio. Statistics on the number of pupils and teachers in kindergarten is as of April 1 in 2014. Statistics on the number of pupils and staff in day nursery is as of October 1 in 2014. Coverage includes 47 prefectures in Japan. Average pupil-staff ratio in day nurseries was calculated using the number of pupils and staff in municipalities other than ordinance-designated cities and core cities in each prefecture.
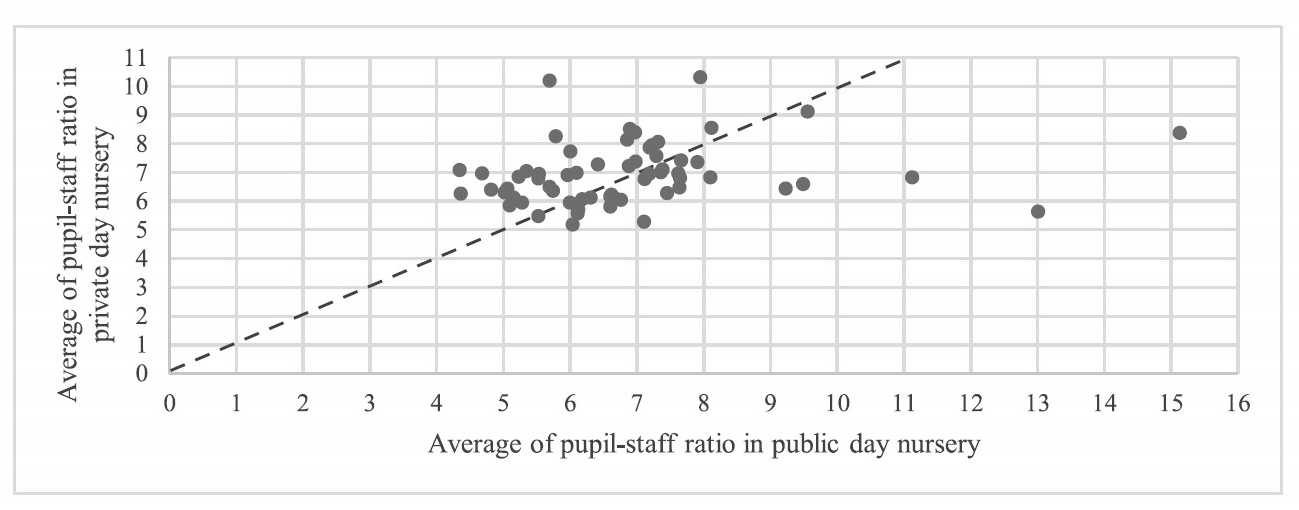
Figure 8. Pupil-staff ratio in private versus public day nurseries in ordinance-designated cities and core cities, 2014.
Source: Created by the author based on MHLW (2015).
Note: The number of children enrolled in the facility was divided by the number of full-time staff to calculate the pupil-staff ratio. Statistics on the number of pupils and staff in day nurseries is as of October 1 in 2014. Coverage includes 20 ordinance-designated cities and 44 core cities.
FUNDING OF EARLY CHILDHOOD CARE AND EDUCATION
Overview of public funding for kindergartens
In addition to expenditure for public kindergarten, government also pays to support private kindergartens where prefectures play a significant role. Moreover, the parents and guardians of children enrolled in private kindergartens are eligible to receive subsidies from the program ‘Subsidies for Parents/Guardians of Children Entering Kindergarten’ (Youchien Syuuen Syourei-hi Hozyokin) through municipalities. The central government covers around 20% of the budget for these subsidies, while municipalities cover the remainder. Each child’s subsidy is based on parental income, as well as the number of siblings. In general, parents and guardians receive larger subsidies, if they are poorer and have more children.
Taking all this into consideration, central, prefectural, and municipal governments in Japan share approximately 10%, 36%, and 54% of public expenditures on kindergartens, respectively, according to MEXT (n.d.). Around 79% and 21% of public expenditures come from supply-side and demand-side funding, respectively13. The level of public spending for public kindergartens (38%) is lower than the level for private kindergartens (62%). A more detailed breakdown, given in Table 1, shows that one-third of pub- lic expenditures for private kindergartens are spent through demand-side funding mechanisms, 80% of which is funded by municipalities.
13The amount of demand-side funding presented in Table 1 does not include child-support allowances (jidou teate), which are currently paid through the municipalities to all parents and guardians who have children until they complete lower secondary education (CO, 2015a). Two-thirds of this budget is covered by the central government, and the remaining third is covered by the local government.
Table 1. Breakdown of public expenditures for kindergartens by ownership, financial mechanism, and administrative level (in billions USD).
|
Source |
||||
|
|
Central |
Prefectural |
Municipal |
Total |
|
Supply-side funding |
|
|
|
|
|
Public kindergarten |
0.03 |
0.01 |
2.13 |
2.17 |
|
|
(1.3%) |
(0.5%) |
(98.1%) |
(100.0%) |
|
Private kindergarten |
0.31 |
2.02 |
0 |
2.33 |
|
|
(13.4%) |
(86.6%) |
(0.0%) |
(100.0%) |
|
Total |
0.34 |
2.03 |
2.13 |
4.50 |
|
|
(7.6%) |
(45.1%) |
(47.3%) |
(100.0%) |
|
Demand-side funding |
|
|
|
|
|
Public kindergarten |
0.00 |
0.00 |
0.00 |
0.00 |
|
Private kindergarten |
0.23 |
0.00 |
0.94 |
1.17 |
|
|
(19.7%) |
(0.0%) |
(80.3%) |
(100.0%) |
|
Total |
0.23 |
0.00 |
0.94 |
1.17 |
|
|
(19.7%) |
(0.0%) |
(80.3%) |
(100.0%) |
Source: Created by the author based on MEXT (n.d.).
Note: The amount of subsidies spent supporting private kindergartens is as of 2013. The amount of other expenses is as of 2011. Original expenditure data are provided in JPY. Values are converted to USD using PPP in 2012 from OECD (2016).
Breakdown of public funding for public kindergarten
Little data are available to determine the breakdown of actual public spending for day nurseries. However, MEXT has been collecting data on local governmental expenditure on the operation of public kindergartens, as well as its breakdown by the nature of spending. As shown in Figure 9, around two-thirds of public expenditures on public kindergarten was allocated for salaries in FY2014. Non-salary current and capital expenditures each accounted for 15% of public expenditures for public kindergartens. In addition, more than 90% of public expenditures for public kindergartens came from the municipality (Figure 10). Figure 10 shows that capital expenditures for public kindergartens are largely covered by local bonds (39.3%). The central government also contributes to capital expenditures for public kindergartens (13.5%).
Figure 11 shows that public spending per pupil for public kindergartens varies significantly. The amount of spending per pupil in Aomori prefecture is 2.6 times greater than that in Okinawa prefecture. Figure 11 also shows that the variation in amount can be mainly attributed to variation in the amount of public spending per pupil from municipalities. Municipalities incur most public expenditures for kindergartens, although the central government and prefectures also contribute, along with local bond financing that mainly support capital expenditures.

Figure 9. Public expenditures for public kindergartens by type, 2014.
Source: Created by the author based on MEXT (2016).
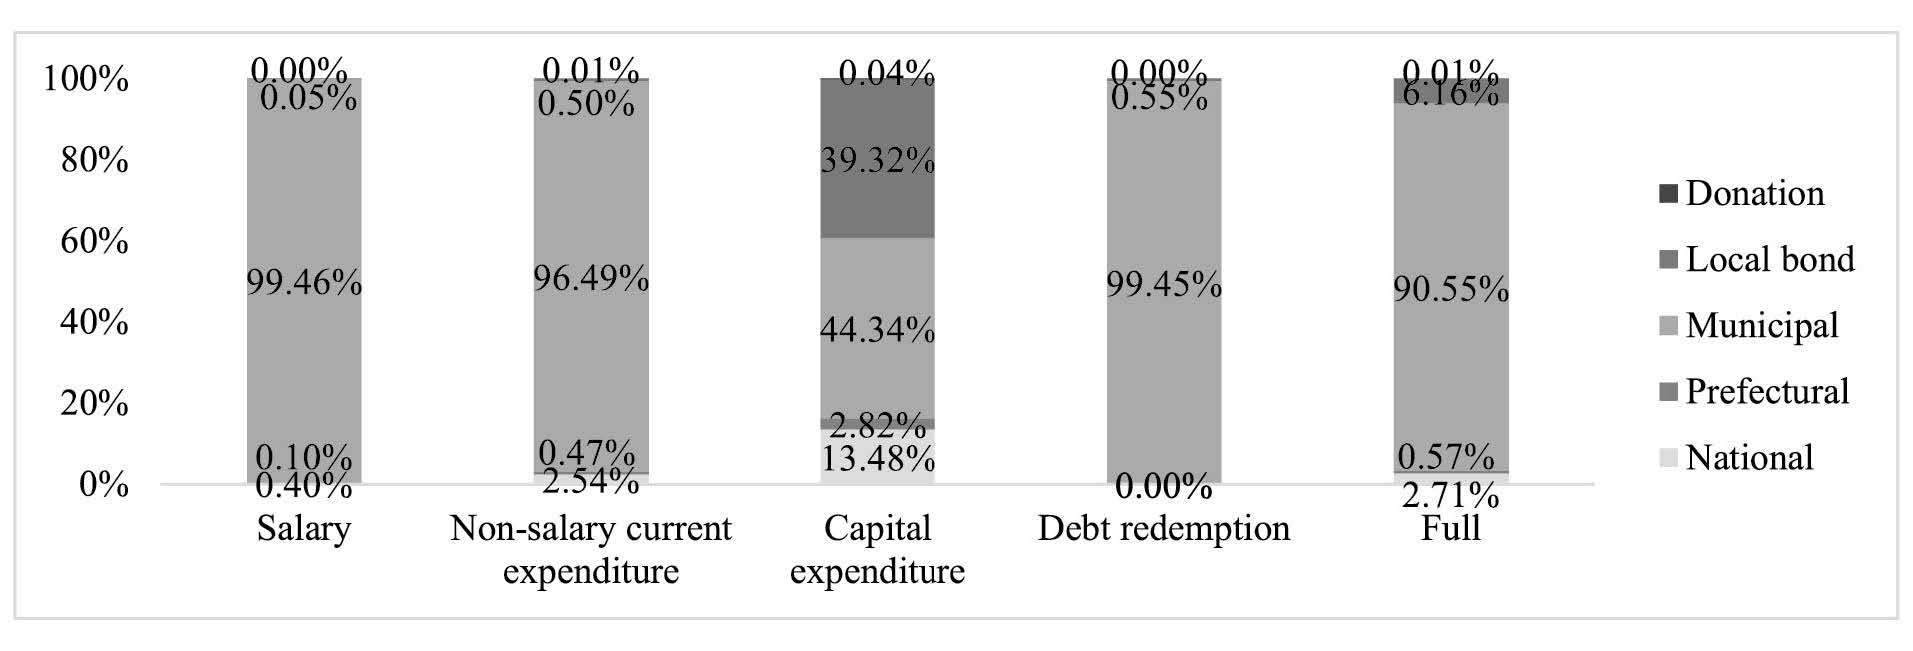
Figure 10. Public expenditures for public kindergartens from different levels of government, 2014.
Source: Created by the author based on MEXT (2016).

Figure 11. Public expenditures for public kindergartens per pupil by prefecture, 2014.
Source: Created by the author based on MEXT (2016).
Note: Original expenditure data are provided in JPY. Values are converted to USD using PPP in 2014 from OECD (2016).
Pearson’s product-moment correlation was run to assess how the level of public expenditures for public kindergartens per pupil is correlated with the characteristics of prefectures. As shown in Figure 12, the amount of spending per pupil and the number of children enrolled in public kindergarten moderately correlated (r(45) =-0.356, p < 0.02). This may imply that local government spending per pupil on public kindergartens grows as the number of enrolled children in public kindergartens falls.
Moreover, we may assume that the share of private kindergartens is small- er in prefectures with a larger commitment of the local government to providing ECCE services through public kindergartens. However, Pearson’s product-moment correlation shows a weak and positive correlation (r(45) = 0.262, p < 0.08) between the share of private kindergartens and public expenditure for public kindergartens per pupil (Figure 13). This may im- ply that, in the Japanese context, local governments spend more on public kindergartens if the private sector provides a larger share of ECCE services in the prefecture. The analysis also shows a strong negative correlation (r(45) = -0.638, p < 0.0001) between the pupil-staff ratio in public kindergartens and public expenditures for public kindergartens per pupil (Figure 14).

Figure 12. Public expenditures for public kindergartens per pupil and enrollment in public kindergartens by prefecture, 2014.
Source: Created by the author based on MEXT (2015a) and MEXT (2016).
Note: Original expenditure data are provided in JPY. Values are converted to USD using PPP in 2014 from OECD (2016).

Figure 13. Percentage of private kindergartens and public expenditures for kindergartens per pupil by prefecture, 2014.
Source: Created by the author based on MEXT (2015a) and MEXT (2016).
Note: Original expenditure data are provided in JPY. Values are converted to USD using PPP in 2014 from OECD (2016).
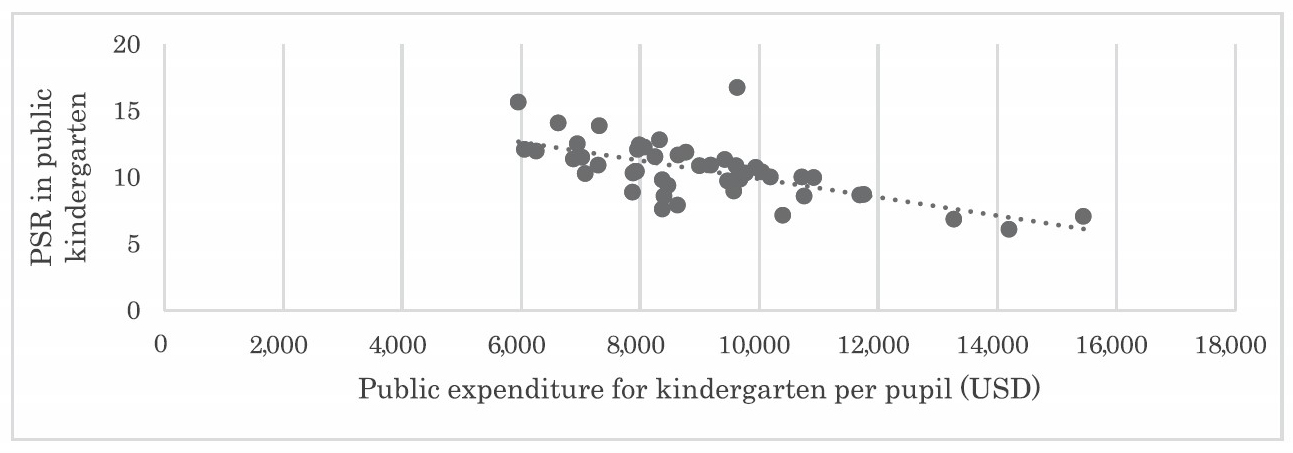
Figure 14. Pupil-staff ratio in public kindergartens and public expenditures for public kindergartens per pupil by prefecture, 2014.
Source: Created by the author based on MEXT (2015a) and MEXT (2016).
Note: Original expenditure data are provided in JPY. Values are converted to USD using PPP in 2014 from OECD (2016).
Difference in expenditure of public and private facilities
Actual expenditures at the facility level in both kindergartens and day nurseries are collected jointly in the facilities sampled by MEXT and MHLW. Figure 15 shows that the difference in current expenditures per pupil between public and private facilities is small. Private kindergartens spend a bit more than public ones, while public day nurseries spend a bit more than private ones. Figure 15 shows that public facilities can generally spend more on salaries.

Figure 15. Breakdown of current expenditures at the facility level per pupil by facility type and ownership, 2011.
Source: Created by the author based on MEXT and MHLW (2015).
Note: Original expenditure data are provided in JPY. Values are converted to USD using PPP in 2011 from OECD (2016).
Breakdown of household contribution Although scanty data on household spending for day nursery services are available, MEXT has been collecting data on household spending on education for children in kindergarten every second year. This dataset allows us to partly see how the level of household contribution for ECCE varies across different groups. The analysis shows that parents and guardians who send their children to private kindergartens pay much more than those who send their children to public kindergartens. As shown in Figure 16, annual household education expenditures for children in private kindergartens was USD 4,743 in FY 2014, which is more than twice the amount spent for children in public kindergarten. This significant gap may be mainly attributed to the gap in tuition fees. Figure 16 generally shows that household education expenditures for children in private kindergartens are greater in municipalities with larger populations. A similar trend is observed for children in public kindergartens. However, the correlation is weaker and the amount is the lowest for children in a designated city/special ward.
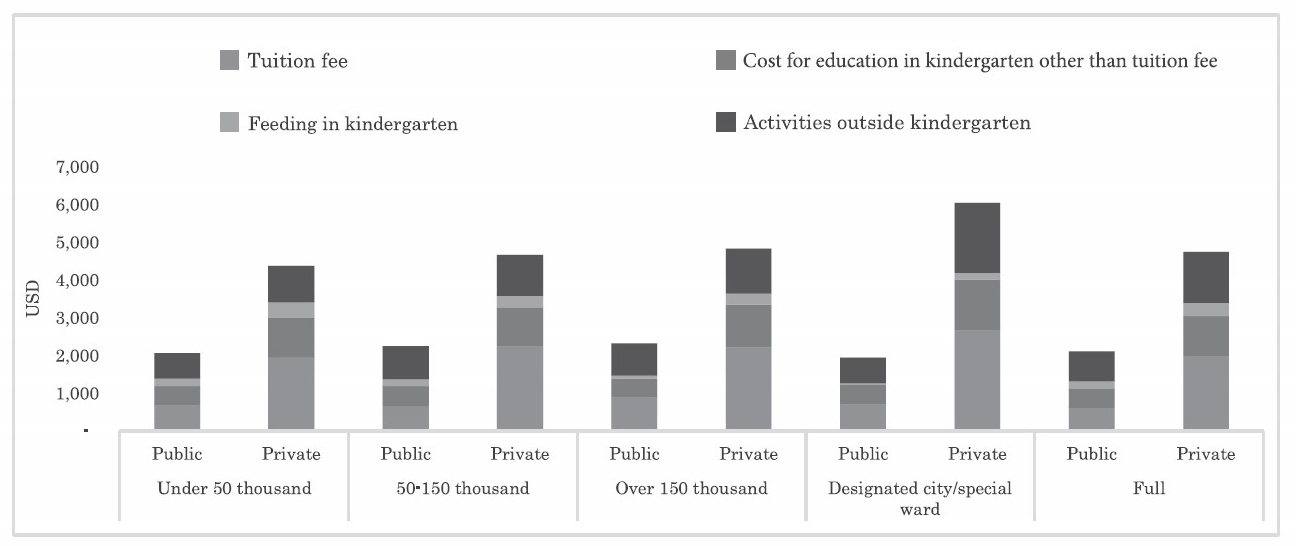
Figure 16. Annual household education spending for children in kindergartens by ownership and population size of municipality, FY2010 and FY2014.
Source: Created by the author based on MEXT (2015b).
Note: Original expenditure data are provided in JPY. Values are converted to USD using PPP in 2014 from OECD (2016).
DISCUSSION
The paper examined the Japanese ECCE system, with a special focus on its financing mechanisms, and analytically discussed its overall fiscal situation. The study showed that the level of public funding per pupil and the financial burden of the household differed among the various types of ECCE services in Japan, creating an inequality in the quality of ECCE services to which children have access. Although the government has made a significant effort to mitigate these gaps, combining various financing mechanisms, including demand-side financing, it appears difficult to change the overall trend, which potentially stems from a significantly low level of government commitment to developing the ECCE sub-sector.
An analysis of the breakdown of public funding confirms that most of its share is taken up by local government, especially municipalities.
Examining public spending on pub- lic kindergartens using available data, this study showed significant variation in the levels of public expenditure per pupil among different prefectures as a result of their highly decentralized financing schemes, although more detailed analyses are required to confirm this conclusion. This study showed that local governments generally spend more per child if the number of children in public facility in the area is less, which potentially widens the gap in the quality of facility. Evidence even showed that a greater share of private kindergartens may be related with greater per-pupil spending for public facilities.
Moreover, the analysis of the difference between public and private ECCE facilities showed that gaps remained in the quality of services between public and private facilities, although the government is providing notable support to reduce it through both supply-side and demand-side funding. The share of the private sector in providing ECCE services is increasing. Results of descriptive analyses showed that the pupil-staff ratio in kindergartens is generally higher in private than public kindergartens, although parents spend significantly more to send their children to private than public kindergartens. The results also showed that per-pupil spending on salary was generally higher in public than private facilities. A quality gap ex- isted between ECCE facilities in large cities with greater household contributions and those in other municipalities with lower household contributions.
Japan is currently in the midst of drastic reforms in ECCE policy to deal with recent rapid changes in socio-economic conditions. The new public financing scheme developed under the new system has several innovative features; these include standardizing financing mechanisms and user charges among various types of ECCE facilities, as well as providing financial support to small-scale childcare facilities and projects that are planned and implemented by local governments. Government’s effort to unify schemes of supply-side funding, albeit incomplete, is a positive step. In addition, because there is a gap in the quality of ECCE service between local governments as result of the highly decentralized funding mechanism, the government must be cautious in relying on small-scale facilities and projects managed by the municipalities to fill gaps in the supply of childcare facilities.
The interest in ECCE issues has been heightened in Japan by the long waitlists for day nurseries. Although solving this problem is critical, it is only one of several in the Japanese ECCE system. Further studies that use post-reform data will be critical for assessing whether the new public financing system can effectively deal with the issues identified in this paper. Moreover, this paper does not capture the entire picture of ECCE financing, due to a shortage of data, mainly from day nursery systems. Further research is required to analyze these data, which include various indicators of quality of service and cover all types of ECCE facilities.
REFERENCES
Bennet, J. (2008). Early Childhood Services in the OECD Countries: Review of the Literature and Current Policy in the Early Childhood Field. Innocenti Working paper No. 2009-01. Florence, Italy: UNICEF Innocenti Research Centre.
Bennet, J. (2010). Investing in Early Childhood Education and Care: Some Policy Implications. In International Encyclopedia of Education. 3rd ed, edited by Penelope Peterson, Eva Baker and Barry McGaw, 55-62. Oxford, UK: Elsevier.
Blau, D., & Currie, J. (2006). Pre-School, Day Care, and After-School Care: Who’s Minding the Kids? In Handbook of the Economics of Education, edited by Eric A. Hanushek and Finis Welch, vol. 2, 1163-1278. Amsterdam, Netherlands: Elsevier.
Cleveland, G., & Krashinsky, M. (2009). The Nonprofit Advantage: Pro- ducing Quality in Thick and Thin Child Care Markets.Journal of Policy Analysis and Management, 28(3): 440-462.
CO (Cabinet Office). (2014). White Paper on Children and Young People 2014. Tokyo: CO.
. (2015a). Heisei 27 nendo yosan no gaiyou [Summary of the Budget for the Fiscal Year 2015]. Retrieved from http://www8.cao.go.jp/shoushi/budget/pdf/budget/27_yosangaiyou.pdf (Accessed January 19, 2016)
.(2015b). Kodomo kosodate shien shin seido nitsuite [Summary of the Comprehensive Support System for Children and Child-Rearing]. Retrieved from http://www8.cao.go.jp/shoushi/shinseido/outline/ pdf/setsumei.pdf (Accessed March 14, 2016).
. (2015c). Nintei kodomo-en no kazu nitsuite [About the Number of Centers for Early Childhood Education and Care]. Retrieved from http:// www.youho.go.jp/press150508.html (Accessed September 12, 2015).
CO (Cabinet Office), MEXT (Ministry of Education, Culture, Sports, Science and Technology), and MHLW (Ministry of Health, Labor and Welfare). (2014). Information Booklet: The Comprehensive Support System for Children and Child-Rearing. Tokyo: CO.
Denboba, A., Elder, L., Lombar- di, J., Rawlings, L., Sayre, R., & Wodon, Q. (2014). Stepping up Early Childhood Development: In- vesting in Young Children for High Returns. Washington, DC: World Bank.
Havnes, T., & Mogstad, M. (2009). No Child Left Behind: Universal Child Care and Children’s Long- Run Outcomes. Discussion Papers 582. Oslo, Norway: Statistics Norway.
. (2011). No Child Left Behind: Subsidized Child Care and Children’s Long-Run Outcomes. American Economic Journal: Eco- nomicEconomicPolicy, 3(2): 97-129. https:// doi.org/10.1257/pol.3.2.97
Heckman, J., & Masterov, D. (2007). The Productivity Argument for Investing in Young Children. Review of Agricultural Economics, 29(3): 446-493.
Ikemoto, M. (2011). Keizai seichou senryaku toshite chumoku sareru youji-kyouiku hoiku seisaku: Syo- gaikoku no doukou wo chushin ni [Early Childhood Education and Care Policy as an Economic Growth Strategy: World Trends in ECEC Policy Reform]. Journal of Educational Sociology, 88: 27-45.
. (2013). Youji kyouiku hoiku bunya eno kabushiki-gaisya sannyuu wo kangaeru: Shyogaikoku no doukou wo fumaete [A Study on the Entry of Stock Companies into Early Childhood Educa- tion and Care: Comparison with Other Countries]. Japan Research Institute Review, 4(5): 54-87.
. (2015). Kodomo kosodate shien shin-seido ni okeru kuni no yakuwari [Roles of the State in the Comprehensive Support System for Children and Childcare]. Japan Research Institute Review, 3(22): 2-26.
. (2016). Hoiku no shitsu no kouzyou nimuketa kansa/hyouka no arikata [Monitoring and Evaluation for Improving the Quality of Child Care]. Japan Research Institute Review, 13 (32): 1-27.
Iwatate, K. (2015). Current Issues in ECEC Teacher Education in Japan. In Early Childhood Education in Three Cultures: China, Japan and the United States, edited by Lian Huo, Susan B. Neuman, and Atsushi Nanakida, 111-125. Heidelberg, Germany: Springer. https://doi.org/10.1007/978-3- 662-44986-8_8
Izumi-Taylor, S., Samuelsson, I.P., & Rogers, C.S. (2010). Perspectives of Play in Three Nations: A Comparative Study in Japan, the United States, and Sweden. Early Childhood Research and Practice, 12(1): 1-12.
Kaga, Y., Bennett, J., & Moss, P. (2010). Caring and Learning Together: A Cross-national Study on the Integration of Early Childhood Care and Education within Education. Paris, France: UNESCO.
Kaga, Y., Barnett, S., & Bennett, J. (2012). Integration and Coordination of Early Childhood Care and Education in the Republic of Korea. International Journal of Child Care and Education Policy, 6(2): 1-20.
Kamerman, S., & Gatenio-Gabel, S. (2007). Early Childhood Education and Care in the United States: An Overview of the Current Policy Picture. International Journal of Child Care and Education Policy, 1(1): 23-34. https://doi.org/1007/ 2288-6729-1-1-23
Kim, G.J., & Umayahara, M. (2010). Early Childhood Care and Education: Building the Foundation for Lifelong Learning and the Future of the Nations of Asia and the Pacific. International Journal of Child Care and Education Policy 4(2): 1-13.
Kimata, A., & Kaneko, Y. (2015). Latest Development of Japanese Kindergarten Education Policy. In Early Childhood Education in Three Cultures: China, Japan and the United States, edited by Lian Huo, Susan B. Neuman, and Atsushi Nanakida, 61-81. Heidel- berg, Germany: Springer. https:// doi.org/10.1007/978-3-662-44986-8_5
Kobe University. (2016). Asia-Pacific Regional Report: Financing for Eary Childhood Care and Education (ECCE). Paris, France: UNESCO.
MEXT (Ministry of Education, Culture, Sports, Science and Technology). (n.d). Wagakuni no kyoiku zaisei nit suite [Education Finance in Japan]. Retrieved from http://www.kantei.go.jp/jp/singi/kyoui-kusaisei/bunka/dai3/dai1/siryou4. pdf (Accessed August 25, 2016)
. (2015a). Gakkou kihon chousa [School Basic Survey].Retrieved from http://www.mext.go.jp/b_menu/toukei/chousa01/kihon/ 1267995.htm (Accessed January 13, 2016).
. (2015b). Kodomo no gakusyu-hi chousa [Survey for Household Expenditure on Children’s Educa- tion]. Retrieved from http://www.mext.go.jp/b_menu/toukei/chou- sa03/gakushuuhi/1268091.htm (Accessed August 25, 2016).
. (2016). Chihou kyouiku-hi chousa [Survey for Local Education Expenditure]. Retrieved from http://www.mext.go.jp/b_menu/ toukei/001/index05.htm (Accessed August 25, 2016).
MEXT (Ministry of Education, Culture, Sports, Science and Tech- nology) and MHLW (Ministry of Health, Labor and Welfare). (2015). Youchien hoikusyo tou no keieijittai chousa kekka [Results of Survey for Management Status of Kindergartens and Nursery Centers]. Tokyo: MEXT and MHLW.
MHLW (Ministry of Health, La- bor and Welfare). (2015). Shakai hukushi shisetsu tou chou- sa [Survey of Social Welfare Fa- cilities]. Retrieved from http:// www.mhlw.go.jp/toukei/list/23-22.html (Accessed January 13, 2016).
. (2016). Hoikusyo-tou kanren jyoukyou torimotome [Summary of the Situation of Day Nursery]. Retrieved from http://www.mhlw. go.jp/stf/houdou/0000098531. html (Accessed September 25, 2016).
MIC (Ministry of Internal Affairs and Communications) Bureau of Statistics. (2016). Population Estimates. Retrieved from http://www.stat.go.jp/english/data/jin- sui/2.htm (Accessed January 13, 2016).
Nanakida, A. (2015). Early Childhood Education and Care Curriculum in Japan. In Early Childhood Education in Three Cultures: China, Japan and the United States, edited by Lian Huo, Susan B. Neuman, and Atsushi Nanakida, 25-39. Heidelberg, Germany: Springer. https://doi.org/ 10.1007/978-3-662-44986-8-2
NIER (National Institute for Educational Policy Research). (n.d.) New Trends in Preschool Education and Childcare in Japan: Transition to ‘Comprehensive Support System for Children and Child-Rearing’. Retrieved from http://www.nier.go.jp/English/ education japan/pdf/201503NT- PECJ.pdf (Accessed September 11, 2015).
OECD (Organisation for Economic Co-operation and Development). (2006). Starting Strong II: Early Childhood Education and Care. Paris: OECD.
. (2012). Quality Matters in Early Childhood Education and Care: Japan 2012. Paris: OECD.
. (2014). Education at a Glance 2014: OECD Indicators. Paris: OECD.
. (2015). OECD Family Database. Retrieved from http://www.oecd.org/social/family/database. htm (Accessed September 12, 2015).
. (2016). OECD. Stat. Retrieved from http://stats.oecd.org/ (Accessed August 25, 2016).
Schweinhart, L., Montie, J., Xiang, Z., Barnett, W., Belfield, C., & Nores, M. (2005). The High/Scope Perry Preschool Study through Age 40. Ypsilanti, MI: High/Scope Press.
UNESCO (United Nations Educational, Scientific and Cultural Organization). (2006). EFA Global Monitoring Report 2007. Strong Foundations: Early Childhood Care and Education. Paris, France: UN- ESCO.
. (2015). Incheon Declaration: Education 2030: Towards Inclusive and Equitable Quality Education and Lifelong Learning for All. Paris, France: UNESCO.
. (2016). Global Education Monitoring Report 2016. Education for People and Planet: Creating Sustainable Futures for All. Paris, France: UNESCO.
APPENDIX
Table A1. Basic information on ECCE facilities in Japan.
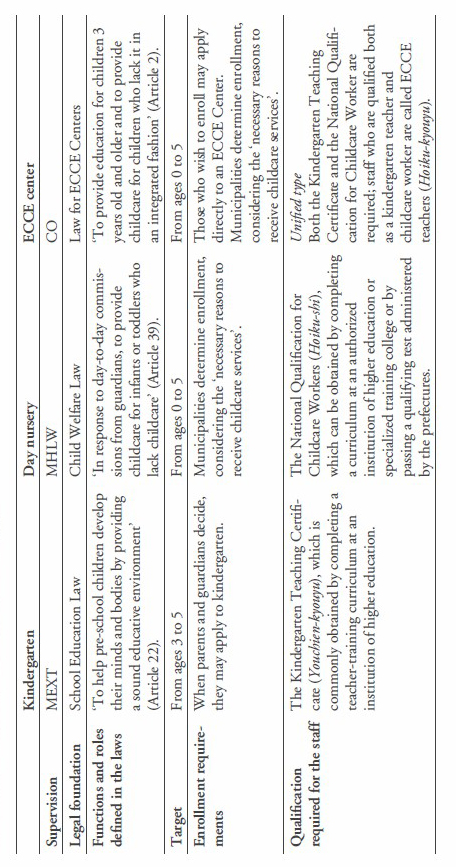
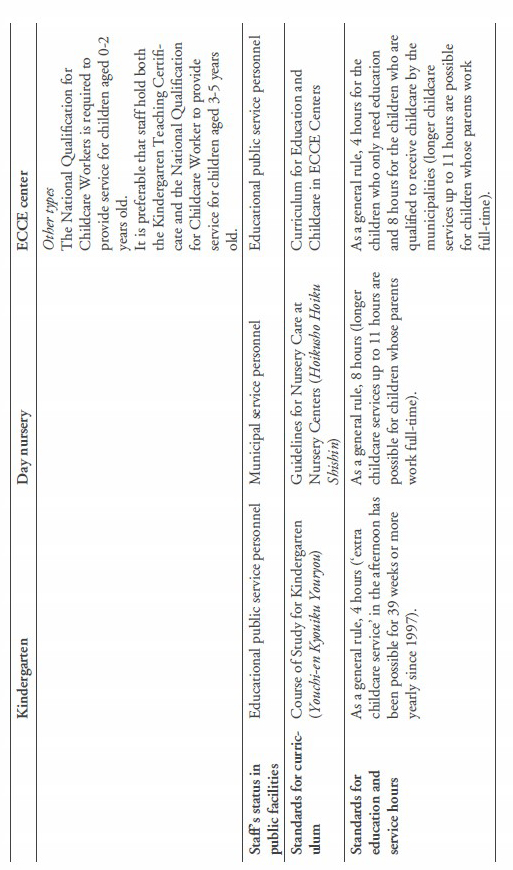

Source: Created by the author based on CO (2015b) and NIER (n.d.).
Note: The Law for ECCE Centers is a shortened version of the name of the law, the Act Concerning the Promotion of a Comprehensive Provision of
Education and Care for Children before Entry into Primary School. The Kindergarten Teaching Certificate has three types: (1) Advanced (master’s degree); 2) Type I (bachelor’s degree); and (3) Type II (junior college associate’s degree). With an exemption, ECCE Centers established before CSSCC are allowed to continue under the previous standards, in which the children-staff ratio for children who only need education cannot exceed 35. The standard for the ratio of 3-year-old children to staff in newly established ECCE Centers is 15.
Table A2. List of reasons necessitating childcare services in Japan.
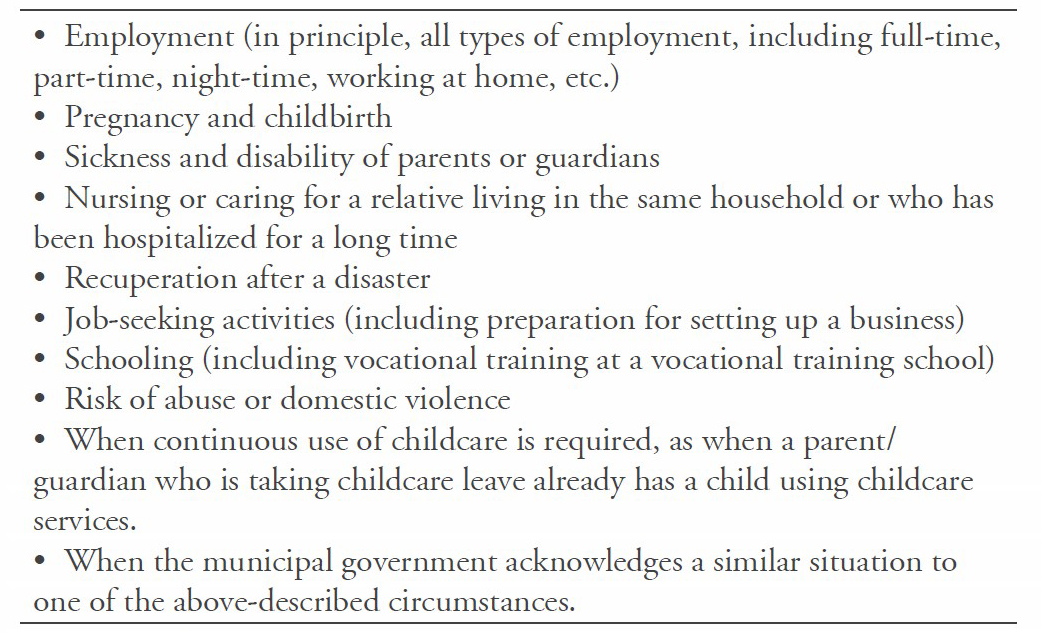
Source: Created by the author by adopting CO, MEXT, and MHLW (2014).
Note: “When a relative who lives in the same household can look after the child concerned, the priority for using childcare services may be adjusted accordingly” (CO et al., 2014).
