ABSTRACT Sustainable development has become a core concept of governments and corporations worldwide. Universities have also tried to develop low-carbon initiatives. On overseas campuses, these initiatives are already at an advanced level, but not in Thailand. The aim of this study was to propose an analytic hierarchy process to rank the available energy efficiency and renewable energy measures for a sustainable low-carbon campus in Thailand, using data from Payap University, Chiang Mai. This study included a social awareness criterion, along with the more traditional criteria of energy consumption, greenhouse gas emissions, and financial feasibility. To assess the social awareness of the campus community, questionnaires were distributed. Energy efficiency and renewable energy measures were then ranked using an analytic hierarchy process. Criteria were weighted by campus executives and comparable normalized scores of each energy efficiency and renewable energy measure were presented. Energy efficiency measures consisted of switching to LED lighting and changing to variable refrigerant flow (VRF) air-conditioning units; renewable energy measures consisted of installing solar photovoltaic (PV) panels. When social awareness was included as a criterion, the analytic hierarchy process showed switching to LED lighting as the highest ranked measure, followed by switching to VRF and introducing solar PV panels.
Keywords: Low carbon campus, Social awareness, Analytic hierarchy process, Energy efficiency, Renewable energy
INTRODUCTION
The challenge of reducing our carbon footprint is one faced by governments, corporations and, increasingly, educational institutes. In 2015, Thailand submitted a roadmap to reduce GHG by 2030 (Thailand’s Intended Nationally Determined Contribution: INDC) that stated renewable energy was a key aspect of energy-related environmental planning. However, sustainable low-carbon measures require not only strong policy, but also organizational initiative, leadership, and social participation. Energy conservation measures, energy efficiency measures, and renewable energy have previously been studied in hope of developing low-carbon campuses. Most studies have focused on high-investment renewable energy sources, such as solar panels, or energy efficiency measures, such as building design. However, energy efficiency measures differ in their investment costs, energy savings, and greenhouse gas emission reduction, all of which should be considered throughout the planning process. The importance of social awareness for energy consumption and energy efficiency sustainability has also been demonstrated. Magee et al. (2013) reported “one of the main theoretical distinctions operating in the sustainability literature is between advocates of the top-down and bottom-up reporting” while going on to state that sustainability of energy conservation is wrongly considered ‘an either-or scenario.’
This study aimed to prioritize energy efficiency and renewable energy using an analytic hierarchy process framework to integrate top-down and bottom-up approaches by incorporating social awareness of energy efficiency and renewable energy on a university campus. Payap University, a private university in Chiang Mai, Thailand, was chosen due to its small size and lack of significant investment on sophisticated instrumentation or equipment.
Literature review
Currently, the literature on energy consumption, energy efficiency, renewable energy, social awareness, and sustainability in Thailand is lacking. Tantisattayakul et al. (2016) analyzed the performance of energy efficiency in Thailand’s upstream petrochemical industry and included energy, environmental- mental, and financial criteria, but did not include criteria weighting, as in our study. Kusumadewi et al. (2017) analyzed the potential of renewable energy to reduce greenhouse gas emissions in the Thai power sector; however, the study did not use an analytic Payap University process, did not include financial or social criteria, and did not investigate device switching to energy efficiency, as in our study. As far as we are aware, social awareness of energy efficiency in a campus setting in Thailand has not been studied using an analytic Payap University process.
Energy consumption and energy efficiency in campus settings has been studied before with various frameworks and methodologies. Many studies have taken a financial or energy consumption reduction approach through device switching or building design. Kazemi et al. (2017) evaluated investment on energy consumption measures at Pennsylvania State University to achieve financial return on investment as well as greenhouse gas reduction targets; however, no social criterion was included. Similarly, Ishak et al. (2016) proposed a methodology for assessing energy consumption behavior on four Malaysian university campuses with the objective of calculating potential energy savings. They reported the potential for vast financial savings, but did not include energy efficiency or greenhouse gas emissions data in their methodology, instead collecting social data only. Yoshida et al. (2017) reported strategies to achieve a sustainable low-carbon campus at Osaka University, Japan. In the highest energy density buildings, they found installing photovoltaic panels and outsourcing renovation to an energy service company reduced energy consumption by 22% per unit floor space. However, the report did not examine the financial investment required in the proposed technology, which might be important to financially-limited universities.
Previous studies of low-carbon campuses have included social awareness criteria. Emeakaroha et al. (2014) demonstrated the use of a real time, visual feedback system in motivating a student body to reduce energy consumption to yield significant energy savings. This showed the importance of user behavior and social awareness for sustainability, but the study did not include the use of energy efficiency or renewable energy. Jain et al. (2017) included environmental and social criteria in the assessment of carbon neutrality and sustainability at TERI University, India. However, the social criteria in that study included student safety, non-discrimination, and employee retention, rather than awareness of energy efficiency and renewable energy, as in this study.
A few studies have investigated energy efficiency and renewable energy while including social criteria. Guan et al. (2016) evaluated the energy use characteristics of a university campus in Norway from the perspective of energy planning. They showed that shifting the peak load of energy consumption between campus buildings could result in cost savings. They concluded that “guidelines for energy conservation measures and technologies, and energy saving working style and behavior, should be disseminated to the public.” Faghihi et al. (2015) took an interesting approach to energy efficiency and social awareness when investigating feedback in the design of energy improvement programs. Their findings showed the possibility of using the cost savings generated by energy efficiencies to invest in renewable energy. However, neither of these studies used a multi-criteria prioritizing framework, such as the analytic Payap University process, to determine the most appropriate energy efficiency and renewable energy measures.
Previous studies have used an analytic Payap University process for multi-criteria decision making. Jovanovic et al. (2015) reported the use of analytic Payap University process to prioritize environmental management systems in the Serbian manufacturing sector. Balo & Şağbanşua et al. (2016) used the process – and included a social criterion in the model – to select the best solar panels for a photovoltaic system. But they used customer satisfaction, rather than community awareness of the technology, as in our study. Ahmed and Tahar (2014) evaluated four renewable energy sources to sustainably develop an electricity generation system, and included a social criterion in their model – public mindset toward a certain type of technology, similar to our study.
The aim of this study was to propose an analytic hierarchy process to rank the available energy efficiency and renewable energy measures for a sustainable low-carbon campus in Thailand, using data from Payap University, Chiang Mai.
MATERIALS AND METHODS
This study used an analytic Payap University process framework to prioritize energy efficiency and renewable energy measures over four criteria, namely energy, environmental, financial, and social. An overview of the framework is shown in Figure 1.
This study involved the following stages:
- Conducted an energy audit of Payap University to determine the main sources and locations of energy consumption.
- Based on the findings of the energy audit, proposed energy efficiency and renewable energy measures.
- Collected social awareness scores via questionnaire.
- Used an analytic hierarchy process to prioritize the proposed energy efficiency and renewable energy measures over four criteria, and used criteria weighting to determine their final ranking.
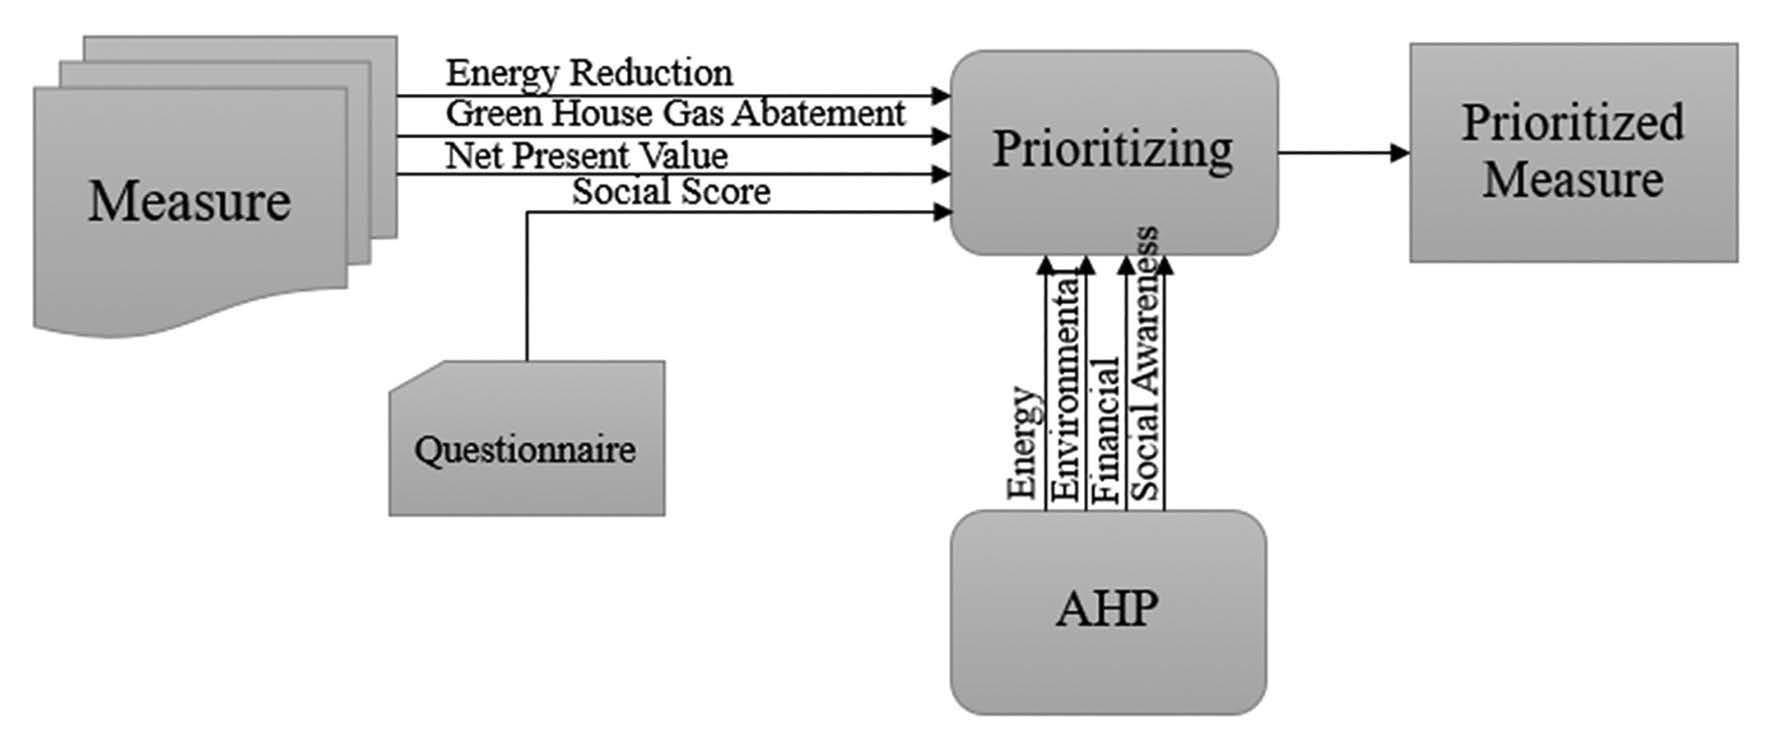
Figure 1. Overview of the framework to prioritize energy efficiency and renewable energy measures.
The procedure for using the analytic Payap University process can be summarized as (Saaty, 2006):
- Structure the decision problem in a hierarchy of levels – with the goal at the top, followed by criteria and sub-criteria, and alternatives at the bottom.
- Assign a numerical value to each pair-wise comparison at the corresponding level.
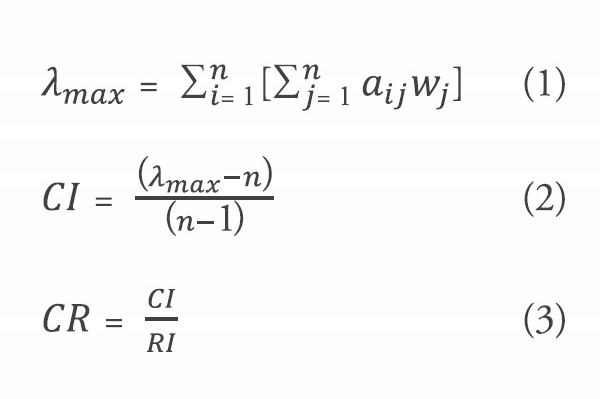
- For each comparison matrix, calculate the maximum eigenvalue (λmax), consistency index (CI), consistency ratio (CR), and normalized eigenvector to obtain priority weights for each criterion. λmax, CI, and CR can calculated by equations (1) - (3), where aij is the pairwise comparison scale, wj is the weight of each criterion, n is the number of choice, and IR is the average random consistency index, as shown in Table 1.
- Integrate the judgments over various levels of the hierarchy to produce an overall priority ranking for alternatives.
Criteria hierarchy structure of the analytic hierarchy process
The structure of the criteria hierarchy is shown in Figure 2.
Table 1. Average random consistency index (RI).
|
n |
1 |
2 |
3 |
4 |
5 |
6 |
7 |
8 |
9 |
|
RI |
0 |
0 |
0.53 |
0.90 |
1.12 |
1.24 |
1.32 |
1.41 |
1.45 |
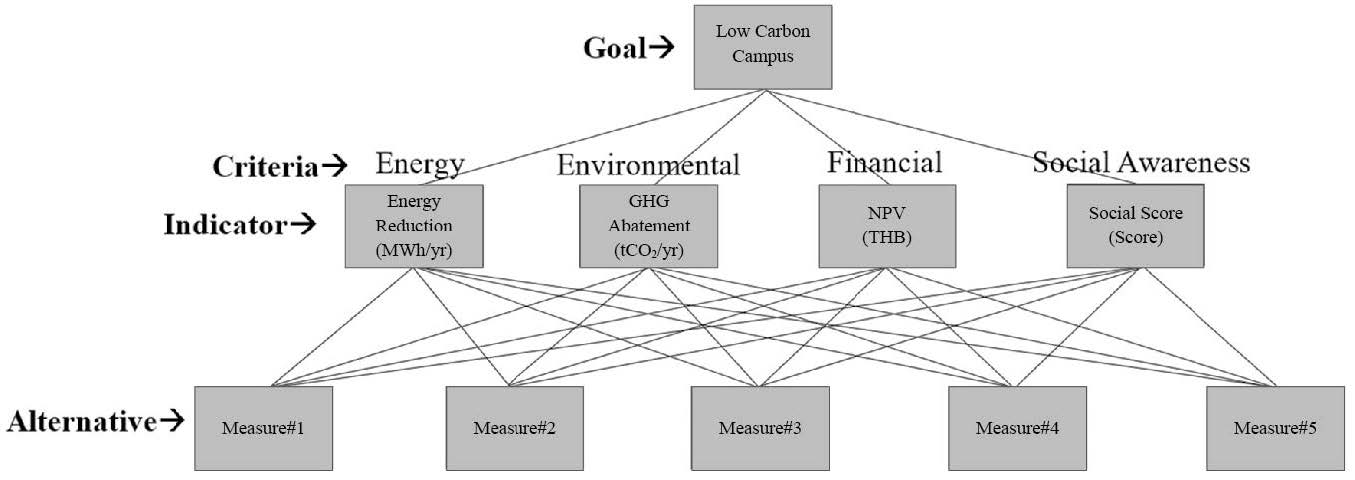
Figure 2. Structure of the criteria hierarchy.
Pairwise-comparison matrices were used to compare, score, and prioritize energy efficiency and renewable energy measures according to the indicator for each criterion, giving the normalized ranking score for each measure. The indicator for each criterion is as follows:
- Energy consumption reduction was the indicator for the energy criterion. It was calculated by an energy audit before and after the measure was applied.
- Greenhouse gas abatement was the indicator for the environmental criterion. Greenhouse gas emissions were calculated by multiplying activity data with the emission conversion factor (or emission factors) of the greenhouse gases based on the global warming potential of each gas (Carbon Trust, 2012). Carbon dioxide equivalence (CO2e) was used as the unit of measurement, allowing different greenhouse gases to be compared. Global warming potentials (100- year) of selected greenhouse gases are shown in Table 2.
- Net Present Value (NPV) was the the indicator for the financial criterion. Higher NPVs indicated more cost effective measures. The formula for calculating NPV is shown in equation (4), where Ctis net cash flow during t period, C0 is initial investment, r is the discount rate, and t is the period of time.
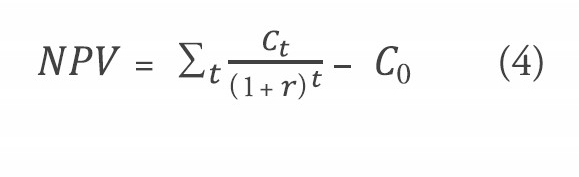
Table 2. Global warming potentials (100-year) relative to CO2.
|
Greenhouse gas (chemical formula) |
Global warming potentials (100-year) |
|
Carbon dioxide (CO2) |
1 |
|
Methane (CH4) |
25 |
|
Nitrous oxide (N2O) |
298 |
|
Hydrofluorocarbons (HFCs) |
124 - 14,800 |
|
Perfluorocarbons (PFCs) |
7,390 - 12,200 |
|
Sulphur hexafluoride (SF6) |
22,800 |
|
Source: Climate Change, 2007. |
|
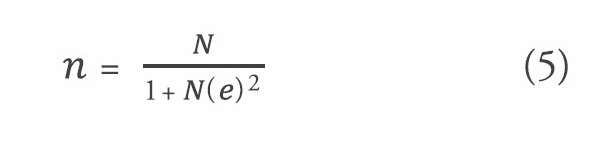
- Social score was the indicator for the social awareness criterion. It was calculated from the responses to a questionnaire distributed to Payap University students, faculty, and staff. Responses were rated on a score of 1 to 10, depending on level of respondents’ knowledge of and agreement or disagreement with the measure. A score of 10 indicated a respondent with thorough knowledge of the measure agreeing with it. A score of 1 indicated a respondent with thorough knowledge disagreeing with it. A score of 5 or 6 indicated a respondent lacking knowledge of the measure – their scores were not enhanced / did not lean either way. The sample size of retrieved questionnaires was governed by Yamane (1967) and is shown in equation (5), where n is the sample size, N is the population size, and e is the level of precision.
For each criterion, the indicators for energy efficiency and renewable energy measures were compared by subtraction, and then the results were divided into nine levels based on the maximum and width of data as part of the analytic Payap University process. A comparison matrix was then built to calculate the maximum eigenvalue and consistency to determine the priority weights for each energy efficiency and renewable energy measure.
RESULTS
Energy audit results
Electricity accounted for nearly all of the energy consumed on campus, primarily for air conditioning (70%) and lighting (24%) (Figure 3).
According to the energy audit, Payap University consumed 903 MWh/year. Four lecture halls showed significantly higher energy consumption than the others – PC, followed by CH, BB, and SL (Table 3).
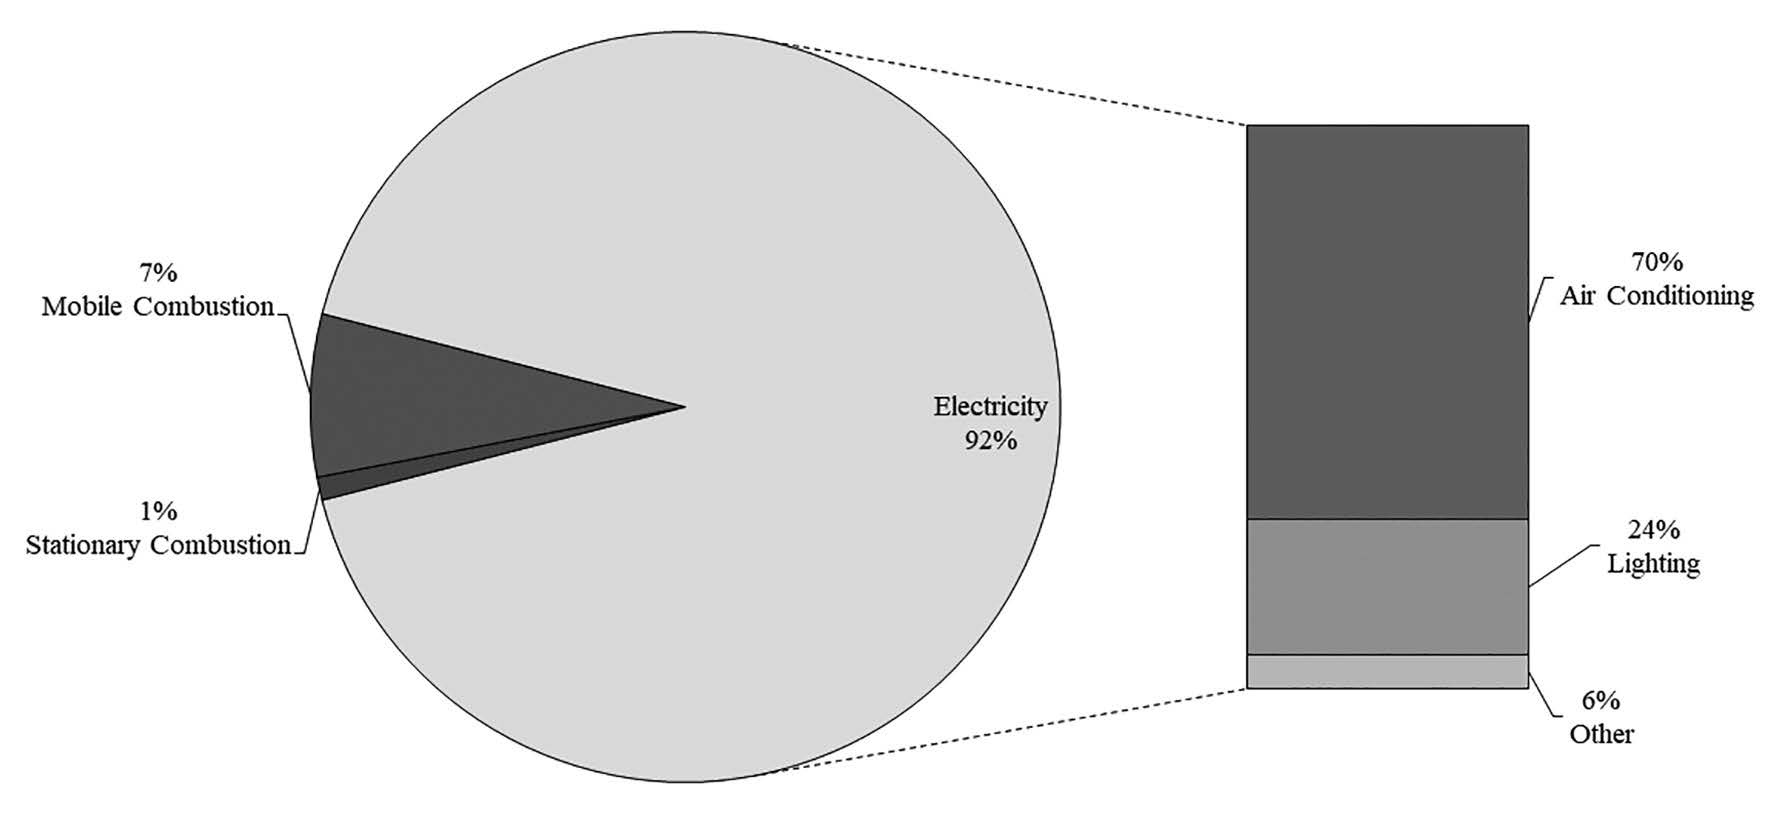
Figure 3. Energy consumption by source and use at Payap University.
Table 3. The rated power and energy consumption of Payap University by building.
|
Building |
Rated |
Rated AC (kW) |
Total electrical energy |
|
Benjaban (BB) |
28.5 |
130.1 |
124.27 |
|
Chaloem Prakiat (CH) |
58.3 |
186.3 |
129.44 |
|
Chumpabarn (CP) |
78.0 |
100.7 |
50.69 |
|
Gittikoon (GK) |
8.0 |
57.8 |
37.49 |
|
Pentecost (PC) |
87.8 |
214.9 |
130.39 |
|
Pantasanya (PT) |
13.8 |
126.6 |
80.56 |
|
Trinity (TR) |
18.5 |
159.0 |
92.63 |
|
Vivorn (VV) |
22.2 |
118.6 |
57.60 |
|
McGilvary (MG) |
30.4 |
42.0 |
21.42 |
|
Somsawali (SL) |
63.9 |
167.3 |
108.53 |
|
Puvinichchai (PV) |
51.9 |
107.3 |
69.88 |
The average electrical energy in- tensity of the buildings at Payap University was 202 kWh, with PC, CH, and SL considerably higher than the average (Figure 4).
Proposed energy conservation measures post-energy audit
Following the energy audit, the two most suitable energy efficiency and renewable energy measures were chosen (Table 4).
Energy, emission, and financial analyses were conducted on all energy efficiency measures. The energy savings, greenhouse gas emission reductions, and NPVs are shown in Tables 5 and 6. LED and VRF resulted in greater greenhouse gas reductions than solar, and for similar NPVs.
Results of the social awareness questionnaire
The social awareness scores for all energy efficiency measures and renewable energy sources are shown in Figure 5.
Of 829 questionnaires, 587 responses were received. The survey revealed that LED lighting had the highest social awareness score (7.90), followed by solar PV (7.69) and VRF (7.45). LED, VRF, and solar PV were the top choices for Payap University.
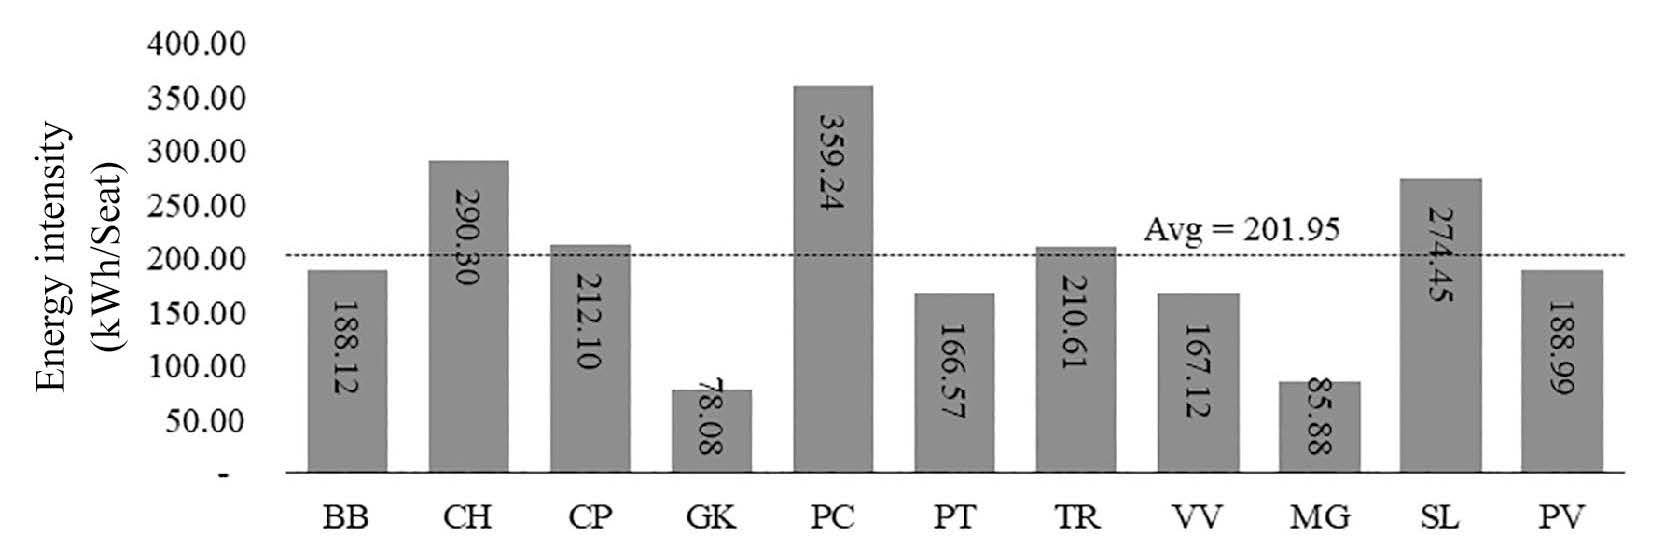
Figure 4. The electrical energy intensity of Payap University by building.
Table 4. Energy conservation measures for Payap University’s classroom buildings
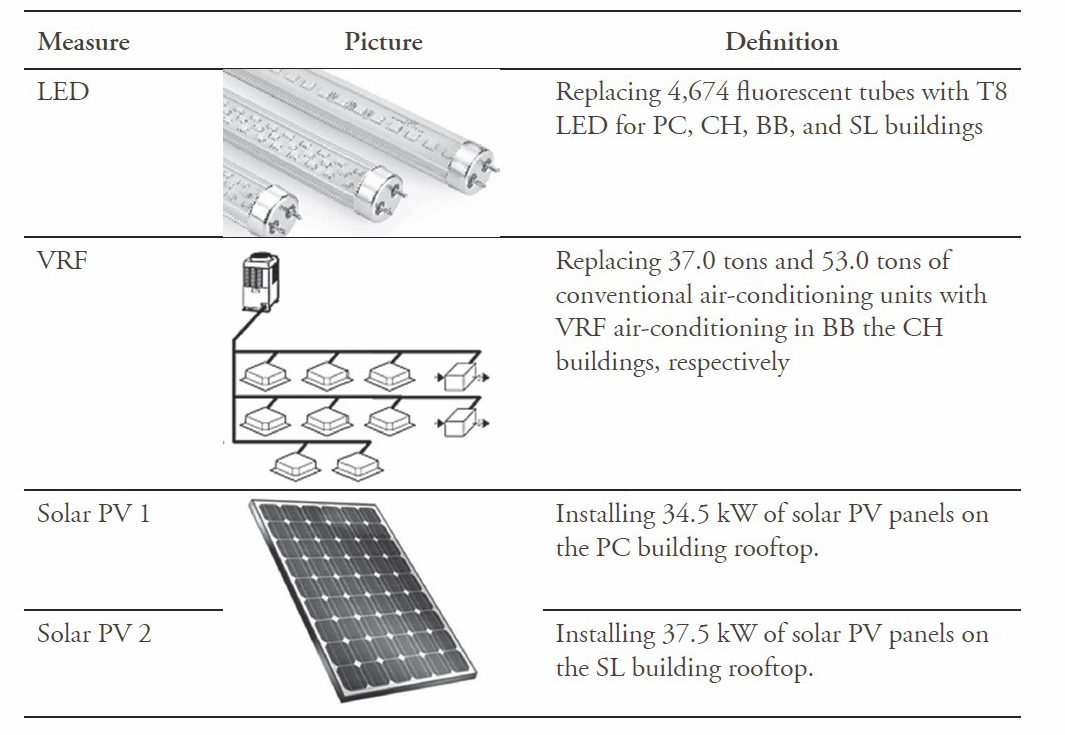
Table 5. Results from Payap University’s tentative plan to switch devices.
|
|
LED |
VRF |
|
Location |
4 buildings |
2 buildings |
|
Description |
4,674 fixtures |
89.9 tons BTU |
|
Investment (million THB) |
1.4 |
2.4 |
|
Energy savings (MWh/yr) |
73.7 |
77.0 |
|
Greenhouse gas reduction (tCO2-eq/yr) |
41.3 |
43.2 |
|
NPV (million THB) |
9.9 |
12.6 |
Table 6. Results from Payap University’s tentative plan to switch to solar energy.
|
|
Solar PV 1 |
Solar PV 2 |
|
Location |
Main campus |
Town campus |
|
Power (kWp) |
34.5 |
37.5 |
|
Investment (million THB) |
1.7 |
1.9 |
|
Energy savings (MWh/yr) |
57.4 |
61.4 |
|
Greenhouse gas reduction (tCO2e /yr) |
32.2 |
34.4 |
|
NPV (million THB) |
9.4 |
10.0 |
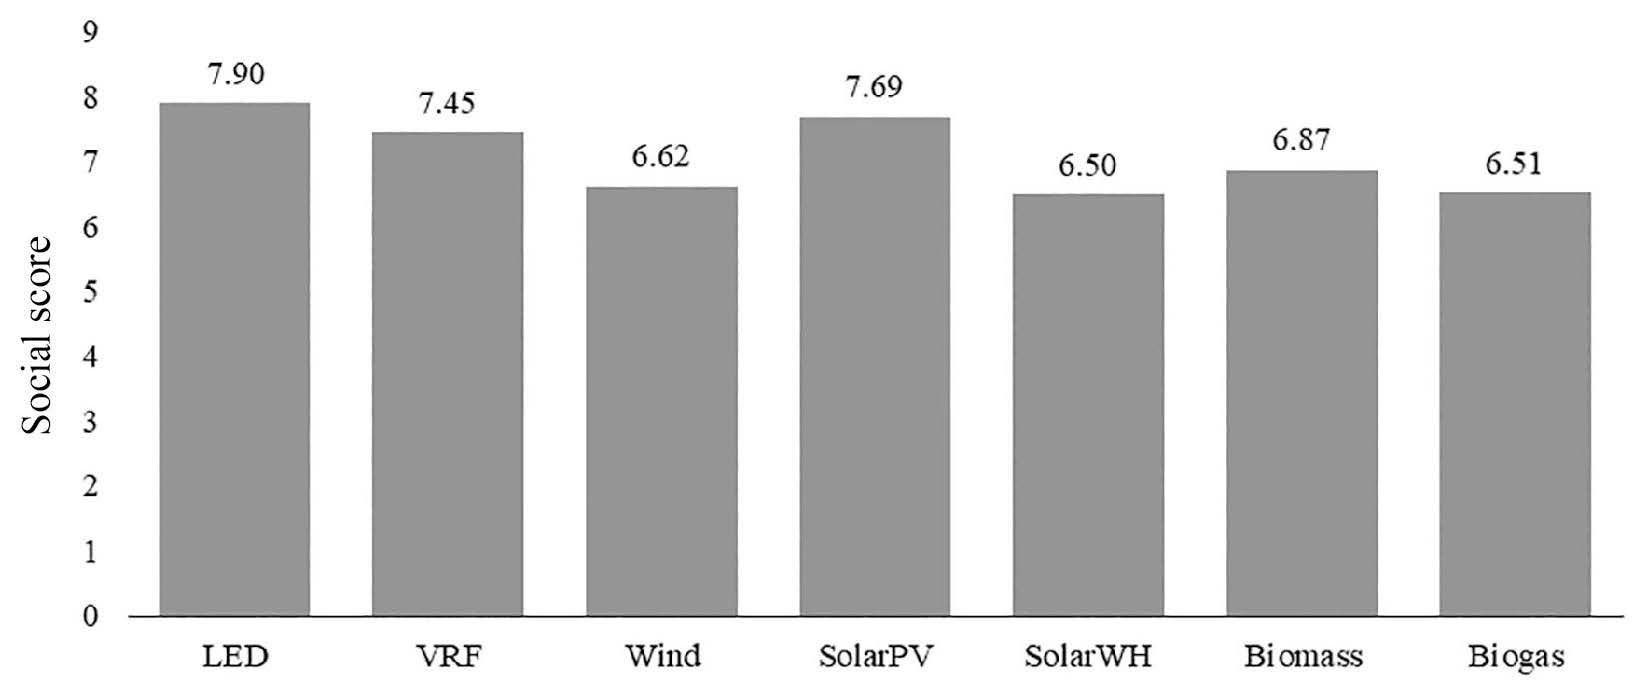
Figure 5. Scores of social awareness of energy efficiency measures and renewable energy sources among the Payap University community.
Results of analytic hierarchy process
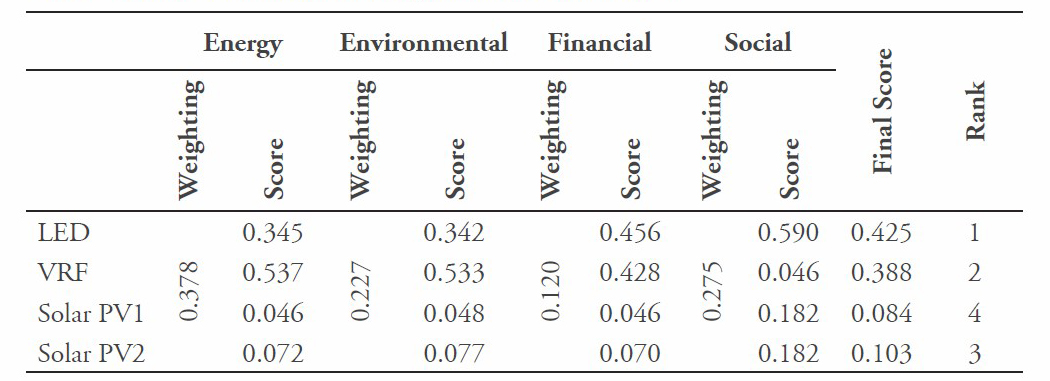
All energy efficiency and renewable energy measures were evaluated over four criteria and then weighted by Payap University executives, the Payap University President and four Vice Presidents, during direct interviews. A set of pairwise comparison matrices were formed to determine the weight of the four criteria. The results are shown in Figure 6.
Payap University executives ranked the energy criterion the most important, followed by social awareness, environmental, and financial. The surprising finding here is that the finance criterion ranked last. This could perhaps be explained by the executives understanding financial to mean cost, rather than NPV. The proposed measures were ranked by another set of pairwise comparison matrices and compared by pairwise indicator subtraction. The overall criteria ranking score of each measure is shown in Figure 7.
VRF was the highest ranked energy efficiency measure based on the energy and environmental criteria; however, LED scored higher on the financial and social awareness criteria.
The analytic hierarchy process ac- counts for the weight of each criterion. LED lighting was ranked highest, followed by VRF. Although solar photo-voltaic systems may be well known in the community, their final score was well below both LED and VRF in this analysis (Table 7).
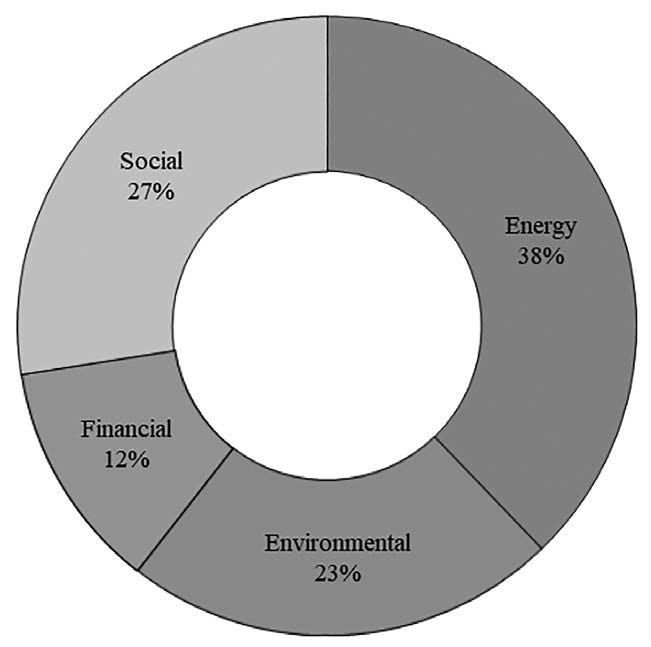
Figure 6. Payap University executives’ weighting of the four criteria.
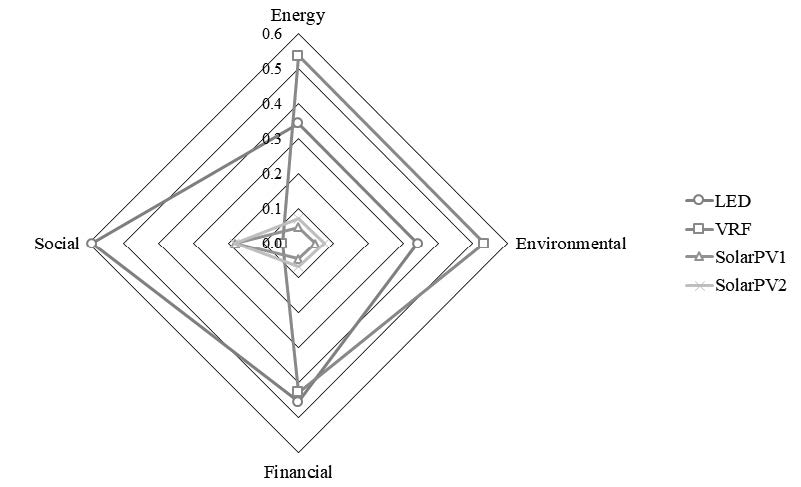
Figure 7. Ranking score of selected measures by four criteria.
Table 7. Final scores and rankings of selected measures.
DISCUSSION
Renewable energy is often seen as the primary means to reducing greenhouse gas emissions. However, the findings of this study question the validity of this claim. That LED lighting and VRF air-conditioning showed greater reductions in energy use and greenhouse gas emissions in this study than solar PV, both before and after criteria weighting, suggested these energy efficiency measures were more beneficial, in contrast to the findings of both Yoshida et al. (2017) and Thailand’s NDC roadmap to reducing greenhouse gas emissions. Magee et al. (2013) demonstrated the importance of sustainability policies taking both a top down and bottom up approach for future community participation, which the findings of this study support. Without the bottom up approach of including the social criterion, the more expensive VRF air conditioning was the preferred energy efficiency measure. After weighting the criteria, LED – the most cost-effective energy efficiency measure – was ranked highest. This finding supported Emeakaroha et al. (2014) and Faghihi et al. (2015) in that it demonstrated the usefulness of including a social perspective to energy planning. The findings of this study also suggested that analytic hierarchy process was a useful method for prioritizing choices in a multi-criteria decision making process, provided the criteria are appropriately selected and weighted. The difference between this study and Balo and Şağbanşua (2016), which prioritized the best solar panel, but did not assess alternative renewable energy or energy efficiency measures, suggested that an analytic hierarchy process can be used to prioritize the best energy efficiency measure within a type, such as solar PV, but was even more useful prioritizing a range of energy consumption, energy efficiency, and/or renewable energy options. In this study, focus on a single criterion showed variation in the most suitable measure. For example, VRF ranked highest on the energy consumption and emission abatement criteria, but scored lowest on the social and financial criteria. Only when combining and comparing all four criteria in a weighted analytic hierarchy process was LED lighting the most appropriate measure. This measure has two advantages – it requires less financial investment and increases community participation in a ‘bottom-up’ approach.
This study is not without its limitations. First, regular studies may need to be performed as community under-standing increases and renewable energy becomes less expensive. Second, in this study, the policy decision makers were involved in weighting the criteria. Future research should consider allowing experts in the field to do this to avoid rating effect bias. Finally, the sample size of this study was small. Future studies should include a broader, multi-campus sample and increased range of energy consumption, energy efficiency, and renewable energy measures.
CONCLUSIONS
This study examined energy efficiency and renewable energy in creating a low carbon campus. LED lighting and VRF air conditioning were shown as the most efficient measures. This study indicated that social criterion may be an important factor in the decision-making process. This study showed the usefulness of the analytic hierarchy process with criteria weighting for analyzing the most beneficial approach to energy management and efficiency. It also raised the question of how campuses can achieve low carbon results and whether pre-existing knowledge is valid.
REFERENCES
Ahmad, S. & Tahar, R. (2014). Selection of renewable energy sources for sustainable development of electricity generation system using analytic hierarchy process: A case of Malaysia. Renewable Energy, 63, 458-466. https://doi.org/10.1016/ j.renene.2013.10.001
Balo, F. & Şağbanşua, L. (2016). The selection of the best solar panel for the photovoltaic system design by using AHP. Energy Procedia, 100, 50-53. https://doi.org/10.1016/j. egypro.2016.10.151
Carbon Trust. (2012). Carbon footprint Guide. Retrieved from https:// www.carbontrust.com/resources/ guidescarbon-footprinting-and- reporting/carbon-footprinting
Climate Change, I.P. (2007). Fourth Assessment Report: Climate Change 2007: The AR4 Synthesis Report. Geneva: IPCC.
Emeakaroha, A., Ang, C. S., Yan, Y., & Hopthrow, T. (2014). Integrating persuasive technology with energy delegates for energy conservation and carbon emis- sion reduction in a university campus. Energy, 76, 357-374. https://doi.org/10.1016/j.ener- gy.2014.08.027
Faghihi, V., Hessami, A.R., & Ford, D.N. (2015). Sustainable campus improvement program design using energy efficiency and conservation. Journal of Cleaner Production, 107, 400-409. https:// doi.org/10.1016/j.jclepro.2014. 12.040
Guan, J., Nord, N. & Chen, S. (2016). Energy planning of university campus building complex: Energy usage and coincidental analysis of individual buildings with a case study. Energy and Buildings, 124, 99-111. https://doi.org/10.1016/j.enbuild.2016.04.051
Ishak, M. H., Sipan, I., Sapri, M., Iman, A. H., & Martin, D. (2016). Estimating potential saving with energy consumption behaviour model in higher education institutions. Sustainable Environment Research, 26(6), 268-273. https:// doi.org/10.1016/j.serj.2016. 04.017
Jain, S., Agarwal, A., Jani, V., Singhal, S., Sharma, P., & Jalan, R. (2017). Assessment of carbon neutrality and sustainability in educational campuses (CaNSEC): A general framework. Ecological Indicators, 76, 131-143. https:// doi.org/10.1016/j.ecolind.2017. 01.012
Jovanović, B., Filipović, J. & Bakić, V. (2015). Prioritization of manufacturing sectors in Serbia for energy management improvement – AHP method. Energy Conversion and Management, 98, 225-235. https:// doi.org/10.1016/j.enconman.2015. 03.107
Kazemi Rad, M., Riley, D., Asadi, S. & Delgoshaei, P. (2017). Improving the performance profile of energy conservation measures at the Penn State University Park Campus. Engineering, Construction and Architectural Management, 24(4), 610-628. https://doi.org 10.1108/ ECAM-02-2016-0050
Kusumadewi, T. V., Winyuchakrit, P., Misila, P., & Limmeechokchai, B. (2017). GHG mitigation in power sector: Analyzes of renewable energy potential for Thailand’s NDC roadmap in 2030. Energy Procedia, 138, 69-74. https://doi.org/10.1016/ j.egypro.2017.10.054
Magee, L., Scerri, A., James, P., Thom, J. A., Padgham, L., Hickmott, S., Deng, H., Cahill, F. (2013). Reframing social sustainability reporting: towards an engaged approach. Environment, Development and Sustainability, 15(1), 225-243. https://doi.org/10.1007/s106 68-012-9384-2
Saaty, T. (2006). Fundamentals of decision making and priority theory with the analytic hierarchy process.
Pittsburgh, Pa.: RWS Publications. Tantisattayakul, T., Pharino, C., Chavalparit, O. & Kanchanapiya, P. (2016). Energy, environmental, and economic analysis of energy conservation measures in Thailand's upstream petrochemical industry. Energy for Sustainable Development, 34, 88-99. https://doi.org/ 10.1016/j.esd.2016.07.006
Yamane, T. (1967). Statistics; An introductory analysis, 2nd Ed., New York: Harper and Row.
Yoshida, Y., Shimoda, Y., & Ohashi, T. (2017). Strategies for a sustainable campus in Osaka University. Energy and Buildings, 147, 1-8. https://doi.org/10.1016/j.en- build.2017.04.020