ABSTRACT The advent of technological progress has rapidly transformed the world in both positive and negative ways. Asia is one of the regions where technology and innovation have tangibly influenced lives and societies. Although the impact of technology is vast, previous studies have focused heavily on growth and productivity, with the effect on inequality underexplored. This paper examines the relationship between Internet penetration, measured by the number of Internet users per 100 persons, and income inequality using the Gini Index. While emphasizing the Asia Pacific, the econometric analysis used panel data from 191 countries around the world from 1990 to 2015. The empirical results suggested that the effects for developed and developing countries varied. Internet use in more developed countries was associated with a higher reduction in the Gini Index (lower inequality) compared to their developing counterparts. Internet penetration in the Asia Pacific did not improve inequality, although Internet use in developed Asia harmed income equality less than in developing Asia.
Keywords: Internet penetration, Income inequality, Technology, Econometrics, Asia
INTRODUCTION
Asia has grown rapidly and near constantly over the past several decades. Asia’s share in world GDP in real USD Purchasing Power Parity (PPP) has increased sharply from 23.2 percent in 1990 to 38.8 percent in 2014 (Barua, 2015). Despite a slight dip recently, the ADB (2016) estimated that developing Asia will continue to contribute 60% of world growth. While scholars have identified many determinants of economic growth and development, this paper will focus on one – the role of technology, specifically the Internet.
Technology has been a key driver of economic growth worldwide. In the most fundamental sense, economic output can increase in two ways – increase inputs or increase the amount of output from any given input, the latter of which can be achieved through technological innovation (Rosenburg, 2014). While the economy grows and the ‘pie’ gets bigger, the ‘pie’ is not necessarily shared equally. The potential inequality as a result of technology has been one of the most prominent arguments against technological innovation. Therefore, this paper aims to conduct a critical review of the adverse effects of technological progress on the issue of equality in developing Asia. The implication of this research is not meant to, and would not be able to, change the force of technology on our society, but rather to find ways in which the most number of groups in society can gain access to and reap the benefits of technological innovation.
Technological progress: the case for Asia
Technology and innovation driven changes are clearly visible in Asia, with many countries no longer adopters of technologies from developed countries, like the European nations, the United States, and Japan, but now technology innovators. East Asia has been the most successful region in the developing world in adopting technologies from the innovating economies. This has much to do with the initiative of East Asia to establish institutions that are both flexible and quick in adopting technological innovation from abroad. An example is the creation of special economic zones, export processing zones, science parks, and other institutional arrangements to attract foreign investments in the field of technology and innovation. Overall, technology diffused rapidly to Asia. It has narrowed the income gap between some Asian economies and those in the developed world. However, the diffusion of technology may not narrow the income gap within each country in Asia (Sachs & McArthur, 2002).
Literature review
Starting in the mid-1990s, studies on access to computers and information technology (IT) began to explore their transformative effects, socially and economically, on developed economies (MacDougald, 2011). Despite the abundant literature on the determinants of economic growth, information and communication technology (ICT) has not been included and discussed until quite recently. Acemoglu et al. (2001) and Rodrik et al. (2004) pointed to institutional quality as a critical determinant of economic development, but did not touch upon technological factors.
The international development literature has argued and proven empirically that the Internet is a driver of economic growth, although the early focus was primarily on developed countries (Guerriero, 2015). Dalburg (2013) examined the impact of the Internet in African countries, whose annual growth rate of mobile Internet was more than 80% between 2010 and 2013, and found that the Internet increased productivity and opportunities, and contributed to the continent’s GDP. With specific reference to developing countries, a macro-level econometric analysis conducted by the World Bank (2009) found that a 10% increase in broadband and a 10% increase in wireline Internet penetration were associated with a 1.4% and a 1.1% increase in GDP growth, respectively.
Previous studies in the economic development literature on the effects of Internet use on economic develop-ment place much emphasis on income growth, or productivity (MacDougald, 2011). However, economic development is a broader concept than that. Therefore, this paper attempts to shed light on the effect of Internet use on income distribution, another essential development indicator that has been under-explored, with a particular focus on developing countries in Asia. Gulati (2008) touched on the inequality issue by arguing that investment in ICT infrastructure for educational purposes may only benefit wealthy people in low-income countries, and argued in favor of basic educational infrastructure instead. However, this effect relates only to education, while the Internet might affect inequality through multiple channels and mechanisms.
Many scholars have suggested various channels through which the Internet could open doors to equal opportunities that may eventually create a more inclusive growth, although at the same time it could further polarize or widen the gap between the rich and the poor. The Internet is a general-purpose technology that affects society through a wide range of activities (Harris, 1998). For instance, firms are able to communicate better, faster, and at lower costs, reducing internal and external transaction costs, thereby lowering production costs, enhancing productivity, and generating economic growth. The Internet facilitates the generation and spread of knowledge and new ideas tremendously, which increases research productivity and the diffusion of its products and outcomes (Meijers, 2012). For these reasons, it is intuitive to assume that the Internet will positively affect the economic growth of a country. However, it has not been clearly proven whether the Internet further divides the income gap or creates more opportunities for lower-income populations.
On the one hand, it is convincing to argue that the Internet opens doors of opportunities to many poor people. Coyle & Williams (2016) believe that the Internet could lead to a more equal society, because it creates opportunities for people in marginalized groups or those with low income or status, especially in emerging markets. The Internet could also enable individuals and new businesses to tap into new unexplored opportunities (Coyle & Williams, 2016). Beyond the economic and business realms, the Internet has the potential to bridge the gap between the powerful and the powerless. A number of research studies stated that the Internet fostered civic participation, creating transparency, and therefore reducing power differentials (Blundo et al., 1999; Feezell et al., 2016; and Internet World Stats). As political and social power is often tied to business and economic power in most societies, it could be concluded that the Internet could reduce income inequality through mechanisms of political and social power.
On the other hand, capital-intensive businesses can reap much benefit from the Internet. Low-skilled jobs may be replaced with technology. The Internet may also remain inaccessible for the poorest of groups in developing countries. Therefore, the overall effects of the Internet on equality are unclear and fully deserve further investigation and discussion. This will, hopefully, be the main contribution of this paper.
While technological innovation has the potential to make society more equal, several scholars in the field have looked at the adverse impact of technology on equality issues. More specifically, it is worth exploring through which channels technology affects income distribution. Lansing and Markiewicz (2011) studied the impact of technology diffusion on income inequality by focusing on two channels: labor income and capital income. Their study found that from the welfare analysis, capital owners largely benefited from technological change, but workers, on the other hand, gained from technological change at a lower level. Some scholars have also raised an important point that the effect of technology on the income gap depends largely on the notion of technology-skill complementarity (Acemoglu, 2003). Technological change may favor workers that are more skilled, substitute tasks previously done by unskilled workers, and eventually lead to job polarization between the low skilled and high skilled. Some studies believe that the ICT revolution is the key explanatory factor of inequality. The IMF (2007) found that technological progress had a greater impact on inequality within countries than what globalization has done.
Mark Warschauer from the University of California, Irvine, defined ‘digital divide’ as social stratification due to unequal ability to access, adapt, and create knowledge via use of information and communication technologies. He points to several components that constitute digital inequality, by referring to the unequal access and usage of the Internet, and other factors such as education, language, and content.
Hypothesis
While the Internet, no doubt, has the potential to create opportunities for anyone in any corner of the world; considering the stage of development in developing countries in Asia, Internet users in those countries may not be ready to make the most of what the Internet has to offer. This paper aims to test the hypothesis that Internet penetration takes time to bring about an inclusive growth in developing economies. This hypothesis is supported by theories in digital divide and digital literacy that it is not only the access to the Internet that matters, but also the literacy and skills required for using the Internet optimally.
While different scholars define digital literacy differently, it is commonly agreed that digital literacy refers to literacy events and practices that involve digital technologies as well as those that may involve non-digital practices, such as reading, writing, and multimodal meaning-making, and that digital literacy may even include socio-emotional skills. As this paper uses macroeconomic data drawn from countries and not individuals, digital skills and literacy cannot be measured directly, but will be proxied by the development stage. In other words, it is assumed that people in developed countries are more exposed to digital skills and literacy compared to those in developing countries. And, by comparing the effects of Internet penetration on income inequality between these two groups of countries, it can be tested whether stage of development and digital literacy could play a role in bridging the inequality from the Internet or not. Should this hypothesis hold true, this finding will call for not only greater Internet infrastructure in developing countries, but also government spending to improve Internet and digital literacy.
METHODOLOGY
For the most part, this paper used econometric analysis with macro panel data to examine the impact of the Internet on income inequality.
Econometric models
Simple regression:
Yit = α + β Xit + ρ Zit + εit ……………(eq. 1)
Fixed effects model:
Yit = α + β Xit + ρ Zit + αi + εit……………(eq. 2)
Subscript i = country; subscript t = time (year)
Y = outcome variables (GDP growth/GDP
per capita/Gini coefficient index)
α = constant or y-intercept
X = key independent variable (Internet us- ers per 100 people)
β = coefficient of key independent variable
Z = covariates
ρ = vector coefficients of covariates α_= unobserved time-invariant country effects
ε = error term
Data
This paper used data from the World Development Indicators from the World Bank database. Data from both developed and developing countries will be used, from 1990 to 2015.
- Dependent variable: Gini: coefficient index
- Key independent variable: Internet penetration per 100 people
- Number of countries in the dataset: 191 countries
- Number of total observations: 191 countries x 26 years = 4,992 observations
Of the 217 countries in the dataset, 26 were excluded due to limited data availability: Afghanistan, Andorra, British Virgin Islands, Cayman Islands, Channel Islands, Curacao, French Polynesia, Gibraltar, Greenland, Guam, Isle of Man, North Korea, Liechtenstein, Myanmar, Nauru, New Caledonia, Northern Mariana Islands, St. Maarten (Dutch part), St. Martin (French part), San Marino, Somalia, South Sudan, Syrian Arab Republic, Turks and Caicos Islands, Virgin Islands (U.S.), and American Samoa.
Worldwide data were used to gain statistical power by increasing the sample size to reduce bias. However, this paper is particularly interested in the effects for developing countries in Asia. Therefore, fixed effects and region dummies were employed to capture the variation of effects on different regions and different income levels.
As for control variables, several factors were used as independent variables to get rid of omitted variable bias. Precisely, factors that were likely to influence inequality and/or the level of Internet penetration were included. As learned from previous studies that Internet use and economic growth are positively correlated, the selection of these control variables was based on growth determinants from the classical economic growth model by Robert Barro (1991; 1996). Barrow’s model includes both economic indicators and human capital indicators. GDP, inflation, terms of trade, and FDI are included as economic indicators to capture the impact of globalization. According to IMF’s World Economic Outlook (2007), globalization is a key determinant of inequality and is correlated with it. The report states that trade globalization leads to reduction in inequality, but financial globalization, especially foreign direct investment, is associated with income inequality (IMF, 2007). However, regardless of how they are correlated, globalization indicators should be included in econometric models. Additionally, human capital indicators, such as population, fertility, and school enrollment, were considered.
Following this growth model, these factors are used as controlled variables, because they are likely to affect the level of Internet penetration, and some of these variables may also be associated with income inequality, such as unemployment and educational opportunities. To justify the selection of controlled variables conceptually, it is likely that countries with high GDP per capita have more Internet penetration. A similar situation applies to countries with low fertility rate (aging countries), as they are more likely to be more developed. As for income distribution, educational opportunities and unemployment could be associated with inequality, as education and career opportunities are ways in which the income gap can be bridged. In the econometric models used, the control variables included the following: GDP growth; GDP per capita; FDI; inflation; trade; unemployment; agriculture; service; industry; urban population; fertility rate; total population; and education enrollment for primary, secondary, and tertiary levels. (Detailed description and summary statistics are presented in Table 1.)
It is important to note that the variables GDP per capita, total population, and fertility rate are logged to make sure that the correct functional form was used for the analysis (marked with ‘*’ in Table 1). This functional form is based on previous literature, especially Barro (1991).
Table 1. Descriptive statistics.
|
Variable Description |
N |
Mean |
Std |
Min |
Max |
|
|
Dependent variable |
|
|
|
|
|
|
|
Gini GINI index (World Bank estimate) |
1,170 |
39.80 |
9.80 |
16.23 |
65.76 |
|
|
Key independent variable |
|
|
|
|
|
|
|
Internet user |
Internet users (per 100 people) |
4,218 |
20.09 |
25.98 |
0.00 |
98.32 |
|
Controlled variable |
||||||
|
GDP growth |
GDP growth (annual %) |
4,738 |
3.63 |
6.79 |
-64.05 |
149.97 |
|
GDP per capita* |
GDP per capita (current US$) |
4,811 |
10,010 |
16,833 |
0.00 |
193,648 |
|
FDI |
Foreign direct investment, net inflows (% of GDP) |
3,844 |
1.99 |
11.66 |
-202.82 |
233.36 |
|
Inflation |
Inflation, GDP deflator (annual %) |
4,729 |
40.60 |
511.82 |
-31.57 |
26,766 |
|
Trade |
Trade (% of GDP) |
4,562 |
87.94 |
52.36 |
0.02 |
531.74 |
|
Unemploy- ment |
Unemployment, total (% of total labor force) (national estimate) |
2,524 |
9.18 |
6.61 |
0.00 |
59.50 |
|
Agriculture |
Agriculture, value added (% of GDP) |
4,230 |
15.32 |
13.80 |
0.00 |
65.97 |
|
Services |
Services, etc., value added (% of GDP) |
4,239 |
55.74 |
14.89 |
2.43 |
93.76 |
|
Industry |
Industry, value added (% of GDP) |
4,226 |
28.84 |
12.64 |
3.48 |
96.74 |
|
Urban population |
Urban population (% of total) |
4,936 |
54.46 |
23.86 |
5.42 |
100.00 |
|
Fertility* |
Fertility rate, total (births per woman) |
4,617 |
3.24 |
1.70 |
0.83 |
8.61 |
|
Population* |
Population, total |
4,959 |
32.3m |
126m |
9,004 |
1370m |
|
Tertiary education |
School enrollment, tertiary (% gross) |
2,925 |
30.69 |
24.62 |
0.00 |
119.78 |
|
Secondary education |
School enrollment, secondary (% gross) |
3,250 |
75.02 |
30.99 |
5.13 |
164.81 |
|
Primary education |
Adjusted net enrollment rate, primary (% of primary school age children) |
2,546 |
88.26 |
15.82 |
19.15 |
100.00 |
Note: *Logged function.
Empirical strategy
Using the data and the methodology described above, the results were specified and presented in five different models in order to sufficiently and effectively test the hypotheses and support the arguments stated earlier in the paper.
- Model 1: Simple regression, with controlled variables
- Model 2: Simple regression with OECD interaction terms, with controlled variables
- Model 3: Simple regression with Asia-Pacific interaction terms, with controlled variables
- Model 4: Simple regression with developed Asia and developing Asia interaction terms, with controlled variables
- Model 5: Region fixed effects model, with controlled variables
Then, a robustness test was conducted, first by using the logistic regression model to test the likelihood of being in a seriously unequal condition, and second by using the quadratic functional form.
RESULTS
As shown in the correlation diagram (Figure 1), the number of Internet users negatively correlated with the Gini coefficient index; however, the correlation value of −0.24 indicated a weak correlation. The negative sign means that the more Internet users, the lower the Gini index, which also implied less inequality. With this background in mind, the relationship between Internet penetration and in-come distribution was further examined with econometric models.
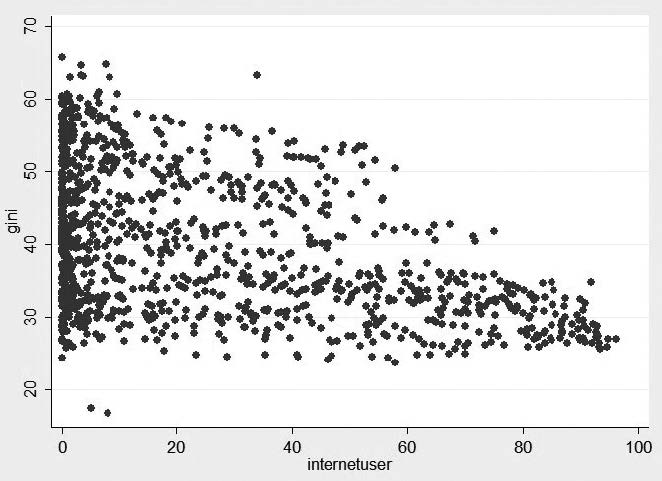
Figure 1. Correlation between the Gini coefficients and the number of Internet users.
Table 2. Simple regression results for Models 1-4.
|
|
Model 1 |
Model 2 |
Model 3 |
Model 4 |
|
Variables |
Gini |
Gini |
Gini |
Gini |
|
internetuser OECD internet*OECD
asiapacific |
−0.028*** (0.009) |
−0.004 (0.015) −1.125 (0.748) −0.043*** (0.014) |
−0.042*** (0.010)
−2.199*** (0.729) |
−0.040*** (0.010) |
|
internetasiapac
internetdevelopedasia |
|
|
0.084*** (0.016) |
0.075*** |
|
|
|
|
|
(0.018) |
|
internetdeveloping |
|
|
|
0.099 |
|
|
|
|
|
(0.102) |
|
Observations |
1,092 |
1,092 |
1,092 |
1,092 |
|
Adjusted R-squared |
0.337 |
0.359 |
0.355 |
0.351 |
Note: ***p<0.01, **p<0.05, *p
Model 1 used simple regression, with the Gini index as dependent variable and number of Internet users as the key independent variable, controlling for other variables. The regression results from this first model suggested that the number of Internet users was weakly and negatively correlated with the Gini index (p<0.01), with a coefficient of −0.03. Most of the other covariates were also statistically significant, except for logged population.
Model 2 added a dummy variable called OECD; this was coded 0 for non-OECD countries and 1 for OECD countries. The selection of the OECD countries was based on the list of member OECD countries on the official website (www.oecd.org). The purpose of doing this was to test the hypothesis that Internet penetration is assumed to have a more positive impact on income distribution in developed countries, because the citizens on average can access and use the Internet in efficient ways. The results from the second model affirmed this hypothesis; Internet penetration tended to decrease the Gini index, or, in other words, narrowed the inequality gap. However, the coefficient was small and insignificant. Nevertheless, when considering the interaction terms between Internet users and OECD countries, the finding showed that an additional person using the Internet per 100 persons (1 percent increase) in OECD countries, reduced the Gini index by 0.04, more than non-OECD countries, and this finding was statistically significant (p<0.01).
Model 3 added an Asia-Pacific dummy variable coded 1 for countries within the Asia-Pacific region. This measured the effect of Internet penetration on income distribution for the Asia-Pacific compared to the rest of the world. The results suggested a similar patternthat Internet penetration slightly reduced the Gini index (p<0.01). The interaction terms suggested that an increase in the number of Internet users in the Asia-Pacific region had an adverse impact on income distribution (more inequality) compared to the rest of the world. This was extended to test the variation in the effects between developed and less developed Asia, which is illustrated in model 4.
Model 4 included two interaction terms: one between Internet users and developed Asian countries and the other between Internet users and developing Asian countries. This made it possible to tease out the differential effect of Internet penetration in two parts of Asia. The regression results showed a consistent pattern with Model 3 that Internet penetration in Asia widened the inequality gap slightly. However, when comparing developed and developing Asia, the results suggested that for developed Asia, Internet penetration increased the Gini index less than that for developing Asia. This did not prove the hypothesis directly, but it definitely revealed the pattern that Internet use in developed countries does less harm to income distribution that in developing countries.
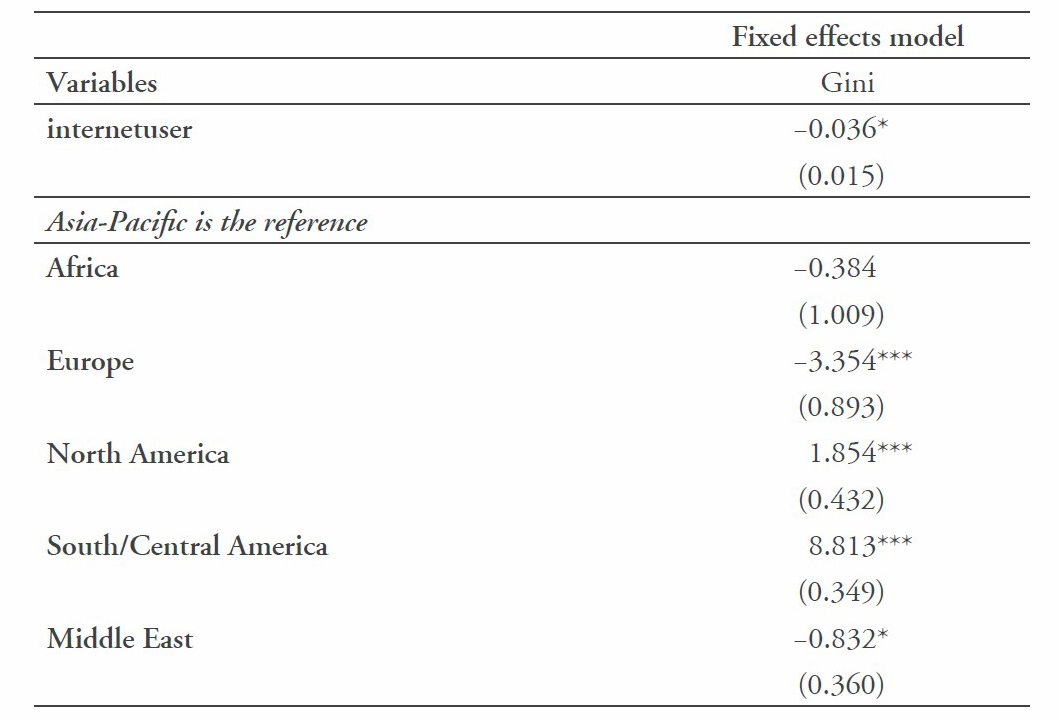
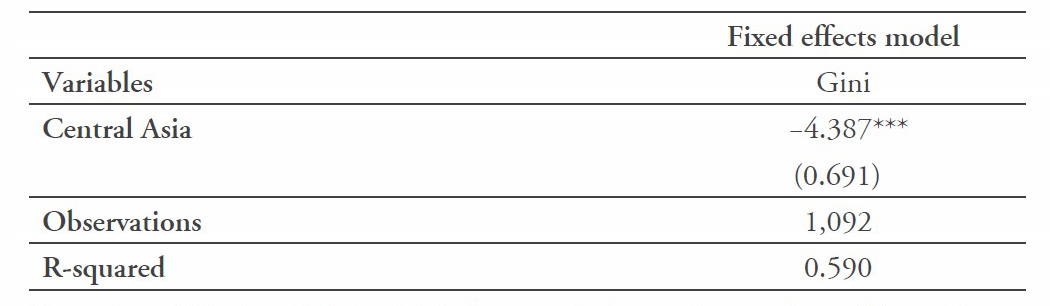
Table 3. Results from Fixed Effects Model (Model 5).
Note: *** p<0.01, ** p<0.05, * p
Model 5 (equation 2) added region fixed effects to control for time-invariant factors pertaining to different regions, such as cultural factors in the various regions. This required assigning a region code to each of the 191 countries in the sample. The countries were divided into seven regions: Asia-Pacific, Africa, Europe, North America, South/Central America, the Middle East, and Central Asia. The results with region fixed effects demonstrated that Internet penetration had a negative coefficient of 0.04 (p<0.1); in other words, one additional person using the Internet per 100 persons (a 1% increase) lowered the Gini index by 0.04. This model shows the relationships between the different regions and the Gini index. Using Asia-Pacific as the reference category, Africa had a slightly lower Gini index than Asia- Pacific, but the coefficient was not significant. Europe, the Middle East, and Central Asia had significantly less income disparity than Asia-Pacific, and the coefficients were all statistically significant. In contrast, the Americas (North, Central, and South) had higher Gini indices than Asia-Pacific, with all the coefficients statistically significant. South and Central America were associated with the highest inequality.
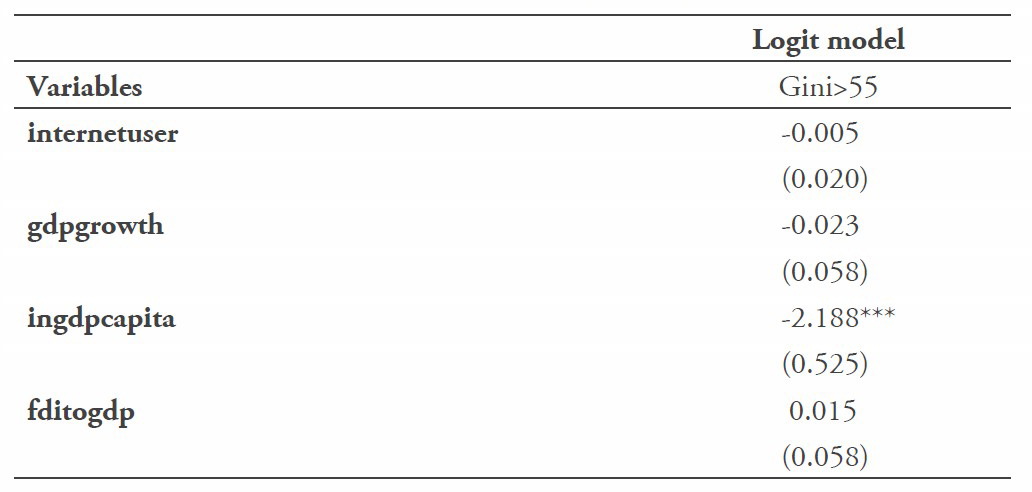
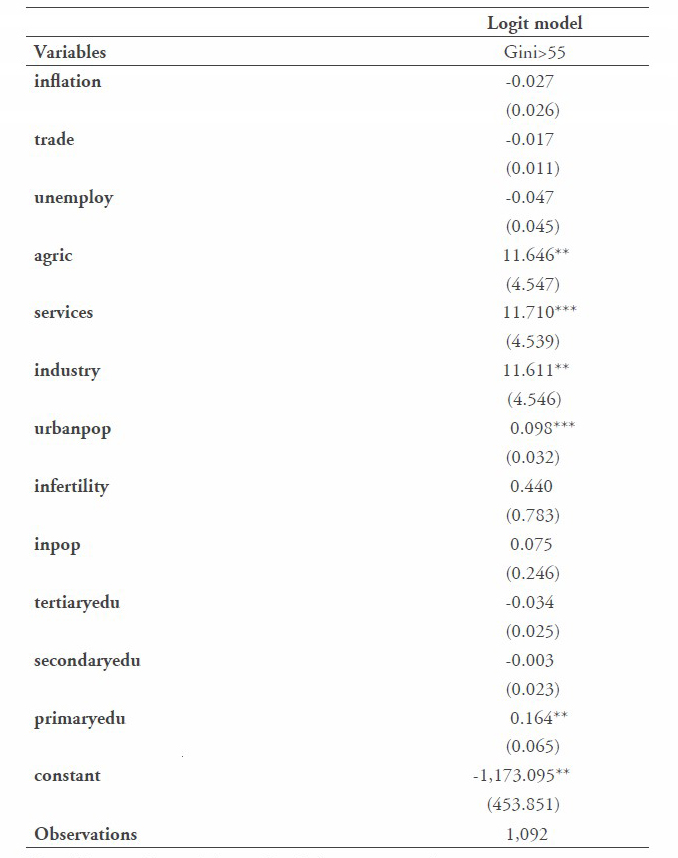
Table 4. Results of robustness check using logistic regression model.
Note: ***p<0.01, **p<0.05, *p
Robustness tests – logistic regression
The first attempt to test for robustness used the sub-sample of Asia-Pacific countries to repeat the first model and measure the differential effect between developed and developing Asia. However, the sample size reduced significantly, especially when developed and developing countries were split, to the point that it could not be used to make an inference. Instead, a logistic regression model was employed to test whether the number of Internet users per 100 increased or decreased the likelihood of having a discernable level of inequality. According to the IMF (2015), global inequality ranged from 0.55 to 0.70. Therefore, a dummy variable was created, coded 0 if Gini was below 55, and 1 if Gini was 55 and above.
The finding from this logistic model was consistent with the finding from the first model of simple regression; one additional person using the Internet per 100 persons decreased the likelihood of having a Gini index more than 55 by 0.01 – however, the coefficient was small and not statistically significant.
Robustness tests – quadratic functional form
Kuznets (1955) hypothesized an inverse U-shaped relationship between economic growth and income distribution. Therefore, in order to correct the functional form, the GDP per capita variable used in the regression models is now in the form of a quadratic function. However, for the most part, the results were consistent with the original results. Table 5 summarizes the changes in the coefficient of the key independent variable (number of Internet users) after adjusting the functional form of the GDP per capita variable. These changes included changes in sign, size, and significance of the coefficient, as well as the size of the adjusted R-squared. The findings from the quadratic form exhibited slightly higher adjusted R-squared, suggesting that the model fit the data better. However, the original results were also quite robust, since the changes were mostly minor and the interpretation of the results the same.
Table 5. Summary of changes after transforming the GDP variable into quadratic form.
|
Model |
Sign (+/−) |
Size |
Significance |
(Adjusted) R2 |
|
Model 1 |
Unchanged |
∆ by 0.008 |
Different significance |
+ by 0.013 |
|
|
|
|
levels |
|
|
Model 2 |
Unchanged |
∆ by 0.006 |
Unchanged |
+ by 0.009 |
|
Model 3 |
Unchanged |
∆ by 0.007 |
Unchanged |
+ by 0.007 |
|
Model 4 |
Unchanged |
∆ by 0.006 |
Unchanged |
+ by 0.004 |
|
Model 5 |
Unchanged |
∆ by 0.015 |
Becomes insignificant |
+ by 0.004 |
DISCUSSION
Considering the gap in the literature identified earlier, the findings of this paper shed light on the relationship between Internet penetration (measured by the number of Internet users per 100 persons) and income inequality (measured by the Gini index). While several studies have confirmed a positive correlation between the Internet and economic growth, the findings of this study has shown that the Internet increases inequality, although the magnitude was small. With previous studies coming to no conclusion or agreement whether and through what channels the Internet affected inequality, this paper has argued that the benefits of using the Internet depend not only on access, but also on the ability and wisdom with which it is used. Further, I argue that Internet users in developed countries are assumed to have more Internet access and digital literacy compared to their developing-country counterparts and, therefore, hypothesized that Internet use is likely to improve inequality more in developed countries than in developing countries. The findings from this study proved that, by using OECD countries as developed countries, Internet use in developed countries reduced inequality more than in developing countries.
For Asia-Pacific countries, Internet use in developed Asian countries did not reduce inequality, but it did less harm than Internet use in developing Asian countries. The OECD results and that of developed Asia differed, even though they are both considered developed. This might be explained by differences in stages of ‘developed’, with some countries identified as ‘developed’ in Asia, such as Malaysia and Thailand, not as advanced as OECD countries, and more appropriately considered emerging countries. The rapid development and urbanization in these Asian countries have advanced technological progress so quickly and increased the number of Internet users so rapidly that the gap between the haves and have-nots, between urban and rural, is highlighted. During this stage of rapid growth in Asia, the Internet may exacerbate this gap; but as the results showed, the gap from the Internet is not as wide for developed Asia as developing Asia. Moreover, some developed Asian countries have relied heavily on foreign direct investments, more so than any other developed regions. According to the IMF (2007), foreign direct investment correlates with inequality, rather than the other way around.
Given these results, the policy implication from this study is straight- forward. It is important for governments, especially in developing countries, to invest in Internet infrastructure that would improve equal access to the Internet. It is equally important for governments to integrate digital literacy in the formal education sector, as well as raise awareness about the advantages of using the Internet and how the Internet can provide opportunities for disadvantaged people. Optimistically, once digital access and literacy reach most people, Internet use will be integrated in their daily lives, such as for iBanking, applying for jobs online, and e-commerce. These phenomena, as experienced in more developed countries, may help narrow the income inequality gap.
The shortcoming of using macro data for this type of analysis is that data availability was limited for some variables in several countries, especially for data either before 2000 or in the most recent years. Data for the Gini index, for example, are not recorded on a yearly basis in several countries. However, the macro data are sufficient to analyze the trends and patterns. For future studies, researchers may consider adding time series or using lagged Internet penetration, because it may take time – a year or even more – for Internet penetration to substantially affect inequality.
REFERENCES
Acemoglu, D. (2003). Technology and inequality. National bureau of economic research. Retrieved from http://www.nber.org/reporter/winter03/technologyandinequality. html
Acemoglu, D., Johnson, S., & Robinson, J.A. (2001). The colonial origins of comparative development: An empirical investigation. The American Economic Review, 91(5), 1369–1401. https://doi.org/10.12 57/aer.91.5.1369
Asian Development Bank. (2016). Asian Development Outlook 2016: Asia Potential’s Growth. Manila, Philippines. Retrieved from https://www.adb.org/sites/default/files/ publication/182221/ado2016.pdf
Barro, R. J. (1991). Economic Growth in a Cross Section of Countries. The Quarterly Journal of Economics, 106(2), 407-443.
Barro, R.J. (1996). Democracy and Growth. Journal of Economic Growth, 1(1), 1-27.
Barua, A. (2015). Packing a mightier punch: Asia’s economic growth among global markets continues. Asia Pacific Economic Outlook, Q1 2016. Deloitte University Press. Retrieved from https://dupress.deloitte.com/dup-us-en/ economy/asia-pacific-economic- outlook/2016/q1-asia-economic- growth-continues.html
Bloomberg. (2015). The Bloomberg innovation index. Retrieved from http://www.bloomberg.com/graphics/2015-innovative-coun- tries/
Blundo, R.G., Mele, C., Hairston, R., & Watson, J. (1999). The internet and demystifying power differentials: A few women online and the housing authority. Journal of Community Practice, 6(2), 11-26. https://doi:10.1300/ J125v06n02_02
Coyle, D., & Williams, H. (2006). Towards a more equal world: the mobile internet revolution. The policy paper series no.16. Voda- fone Group Pcl. Retrieved from https://www.vodafone.com/content/dam/vodafone-images/pub-lic-policy/inequality/Vodafone- equal-world.pdf
Dalberg. (2013). Impact of the Internet in Africa. Establishing conditions for success and catalysing growth in Ghana, Kenya, Nigeria and Senegal. Retrieved from http://www.impactoftheinternet.com/pdf/Dalbery_Impact_of_ Internet_Africa_Full_Report_ April2013_vENG_Final.pdf
Feezell, J.T., Conroy, M., & Guerrero, M. (2016). Internet use and political participation: Engaging citizenship norms through online activities. Journal of Information Technology & Politics, 13(2), 95- 107. https://doi.org/10.1080/193 31681.2016.1166994
Guerriero, M. (2015). The impact of Internet connectivity on economic development in Sub-Saharan Africa. Department for International Development, United Kingdom.
Gulati, S. (2008). Technology-en-hanced learning in developing nations: A review. International Review of Research in Open and Distance Learning, 9(1).
Harris, R.G. (1998). The Internet as a GPT: Factor market implications. In General purpose technologies and economic growth. MIT Press, pp. 145–166.
International Monetary Fund. (2007). Globalization and Inequality, World Economic Outlook. IMF, Washington, pp. 31-65, October. International Monetary Fund. (2015). Causes and Consequences of Income Inequality: a global perspective. IMF staff discussion note. Retrieved from https://www.imf. org/external/pubs/ft/sdn/2015/ sdn1513.pdf
Internet World Stats. The digital divide, ICT, and broadband inter- net. Retrieved from http://www.internetworldstats.com/links10.htm
Kuznets, S. (1955). Economic Growth and Income Inequality. Ameri- can Economic Review 45 (March): 1–28.
Lansing, K., & Markiewicz, A. (2011). Technology diffusion and increasing income inequality. University of St. Andrews. Retrieved from https://www.st-andrews.ac.uk/cdma/con-f11papers/Agnieszka%20Mark- iewicz.pdf
MacDougald, Joseph J., (2011). Internet Use and Economic Development: Evidence and Policy Implications. Graduate Theses and Dissertations. Retrieved from: http://scholarco-mmons.usf.edu/etd/3225
Meijers, H. (2012). Does the Internet general economic growth, international trade, or both?. UNU-Merit working paper. United Nations University.
Rodrik, D., Subramanian, A., & Trebbi, F. (2004). Institutions rule: the primacy of institutions over geography and integration in economic development. Journal of Economic Growth, 9, 131–165.
Rosenberg, N. (2004). Innovation and economic growth. OECD. Retrieved from https://www.oecd. org/cfe/tourism/34267902.pdf
Sachs, J.D., & McArthur, J.W. (2002). Technological advance and long-term economic growth in Asia. In Technology and the New Economy (edited by Chong-En Bai and Chi- Wa Yuen). Cambridge, MA: MIT Press, pp. 157-185
Warschauer, M. (in press). A literacy approach to the digital divide. In M. A. Pereyra (Ed.), Las mulial- fabetizaciones en el espacio digital. Malaga, Spain: EdicionesAljibe.
World Bank. (2009). Information and Communications for Development 2009: Extending Reach and Increasing Impact. Washington.
World Bank Group. World Development Indicators. Retrieved from http://data.worldbank.org/da-ta-catalog/world-development- indicators