ABSTRACT
This study employs support vector machine (SVM) classification to analyze the combined influence of the marketing mix 7Ps framework, destination image, value of travel time (VTT), and electronic word of mouth (eWOM) on traveler hotel selection. Data was collected using a Likert scale questionnaire answered by respondents located in Nakhon Phanom province, Thailand. Prior studies emphasize the role of eWOM, but do not evaluate eWOM’s interaction with other key variables. We study this interaction, finding that eWOM, VTT, and destination image are the dominant predictors of hotel choice, with eWOM showing a particularly strong synergistic relationship with both destination image and price perception. In contrast, traditional factors like physical evidence and price exerted minimal influence. This study interprets the 7Ps framework with greater nuance by integrating digital variables and adopting dropout loss analysis to evaluate feature relevance. Although dropout loss offers intuitive insights, it has limitations, and future work is encouraged to compare results with Shapley Additive Explanations or permutation-based methods. Results demonstrate strong model performance (test accuracy up to 98.8%), validating the robustness of SVM in handling complex, nonlinear hospitality datasets. Practical recommendations include targeted digital reputation strategies and context-specific eWOM management across hotel segments. Future longitudinal and cross-regional studies are needed to enhance the generalizability of our findings.
Keywords: eWOM, Hotel, Marketing mix, Machine learning, Destination image.
INTRODUCTION
The hospitality and hotel industry has undergone rapid transformation in recent years due to technological advancements and shifting traveler behaviors. Since the COVID-19 pandemic, travelers prioritize safety, hygiene, and high-quality experiences, and the decision-making process for choosing accommodation has fundamentally changed. Consumer choices no longer rely solely on traditional marketing strategies but are significantly influenced by electronic word of mouth (eWOM) and destination image, which clearly impact travelers’ perceptions and preferences (Kim and Park, 2017). Recognizing these factors is crucial for managers and researchers to design strategies that align with consumer behavior in the digital era, where travelers have greater decision-making power and rapid, widespread access to information through online platforms.
This study demonstrates that digital and experiential elements, particularly eWOM and destination image, outweigh traditional marketing mix components (the 4Ps or 7Ps) in hotel selection decisions. Results from our support vector machine (SVM) model confirm eWOM as the most critical factor, consistent with prior studies emphasizing the pivotal role of user-generated content in travelers’ decision-making processes. The rise of social media platforms and review websites has amplified eWOM’s role. Online reviews reduce perceived risks before booking and influence traveler expectations and satisfaction. Gupta (2022) found that many travelers rely on online reviews before booking, while Danish et al. (2019) noted that emotions in reviews can accurately predict booking intentions.
This study proposes integrating the 7Ps marketing mix framework (product, price, place, promotion, people, process, and physical evidence) with modern digital and experiential factors such as eWOM, destination image, and value of travel time (VTT) to create a comprehensive model explaining travelers’ accommodation choices. While the 7Ps have long been a cornerstone of service businesses (Kwok et al., 2020), this study extends the framework by incorporating new elements and emphasizing their transformative impact on 7P interactions. We find that eWOM acts as a dynamic extension of “product” and is not merely an external influence. We find that destination image enhances the effectiveness of “place” and “promotion,” serving as a multiplier of perceived value. We also find that VTT applies behavioral economics to “price” and location-based decisions.
The interaction between eWOM and other elements offers crucial strategic insights. While eWOM exerts the strongest influence, its effect can be shaped by destination image and pricing strategies. Borlido and Kastenholz (2021) discovered that destination image impacts both the choice of a destination itself and the accommodation within it. Positive online reviews can justify premium pricing in highly-regarded destinations. Conversely, accommodations in areas with a poor image, or those with overpriced rates lacking additional value, will likely struggle to attract travelers. Furthermore, the influence of eWOM differs based on hotel type and geographic context. In cities primarily catering to business travelers, eWOM acts as a supplementary tool rather than the main factor driving decisions. However, in leisure destinations, it often becomes a critical element in the booking process. Boutique hotels tend to benefit more from eWOM compared to large, established brands. This highlights the importance of tailoring online reputation management to each property’s specific market position and target audience.
SVM classification provides clarity on how digital and experiential factors predict each “P.” As İnan (2024) notes, SVM excels at handling nonlinear relationships and high-dimensional data, common in accommodation choice datasets. Our approach improves on studies that analyze digital and traditional factors separately, offering both theoretical and practical value for hotel managers. The hospitality sector’s digital transformation has reshaped traveler behavior, particularly in accommodation choices. While the 7Ps remain foundational, digital factors like eWOM, destination image, and VTT play significant roles. We use SVM to explore complex interactions between these factors, showing that eWOM is not an isolated factor but works in tandem with the Ps, like price, product, and promotion.
The study’s main contribution lies in integrating digital dimensions with traditional marketing frameworks and leveraging machine learning to uncover patterns overlooked by conventional analysis. This enables managers to craft precise, targeted marketing strategies.
LITERATURE REVIEW
In recent years, the hospitality industry has experienced rapid transformation driven by the proliferation of digital platforms and evolving traveler behaviors. Hotel selection decisions are no longer solely influenced by traditional marketing mix elements but increasingly reflect the impact of eWOM, destination image, and VTT. This literature review critically examines how these digital and experiential factors interact with the classic 7Ps framework, offering a more integrated theoretical and methodological perspective to address existing research limitations.
REFRAMING 7PS IN THE DIGITAL CONTEXT
The 7Ps marketing mix is a foundational framework in hospitality research (Kwok et al., 2020). However, digital transformation has fundamentally altered how these elements function in contemporary consumer decision-making. Traditional interpretations of “product” now extend to include online reviews as real-time service quality indicators (Filieri et al., 2021), while “promotion” has shifted from conventional advertising toward eWOM (Yoo and Gretzel, 2011). These technological advances have reshaped the entire consumer journey, requiring marketers to integrate both traditional and digital touchpoints strategically (Kalgi et al., 2023).
While recent studies have begun incorporating digital variables such as eWOM and destination image into the 7Ps framework, most examine these factors in parallel rather than through integrated, interactive models. Our study advances beyond existing research by expanding the 7Ps framework to include digital dimensions while simultaneously redefining the functional roles of key components through a digital lens. Specifically, eWOM is conceptualized as a dynamic, real-time extension of “product,” while destination image serves as a contextual amplifier for both “promotion” and “place.” We employ advanced machine learning techniques—SVM classification and dropout loss analysis—to uncover complex, nonlinear interactions between digital and traditional variables, progressing beyond earlier linear or descriptive approaches.
The deliberate inclusion of "physical evidence" in the model, despite its lower predictive contribution, represents both theoretical rigor and strategic analytical value. Under the original 7Ps framework, physical evidence encompasses tangible service quality cues—cleanliness, ambiance, décor, and visual identity—that traditionally influence consumer perceptions, particularly among first-time travelers and older demographics in emerging tourism markets. Rather than excluding this variable based on low feature significance scores, its retention serves multiple critical purposes: maintaining theoretical completeness of the extended 7Ps model, providing a comparative benchmark against emerging digital factors, and enabling systematic evaluation of the traditional-to-digital transition.
The consistently low dropout loss and Shapley Additive Explanations (SHAP) values observed for physical evidence constitute empirically significant findings rather than methodological limitations. These results provide concrete evidence of a fundamental consumer behavioral shift from reliance on physical attributes toward digital reputation signals in post-pandemic traveler decision-making. This transition demonstrates the declining salience of traditional physical cues while reinforcing the study's central argument for digital transformation in hospitality marketing. Further, maintaining physical evidence in the analytical framework ensures model completeness and supports future comparative studies across varying hotel categories or emerging markets where physical attributes may retain greater consumer influence.
EWOM: FROM STATIC PREDICTOR TO DYNAMIC INFLUENCER
Prior research consistently identifies eWOM as a critical factor in shaping hotel selection decisions (Hu and Kim, 2018; Danish et al., 2019; Verma and Yadav, 2021). However, much of this literature treats eWOM as an independent or static predictor, neglecting its potential interactions with contextual variables such as price sensitivity and destination image. This gap is especially pronounced in machine learning-based studies, where interaction effects are often underexplored (Bordian et al., 2024). This study addresses this limitation by applying SVM modeling and feature interpretation based on SHAP to reveal how eWOM’s predictive power varies across different destination contexts and pricing levels. By doing so, it shifts the theoretical discourse from a unidimensional perspective of eWOM toward a more nuanced, interaction-focused model of consumer decision-making.
While eWOM significantly influences pre-purchase behavior by enhancing trust and reducing perceived risk (Verma and Yadav, 2021), the novelty of this study lies in examining how eWOM interacts with other factors. Borlido and Kastenholz (2021) suggest that strong destination imagery can amplify the influence of eWOM, particularly in premium pricing environments. Further, Le and Ryu (2023) emphasize platform-specific dynamics (e.g., TripAdvisor vs. Ctrip), which further contextualize eWOM’s effectiveness. These insights inform tailored strategies across hotel segments, reflecting the need for context-sensitive digital reputation management.
Destination image operates as both a symbolic value cue and a moderator of perceived accommodation quality, with travelers associating premium destinations with high-quality hotels to justify elevated pricing (Wang and Yang, 2022; Can et al., 2023). Nevertheless, this relationship exhibits contextual variability—revisit travelers often prioritize hotel-specific attributes over broader destination appeal, emphasizing the dynamic interplay between destination familiarity and accommodation selection criteria (Kim et al., 2012).
THE VALUE OF VTT
In our study, VTT offers a behavioral economics dimension that captures how travelers evaluate trade-offs between temporal, financial, and convenience factors (Jain and Lyons, 2008). Within this framework, destination image and eWOM function as amplifiers of perceived time value, creating a three-way interaction mechanism that remains largely unexplored in hospitality literature.
This study synthesizes Service-Dominant Logic (S-D Logic) and Social Cognitive Theory (SCT) to provide comprehensive theoretical grounding. S-D Logic conceptualizes destination image as a co-created perception emerging from the dynamic integration of past experiences, marketing communications, and peer feedback, positioning consumers as active value co-creators rather than passive recipients (Vargo and Lusch, 2004). Complementarily, SCT frames eWOM as digital observational learning, where individuals develop attitudes and behavioral intentions through vicarious experiences shared on platforms like TripAdvisor and Google Reviews (Bandura, 2001). This process transforms peer evaluations into trusted decision-making inputs that directly influence hotel selection.
VTT extends these frameworks by incorporating behavioral economics principles, emphasizing that travelers evaluate both monetary costs and temporal opportunity costs related to hotel location, accessibility, and proximity convenience (Jain and Lyons, 2008). This multidimensional theoretical integration offers a comprehensive lens for analyzing how digital feedback mechanisms and experiential cues collectively shape hospitality choices beyond traditional marketing paradigms.
METHODOLOGICAL INNOVATION AND ANALYTICAL APPROACH
Previous hospitality research has predominantly employed regression analysis or structural equation modeling, approaches that may oversimplify the inherently nonlinear relationships among contemporary decision variables. This study advances methodological rigor by implementing SVM classification (İnan, 2024). Our analytical framework employs a dual interpretability approach to ensure robust findings and validation. Dropout loss analysis serves as the primary interpretability method due to its computational efficiency, intuitive clarity, and direct operational applicability for hotel managers. This technique quantifies predictive accuracy reduction when individual variables are excluded, providing transparent variable significance rankings. To address dropout loss limitations—particularly its inability to capture complex inter-variable interactions—SHAP was incorporated as a secondary validation method. The convergent results between both approaches (consistently ranking eWOM, VTT, and destination image as primary predictors) substantiate the robustness of findings while acknowledging methodological constraints.
RESEARCH CONTRIBUTIONS AND THEORETICAL ADVANCEMENT
Unlike previous studies that examine eWOM, destination image, and VTT as independent factors, this research offers a new perspective by analyzing their interdependencies within a unified, interaction-focused framework. Our study demonstrates how eWOM’s influence is contextually moderated by destination reputation and location convenience. It also reveals the diminishing predictive role of traditional factors, like physical evidence, especially when comprehensive digital feedback is available. Furthermore, it provides differentiated insights across various hotel segments to address concerns about generalizability. By adopting this holistic approach, the study fills existing gaps in the literature. It identifies not only what influences traveler decisions, but also explains how and why these influences vary depending on the context. This analytical dimension remains largely underexplored in current hospitality research.
CROSS-SECTIONAL DATA LIMITATION AND TEMPORAL CONSIDERATIONS
A key limitation of this study is its reliance on cross-sectional data, which captures traveler preferences and behaviors at a single point in time. While this approach is useful for identifying general patterns, it does not account for the temporal volatility of digital variables like eWOM. The influence of eWOM can fluctuate due to seasonal trends, economic conditions, or emerging platform dynamics. Given the constant evolution of digital feedback mechanisms (e.g., reviews, ratings), future research should consider using longitudinal data collection or time-series modeling. This would allow for an exploration of how the impact of eWOM, destination image, and the VTT shifts over time. Additionally, incorporating traveler revisit behavior or delayed booking patterns could help capture more dynamic decision-making processes, thereby enhancing the generalizability and practical relevance of the findings.
RESEARCH CONTEXT
Nakhon Phanom province is located in northeastern Thailand and has a long-standing historical legacy. It is believed to have once been the center of the ancient Sri Kotrabun Kingdom which flourished in the early 12th century Buddhist Era (around the 6th century Common Era). The kingdom was independent at the time. The Sri Kotrabun Kingdom then began to decline and fell under the rule of the Khmer Empire. Later, around the 18th century Buddhist Era (around the 12th century Common Era), the name Sri Kotrabun became associated with a city within the Lan Xang Kingdom. The monarchy continued to pass down through several generations. The city comprises an urban area of 5,513 km² today.
In Northeast Thailand’s economic context, over the past decade (2014-2022), the service sector has experienced steady growth driven by the development of infrastructure and urbanization in different provinces (Chaiyarat and Setthasomboon, 2022). Hotels and accommodations in secondary destination cities are gaining more attention, as reflected by higher occupancy rates than before the COVID-19 pandemic, owing to many provinces prioritizing tourism, marketing activities or events, and establishing landmarks to attract travelers. In the first quarter of 2024, secondary cities with high occupancy rates and growth over the same period in 2019 include Chiang Rai, Yala, Nakhon Phanom, Phayao, etc. Despite positive trends, the recovery of the hotel and accommodation sector remains uneven. The industry faces a mix of ongoing and emerging challenges, such as fluctuations in traveler demand and a competitive market environment. Additionally, the rise of new attractions, especially natural sites, has led to a more dispersed traveler flow, intensifying competition for established hotels, especially those located farther from popular sites. New accommodation openings in major destination hubs have further heightened this competition. According to the Kasikorn Research Center, hotel and accommodation revenues are expected to grow in 2023, though recovery will likely be concentrated in destinations with higher traveler appeal (Kasikorn Research Center, 2023).
METHODOLOGY
This study adopted a quantitative research design utilizing a structured survey to investigate the influence of both traditional and digital factors on hotel selection. The research was based on a comprehensive dataset from Nakhon Phanom, Thailand, which recorded more than 1.5 million tourism-related visits in 2022. Based on Soper’s (2024) sample size calculator, a minimum sample size of 1,050 participants was calculated for structural equation modeling, assuming a small expected effect size (0.1), 53 latent variables, six observed variables, 0.05 significance level, and 0.80 statistical power. The survey instrument was carefully designed to assess four main constructs: the 7Ps marketing mix, eWOM, destination image, and VTT, with all items rated on a five-point Likert scale. The instrument was validated through an expert review conducted with five specialists, resulting in an item-objective congruence exceeding 0.5.
A pilot study involving 30 participants further confirmed the instrument’s strong construct validity. Internal consistency was assessed using McDonald’s Omega (0.812) and Guttman’s Lambda 6 (0.858), both of which met the recommended thresholds based on established criteria (Kalkbrenner, 2021; Isernia et al., 2023).
DATA COLLECTION
A multistage stratified sampling method was implemented for data collection in order to ensure demographic representativeness. Four major tourist destinations in Nakhon Phanom province—Wat Phra That Phanom, the Night Market, Phu Langka National Park, and Phraya Sri Satta Nakarat (Naga King)—were randomly selected, with a target of approximately 263 participants per location. To avoid duplicate responses, every third traveler within the designated sampling zones was approached, and only one participant per household was included. Data collection took place from February to September 2024, with surveys administered on both weekdays and weekends to capture a broad range of tourist behaviors. The survey was mobile-friendly, improving data quality and participant engagement. This approach resulted in 872 valid responses out of the 1,050 targeted, yielding a strong response rate of 83%.
DATA ANALYSIS
SVM classification is useful for capturing nonlinear relationships between hotel selection and multiple influencing factors. Data quality checks were conducted prior to model construction. An interquartile range (IQR) analysis confirmed that data variability was within the acceptable limit of ≤ 5 (Habibzadeh, 2017). Additionally, a multicollinearity check using the variance inflation factor (VIF) indicated all variables fell within the acceptable range (1 < VIF < 5), removing the need to exclude any predictors (Kyriazos and Poga, 2023). The best results were achieved with the 80/20 split, which achieved an accuracy of 98.8% when testing and 98.7% when validating. The SVM model utilized a polynomial kernel of degree 3, with a gamma value of 1, a violation cost parameter of 5, an epsilon of 0.01, and a tolerance level of 0.001 (Shadeed et al., 2020). Model performance was assessed using a comprehensive range of metrics, including accuracy, sensitivity, specificity, area under the curve (AUC), F1-score, precision, recall, and the Matthews Correlation Coefficient (MCC).
The dropout loss analysis, our primary method, measures the decrease in model accuracy when individual variables are excluded. This approach offered intuitive interpretation of predictor impact, computational efficiency, and clear identification of influential variables. A significant degradation of model performance was observed when eWOM, VTT, or destination image were removed, confirming that these variables play a pivotal role in hotel selection. Post-hoc SHAP analysis was conducted to improve interpretability and address any limitations associated with dropout loss. The SHAP validation results consistently matched the dropout loss findings, confirming eWOM, destination image, and VTT as the most relevant predictors.
Despite the robust methodology, our study has certain limitations. The presence of residual class imbalances across different age groups, particularly with regard to hotel type preferences and digital behavior patterns, was observed despite stratified sampling. Additionally, while dropout loss provided clear insights, its interpretability scope lacked granularity in capturing complex variable interactions. These limitations lead us to recommend several areas for future research. This includes implementing enhanced sampling techniques such as class-rebalancing methods (e.g., cost-sensitive learning) and conducting separate demographic subgroup analyses to detect performance disparities. For advanced interpretability, permutation priority should be combined with dropout loss and SHAP, while contrastive explanations should be used in high-stakes decision-making scenarios. Finally, for overall methodological improvements, future studies should triangulate multiple explainable artificial intelligence methods for comprehensive feature relevance assessment and optimize marketing segmentation strategies through subgroup-specific analyses. This methodological section thus provides a framework to comprehend digital and conventional aspects of consumers’ hotel selection while also acknowledging its limitations and providing clear directions for further research.
STATISTICAL ANALYSIS
Statistical analysis was performed using JASP v0.19. In all analyses, a P value of less than 0.05 was considered significant.
FINDING
The VIF values for the various factors are as follows: product (1.82), price (1.86), place (1.85), promotion (1.99), people (2.03), process (2.57), physical evidence (2.35), destination image (1.87), eWOM (1.54), and VTT (1.85). Additionally, the IQR values are price, people, process, physical evidence, and eWOM at (1.00), VTT at (1.20), destination image at (0.95), product at (0.75), and both place and promotion at (1.33).
The SVM classification models were tested across three training splits (80%, 70%, and 60%) with varying violation costs, revealing distinct performance characteristics. In the 80% training split, the model employed a violation cost of 0.060 with 86 support vectors, resulting in high validation accuracy (98.6%) and test accuracy (96.5%) across 553 training, 139 validation, and 172 test samples. The 70% training split model, with a lower violation cost of 0.010 and a higher support vector count (132), demonstrated the best test accuracy at 98.8% and a validation accuracy of 98.7%, indicating that a slight reduction in violation cost and an increase in support vectors contributed to an improved fit with the 700 training, 78 validation, and 86 test samples.
In contrast, the 60% training split model, also using a violation cost of 0.060 but with fewer support vectors (82), achieved perfect validation accuracy (100%) yet slightly lower test accuracy (96.1%) with sample sizes of 624 for training, 111 for validation, and 129 for testing. These findings demonstrate that while higher training splits can yield consistent and balanced accuracy across validation and test sets, optimal violation cost adjustments and support vector counts are essential in enhancing model generalization. The highest test accuracy was observed in the 70% split model, suggesting this split’s effectiveness in balancing training data sufficiency with robust test performance.
Table 1
Model fit.
|
60% |
Violation Cost |
Support Vectors |
n(Train) |
n(Validation) |
n(Test) |
Validation Accuracy |
Test Accuracy |
|
|
0.060 |
86 |
553 |
139 |
172 |
0.986 |
0.965 |
|
70% |
Violation Cost |
Support Vectors |
n(Train) |
n(Validation) |
n(Test) |
Validation Accuracy |
Test Accuracy |
|
|
0.060 |
82 |
624 |
111 |
129 |
1.000 |
0.961 |
|
80% |
Violation Cost |
Support Vectors |
n(Train) |
n(Validation) |
n(Test) |
Validation Accuracy |
Test Accuracy |
|
|
0.010 |
132 |
700 |
78 |
86 |
0.987 |
0.988 |
The SVM models with 60%, 70%, and 80% training splits showed strong performance across various metrics, with notable differences in precision, recall, F1 scores, and AUC. The 80% model exhibited the highest performance, with both classes achieving perfect precision and recall values, resulting in an F1 score of 0.988 and an AUC of 0.989, which implies superior classification capability and predictive reliability. The MCC for this model was also higher at 0.977, indicating a strong correlation between predicted and actual classifications. Additionally, the 80% split model demonstrated a balanced threat score across classes (32) and minimized error rates with a false negative rate (FNR) of 0.011 and false omission rate (FOR) of 0.012.
Comparatively, the 60% and 70% split models also performed well, but with slight variations. The 60% split model achieved an average accuracy of 96.5% and an AUC of 0.972, showing robust classification but slightly lower predictive power in class precision and recall than the 80% split. The MCC for this model was 0.931, indicating a reliable but lower correlation. The 70% split model displayed a balanced accuracy of 96.1% and an AUC of 0.961, with commendable values in both precision (0.962) and recall (0.961) across classes, but with a slightly higher error rate in FNR (0.039) and FOR (0.037). These findings suggest that the 80% split model optimally balances accuracy and reliability, while the 60% and 70% split models provide solid but slightly less robust predictions.
Table 2
Model performance.
|
Model Performance Matrice- 60% |
Model Performance Matrice- 70% |
Model Performance Matrice- 80% |
|||||||||
|
|
1 |
2 |
Average/ Total |
|
1 |
2 |
Average/ Total |
|
1 |
2 |
Average/ Total |
|
Support |
90 |
82 |
172 |
Support |
63 |
66 |
129 |
Support |
44 |
42 |
86 |
|
Accuracy |
0.965 |
0.965 |
0.965 |
Accuracy |
0.961 |
0.961 |
0.961 |
Accuracy |
0.988 |
0.988 |
0.988 |
|
Precision(Positive Predictive Value) |
0.988 |
0.942 |
0.966 |
Precision(Positive Predictive Value) |
0.983 |
0.942 |
0.962 |
Precision(Positive Predictive Value) |
1.000 |
0.977 |
0.989 |
|
Recall(True Positive Rate) |
0.944 |
0.988 |
0.965 |
Recall(True Positive Rate) |
0.937 |
0.985 |
0.961 |
Recall(True Positive Rate) |
0.977 |
1.000 |
0.988 |
|
F1 Score |
0.966 |
0.964 |
0.965 |
F1 Score |
0.959 |
0.963 |
0.961 |
F1 Score |
0.989 |
0.988 |
0.988 |
|
MCC |
0.931 |
0.931 |
0.931 |
MCC |
0.923 |
0.923 |
0.923 |
MCC |
0.977 |
0.977 |
0.977 |
|
AUC |
0.966 |
0.978 |
0.972 |
AUC |
0.961 |
0.961 |
0.961 |
AUC |
0.989 |
0.989 |
0.989 |
|
Negative Predictive Value |
0.942 |
0.988 |
0.965 |
Negative Predictive Value |
0.942 |
0.983 |
0.963 |
Negative Predictive Value |
0.977 |
1.000 |
0.988 |
|
True Negative Rate |
0.988 |
0.944 |
0.966 |
True Negative Rate |
0.985 |
0.937 |
0.961 |
True Negative Rate |
1.000 |
0.977 |
0.989 |
This study employed SVM analysis to identify factors influencing consumer hotel selection. Across multiple data splits (60%, 70%, and 80% training data), the results consistently demonstrated the vitality of digital elements, particularly eWOM. eWOM consistently showed the highest dropout loss, indicating its significant impact on predictive accuracy and the need for robust online reputation management to increase hotel occupancy. VTT and destination image also emerged as key influential factors. Traditional marketing elements like price and physical evidence showed comparatively less influence.
Dropout loss study across the various training splits revealed a trend: greater training data percentages (e.g., 80%) increased the value of eWOM, VTT, and destination image. For example, in the 80% split, eWOM had a mean dropout loss of 4,469.989, significantly higher than in the 60% (3,387.229) and 70% (3,915.264) splits. This suggests that with more data, the model becomes more sensitive to these factors, requiring greater model attention and adjustment to accurately predict hotel selection. Conversely, factors like “physical” and “price” consistently demonstrated lower dropout losses across all splits, indicating their relatively minor influence on model performance. The consistent prominence of online presence and brand image across all analyses underscores their critical role in predicting consumer hotel choices. The SVM model’s ability to effectively capture nonlinear relationships between these factors makes it a valuable tool for the hospitality and tourism industries.
Table 3
Feature importance metrics.
|
60% |
Mean dropout loss |
70% |
Mean dropout loss |
80% |
Mean dropout loss |
|
eWOM |
3,387.23 |
eWOM |
3,915.26 |
eWOM |
4,469.99 |
|
Promotion |
3,379.24 |
Destination image |
3,888.48 |
VTT |
4,464.27 |
|
Destination image |
3,378.48 |
VTT |
3,886.60 |
Destination image |
4,459.75 |
|
VTT |
3,376.66 |
Promotion |
3,885.60 |
Promotion |
4,413.86 |
|
Place |
3,349.34 |
Place |
3,858.60 |
People |
4,401.79 |
|
Process |
3,338.82 |
Process |
3,856.85 |
Process |
4,400.24 |
|
Product |
3,334.33 |
Product |
3,838.60 |
Place |
4,393.46 |
|
Price |
3,316.50 |
People |
3,838.50 |
Product |
4,361.91 |
|
People |
3,311.47 |
Price |
3,833.58 |
Price |
4,354.84 |
|
Physical |
3,295.47 |
Physical |
3,830.78 |
Physical |
4,350.20 |
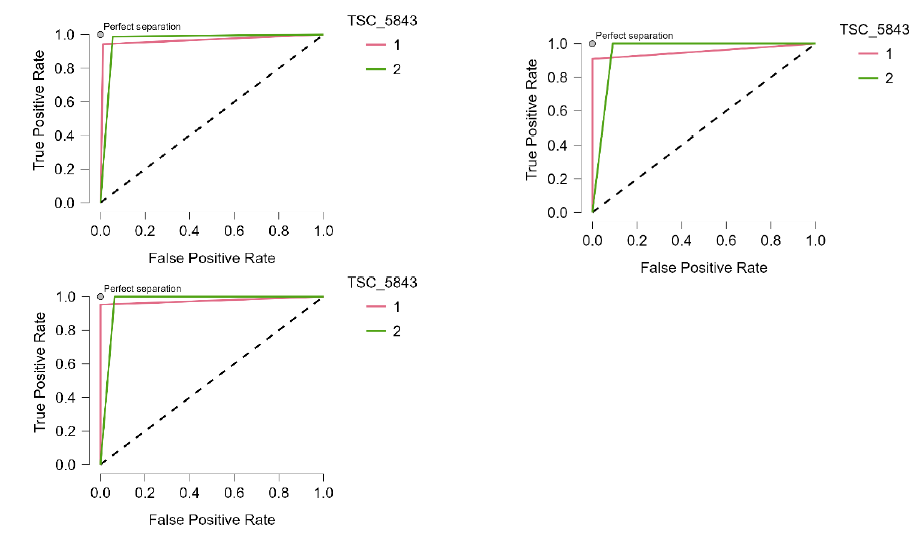
The presented data comprises three distinct ROC curve plots, each representing different percentage thresholds at 60%, 70%, and 80% for the model TSC_5843. These visualization plots demonstrate a comparative analysis between two models, with model 1 depicted in pink/red and model 2 in green. Each plot maintains consistent axis parameters, with the false positive rate on the x-axis and the true positive rate on the y-axis, both ranging from 0.0 to 1.0. The inclusion of a diagonal dashed line serves as a reference point for random chance performance, allowing for easy assessment of model effectiveness.
The performance metrics revealed through these ROC curves indicate exceptional classification capabilities for both models across all percentage thresholds. Model 2, represented by the green line, exhibits marginally superior performance with a steeper ascent in the curves, particularly noticeable in the initial segments. Both models demonstrate impressive true positive rates while maintaining low false positive rates, as evidenced by the curves' proximity to the top-left corner of the plots. The consistency in performance across different percentage thresholds (60%, 70%, and 80%) suggests robust model reliability, with the 80% threshold plot revealing the most distinct separation between the two models' performance curves. This comprehensive visualization effectively illustrates the strong discriminative abilities of both models, with their curves significantly outperforming the random chance baseline.
Figure 1
ROC curves plot: 60% (left); 80% (right); and 70% (bottom).
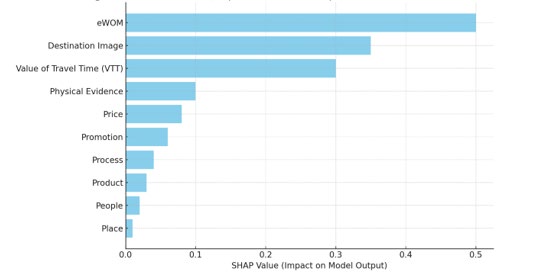
From the analysis of traveler hotel selection data using the SVM model and explained through SHAP, the research shows that the key factors affecting travelers’ hotel selection decisions are eWOM, destination image, and VTT. These factors are graded according to their relevance and impact on the hotel selection model as follows:
1. eWOM: SHAP shows that eWOM has the highest positive impact on hotel selection, where positive scores or reviews from previous travelers significantly affect hotel attractiveness. Travelers tend to choose hotels with good eWOM, resulting in higher SHAP values when reviews are positive. Conversely, negative eWOM results in negative SHAP values and reduces hotel attractiveness.
2. Destination Image: SHAP values indicate that when travelers have a positive perception of destination image, they are more likely to choose that hotel. SHAP shows the distribution of destination image values having the most positive impact when the location has good characteristics such as safety, natural beauty, and local culture.
3. VTT: SHAP values for hotels near tourist attractions or major sites indicate that VTT impacts hotel selection decisions. Conversely, remote locations result in negative impacts. SHAP thus helps visualize the impact of location selection on improving hotel attractiveness.
4. Traditional Factors such as Physical Evidence and Price: Traveler hotel selection is influenced more by digital factors like eWOM and destination image than by price and atmosphere, which do not significantly influence SHAP values.
Figure 2
SHAP Value (impact on model output for the fault classification phase).
DISCUSSION AND ANALYSIS
This study contributes novel insights into the evolving dynamics of hotel selection by demonstrating how digital and experiential elements—particularly eWOM, destination image, and VTT—increasingly overshadow traditional marketing mix components. While existing literature has consistently acknowledged eWOM's significant (Hu and Kim, 2018; Danish et al., 2019; Lee et al., 2022), this research extends these findings by revealing the complex interactions and moderating effects of eWOM in conjunction with destination image and pricing dynamics.
The application of SVM modeling enabled the detection of nonlinear relationships that previous regression-based approaches failed to capture. The SHAP and dropout loss analyses reveal that eWOM’s impact is significantly enhanced in destinations with strong images and moderated by price expectations—patterns that linear or single-factor models cannot adequately represent (Borlido and Kastenholz, 2021; Donthu et al., 2021). The sensitivity of eWOM’s influence across different training data splits (60%, 70%, 80%) further suggests that its significance is not only substantial but also context-dependent, an insight underemphasized in previous machine learning studies.
While prior studies have consistently demonstrated the significance of eWOM in hotel selection (Hu and Kim, 2018; Danish et al., 2019), this research contributes novel insights by revealing how eWOM interacts non-linearly with both destination image and price perception, a relationship often overlooked in linear or regression-based models. Through the use of SVM combined with dropout loss and SHAP interpretability tools, the current study identifies not only the dominant role of eWOM but also its conditional impact depending on destination context and value sensitivity. For instance, the SHAP values illustrate that eWOM has amplified influence in high-image destinations and among travelers with heightened sensitivity to travel time cost, suggesting a moderated effect that enriches the theoretical knowledge of consumer decision-making in the digital era. This study advances theoretical knowledge by treating eWOM as a dynamic, interaction-driven construct that varies based on digital, spatial, and pricing contexts, rather than a static variable with uniform influence.
CONTEXTUAL VARIATIONS IN EWOM INFLUENCE
The research confirms that eWOM’s influence varies significantly by hotel type and geographic context. In urban business centers, brand loyalty and functional attributes often moderate eWOM’s impact, while in leisure-driven markets such as Phuket or Bali, eWOM frequently becomes the decisive factor (Sotiriadis and van Zyl, 2023). These contextual variations have significant strategic implications. For independent hotels and boutique resorts, greater sensitivity to eWOM due to limited brand equity necessitates tailored strategies including post-stay review prompts and personalized guest engagement initiatives. For large hotel chains, investment in real-time sentiment monitoring across multiple languages and platforms is crucial for maintaining competitive advantage (Berezina et al., 2020). There are also platform-specific considerations, as we recognize distinct platform preferences across demographics. Southeast Asian travelers predominantly utilize TripAdvisor and Google Reviews, while Chinese travelers rely on WeChat and Ctrip. This underscores the necessity for localized, multilingual digital reputation strategies tailored to both traveler demographics and regional behavioral patterns.
THEORETICAL CONTRIBUTIONS: REIMAGINING THE MARKETING MIX IN THE DIGITAL ERA
Our research redefines the 7Ps framework through the lens of digital transformation. We demonstrate how digital factors reshape the functional relevance of traditional marketing elements within hotel selection contexts. Product—increasingly evaluated through eWOM, with user experiences functioning as real-time quality indicators rather than static service descriptions. Price—becomes dynamic and reputation-sensitive, as higher ratings justify premium pricing strategies (Li et al., 2023). Place—is no longer solely geographic, visibility on OTAs, search engine rankings, and social media integration now define accessibility and market presence. Promotion—organically driven through user-generated content and eWOM, often outpacing paid media in trust generation and conversion effectiveness.
This study distinguishes itself from earlier works by not merely juxtaposing the 7Ps marketing mix with digital variables but by functionally redefining core marketing mix elements in light of digital transformation. Rather than treating eWOM and destination image as peripheral factors, the research conceptualizes them as structural modifiers within the traditional marketing framework. Specifically, eWOM is integrated as a dynamic, experience-driven extension of “product” that updates in real time and reflects collective quality assessments. Destination image reinforces “place” and “promotion” by shaping emotional resonance and perceived credibility of the offering, and VTT reinterprets “price” from a behavioral economics standpoint, accounting for psychological and opportunity costs. By embedding these digital and experiential elements into an SVM model, this research offers a novel methodological and conceptual framework that reveals non-obvious, interaction-driven pathways of influence. Destination image serves as a contextual amplifier, reinforcing these relationships and shaping how digital signals translate into consumer perceptions. When aligned with strong digital feedback, destination image amplifies all aspects of the marketing mix—strengthening perceived quality, value proposition, location attractiveness, and promotional effectiveness (Chen and Petrick, 2013).
Unlike previous research that incorporated digital variables alongside traditional 7Ps in conceptual or loosely connected frameworks (Kwok et al., 2020; Kalgi et al., 2023), our study provides empirical evidence of how digital factors fundamentally alter the operational dynamics of each marketing mix element. By embedding these variables into a nonlinear SVM classification model and quantifying their interactive effects using dropout loss and SHAP values, the research offers a data-driven integration that provides practitioners with a clearer roadmap for recalibrating traditional frameworks.
METHODOLOGICAL CONTRIBUTIONS AND MODEL PERFORMANCE
The SVM approach provided significant methodological advantages over conventional linear modeling techniques. Its kernel-based architecture proved effective in capturing the nonlinear, multidimensional interactions between traditional and digital variables, offering clearer interpretation of how variables like eWOM and VTT vary across segments and contexts (Pavithra and Saradha, 2024).
Among several data partitioning algorithms, the 80/20 split generated the best results, with 98.8% accuracy and a higher MCC, demonstrating the model’s durability. Dropout loss analysis effectively defined feature relevance, indicating that eliminating eWOM or the destination picture considerably reduced model accuracy. While this method lacks the granularity of SHAP or permutation significance techniques, its intuitive and straightforward interpretation is ideally suited to real hospitality applications.
THEORETICAL FRAMEWORK INTEGRATION
The study’s findings gain deeper theoretical grounding when examined through S-D Logic and SCT. The strong interaction between eWOM and destination image supports S-D Logic's assertion that value is co-created through service encounters and external feedback mechanisms. Travelers’ hotel choices are not based solely on tangible service attributes but on collective interpretations of quality shaped by others’ experiences and perceptions of place. The predictive strength of eWOM aligns with SCT principles, as online reviews serve as digital proxies for observational learning. Travelers internalize these cues as experiential reference points—particularly when unfamiliar with destinations—reinforcing social influence mechanisms in shaping consumer trust and decision-making behavior.
The significance of VTT confirms the role of cognitive trade-offs in decision-making processes. Consumers factor not only price but also convenience and perceived time savings, aligning with utility-maximization behavior from behavioral economics. These theoretical interpretations strengthen the explanation of nonlinear interactions detected by the SVM model and clarify how digital and experiential variables jointly influence decision behavior.
VARIABLE INCLUSION JUSTIFICATION AND FUTURE DIRECTIONS
Although physical evidence received less attention in dropout loss and SHAP analyses, its inclusion was logically and contextually justified. Under the 7Ps marketing framework, physical evidence encompasses tangible service environment components—hotel décor, cleanliness, signage, and visual identity—which continue to influence perceived quality, especially in emerging markets and among first-time travelers (Kwok et al., 2020). Including this factor enabled holistic examination of the 7Ps framework and facilitated comparison between traditional and digital elements. Its low predictive power represents a valuable finding, suggesting a shift in consumer prioritization from physical indicators to digital signals—particularly evident in post-pandemic travel behavior patterns.
CONCLUSION
This study employed support SVM classification to examine the combined influence of marketing mix elements, destination image, eWOM, and VTT on hotel selection decisions. The results demonstrate the robust performance of SVM models across different training split scenarios, with the 80% split model achieving the highest test accuracy of 98.8%. The analysis of dropout loss revealed that eWOM, VTT, and destination image were the most influential factors, suggesting that hotels should prioritize online reputation management, destination marketing partnerships, and location-based strategies to effectively attract and retain travelers. While traditional elements such as physical evidence and pricing were less significant, SVM models’ consistent performance across different training data sizes emphasizes the need of balancing varied choice factors in hospitality marketing.
IMPLICATIONS
The findings of this study offer several practical and actionable implications for hotel management and marketing strategies, tailored to the size of the establishment and the level of market competition.
1. REPUTATION AND DATA-DRIVEN MANAGEMENT
Given the strong impact of eWOM on traveler decision-making, digital reputation management must be a strategic priority for hotels of all sizes. Managers should regularly monitor reviews on platforms such as Google, TripAdvisor, Booking.com, and local OTAs, and respond promptly and professionally to both positive and negative feedback. This practice signals transparency and commitment to service excellence, reinforcing guest trust.
Moreover, leveraging advanced analytics tools such as SVM, sentiment analysis, and topic modeling can empower hotels to extract actionable insights from large volumes of unstructured review data. For instance, identifying recurring complaints such as check-in delays or room cleanliness issues can guide targeted operational enhancements, while consistently positive feedback on aspects like staff friendliness or breakfast quality can be strategically integrated into digital marketing content. These insights allow hotels to tailor their services and promotional efforts more effectively, reinforcing brand value and aligning with guest expectations.
To support these efforts, hotels should implement a structured digital reputation management framework. This includes deploying AI-powered monitoring tools like ReviewPro, Rezview, or Google My Business Insights to track guest sentiment across review platforms in real time. A standardized response protocol, ideally with a 24-hour turnaround, ensures timely and professional engagement with feedback. Integrating sentiment analysis using natural language processing (NLP) helps pinpoint problems and prioritize improvements. Additionally, staff training is essential to ensure frontline employees comprehend the impact of their interactions on online reviews and brand image. Establishing feedback loops enables data-driven decision-making in areas such as pricing, promotions, and service upgrades. Finally, collaborating with destination marketing organizations (DMOs) to co-create campaigns that merge destination branding with authentic guest testimonials can amplify reach and enhance perceived credibility.
Hotel managers can implement several strategies right away. They can adopt automated review response systems, like ReviewPro, to efficiently monitor and reply to guest feedback in real time. Utilizing sentiment analysis tools powered by NLP can help identify underlying trends and recurring issues in guest reviews, which can then guide targeted service improvements. Managers should also design shareable guest experiences, such as personalized welcome notes or visually appealing amenities, to naturally encourage user-generated content and social sharing. Finally, fostering collaboration with DMOs can lead to co-created marketing campaigns that align hotel offerings with broader destination narratives, enhancing both authenticity and market reach.
2. PRACTICAL IMPLICATIONS BY HOTEL SEGMENT AND MARKET COMPETITION
This study provides specific, segment-based strategies for hotel management, moving beyond general advice to offer actionable insights tailored to different hotel types and market conditions. These context-specific actions enable hotels to translate data into strategy, aligning with current best practices in digital service design and competitive brand positioning.
STRATEGIES FOR LARGE HOTELS (200+ ROOMS)
Large hotels, benefiting from significant resources, are well-positioned for advanced technological adoption and comprehensive guest management. In highly competitive markets, they should deploy AI-powered sentiment tracking tools to flag urgent issues in real-time, enabling proactive service recovery. To differentiate their offerings, these hotels can utilize immersive technologies such as virtual reality tours and 360° videos that showcase unique amenities. Furthermore, developing personalized customer relationship management-linked loyalty programs can significantly boost guest retention and foster brand allegiance.
In contrast, in moderate or low-competition markets, the focus should shift towards efficiency and an enhanced guest experience. Hotels can streamline operations using chatbots and mobile applications for common inquiries and check-ins. Additionally, establishing dedicated guest experience teams to deliver exceptional, personalized service, built on direct interactions, will be key.
STRATEGIES FOR MEDIUM-SIZED HOTELS (50–200 ROOMS)
Medium-sized hotels benefit from a strategic balance between operational capacity and the ability to maintain a personalized touch. In highly competitive markets, they should launch targeted campaigns for niche audiences (e.g., digital nomads, eco-conscious travelers) to carve out a distinct market position. To manage online feedback efficiently while maintaining engagement, they can use semi-automated review response tools. In moderate or low-competition markets, the focus shifts to combining cost-efficient promotions with personalized touchpoints, such as curated itineraries or local recommendations. To amplify organic reach and credibility, these hotels should incentivize user-generated content through social media contests or small in-stay rewards.
STRATEGIES FOR SMALL INDEPENDENT HOTELS (<50 ROOMS)
Small independent hotels thrive on unique character and intimate guest experiences, often with more agile operations. In high-competition markets, differentiate through strong storytelling centered around local culture, historical significance, or sustainability initiatives. Partner with local businesses to co-create unique, authentic guest experiences that provide added value beyond the stay. In moderate or low-competition markets, emphasize homegrown hospitality through personalized offerings like complimentary local meals, guided walks, or cultural exchanges. Strengthen word of mouth marketing with referral rewards or by hosting community events that foster a sense of belonging.
UNIVERSAL STRATEGIES FOR ALL HOTEL TYPES
Regardless of size or market competition, all hotels should focus on leveraging eWOM and destination image. Implement low-cost automated tools (e.g., Google Alerts, ReviewPro Lite) to monitor reviews in real time. Encourage satisfied guests to leave feedback at checkout by offering small incentives (e.g., a free drink or discount code). Furthermore, collaborate with DMOs to co-create digital storytelling content using verified guest testimonials, which enhances both destination image and eWOM credibility.
3. INTEGRATE LOCATION-BASED MARKETING
Hotels should align digital messaging with their location advantages to strengthen their value proposition. Emphasize location in search engine optimization strategies (e.g., “hotel near Wat Thatphanom”). Emphasize ease of access through visual storytelling on platforms like Instagram or TikTok. Promote high-speed Wi-Fi, meeting rooms, or transport services for properties near business hubs. Collaborating with DMOs can further enhance these efforts. Co-developed itineraries or stay packages combining accommodation with local experiences not only increase value perception but also broaden marketing reach via DMO channels.
4. UNIFYING TRADITIONAL AND DIGITAL MARKETING
Hotels should treat digital and offline strategies as components of a cohesive marketing ecosystem. For instance, a luxury property can enhance its online presence by encouraging guests to share offline experiences—like personalized welcome amenities—on social media. This convergence of physical experience and digital amplification builds a more powerful and authentic brand image. In parallel, partnerships with DMOs can focus on shared values such as sustainability or heritage preservation, reinforcing both the destinations and the hotel’s credibility (Can et al., 2023).
LIMITATIONS AND FUTURE RESEARCH
While the SVM-based findings of this study provide valuable insights into the predictors of hotel selection, the use of cross-sectional data imposes a key limitation. Traveler decision-making behavior—especially related to digital factors such as eWOM and destination image—is inherently dynamic and may evolve over time due to seasonal trends, promotional campaigns, or platform algorithm changes. As such, the current findings capture patterns at a single point in time, and may not fully reflect temporal variations in consumer preferences.
To address this limitation, future studies should adopt longitudinal or panel data designs to examine the impact of eWOM and other variables across time. This would enable researchers to assess trend stability, platform effects, and delayed decision-making behaviors, thereby improving the predictive accuracy and practical applicability of hospitality marketing strategies.
REFERENCES
Bandura, A. (2001). Social cognitive theory: An agentic perspective. Annual Review of Psychology, 52, 1–26. https://doi.org/10.1146/annurev.psych.52.1.1
Berezina, K., Ciftci, O., & Cobanoglu, C. (2019). Robots, artificial intelligence, and service automation in restaurants. In: Ivanov, S. & Webster, C. (Ed.), Robots, Artificial Intelligence, and Service Automation in Travel, Tourism and Hospitality, (pp. 185-219). Emerald Publishing Limited, Leeds, https://doi.org/10.1108/978-1-78756-687-320191010
Bordian, M., Fuentes-Blasco, M., Gil-Saura, I., & Moliner-Velázquez, B. (2024). Technology and innovation: Analyzing the heterogeneity of the hotel guests’ behavior. Journal of Theoretical and Applied Electronic Commerce Research, 19, 1599–1615. https://doi.org/10.3390/jtaer19020078
Borlido, T., & Kastenholz, E. (2021). Destination image and on-site tourist behaviour: A systematic literature review. Revista Turismo & Desenvolvimento/Journal of Tourism & Development, 1(36), 63–80. https://doi.org/10.34624/rtd.v1i36.8405
Can, A. S., Ekinci, Y., & Dilek-Fidler, S. (2023). Do Blue Flag promotions influence tourists’ willingness to pay a price premium for coastal destinations? Tourism Management, 98, 104767. https://doi.org/10.1016/j.tourman.2023.104767
Chaiyarat, N., & Setthasomboon, P. (2022). Take a look… Northeastern service sector, a new opportunity that must be seized. Bank of Thailand, Northeastern Office.
Chen, C.-C., & Petrick, J. F. (2013). Health and wellness benefits of travel experiences: A literature review. Journal of Travel Research, 52(6), 709-719. https://doi.org/10 .1177/00 4728751 3496477
Danish, R. Q., Hafeez, S., Ali, H. F., Shahid, R., & Nadeem, K. (2019). Impact of online consumer reviews on hotel booking intentions: The case of Pakistan. European Scientific Journal, 15(7), 144. https://doi.org/10.19044/esj.2019.v15n7p144
De Nisco, A., Mainolfi, G., Marino, V., & Napolitano, M. R. (2015). Tourism satisfaction effect on general country image, destination image, and post-visit intentions. Journal of Vacation Marketing, 21(4), 305–317. https://doi.org/10.1177/1356766715577502
Donthu, N., Kumar, S., Pandey, N., & Mishra, A. (2021). Mapping the electronic word-of-mouth (eWOM) research: A systematic review and bibliometric analysis. Journal of Business Research, 135, 758–773.
Filieri, R., Lin, Z., Pino, G., Alguezaui, S., & Inversini, A. (2021). The role of visual cues in eWOM on consumers’ behavioral intention and decisions. Journal of Business Research, 135, 663–675.
Gupta, S. (2022). The influence of user-generated content on consumer purchase decisions: An empirical study. International Journal of Early Childhood Special Education, 14(5), 8918-8922. https://doi.org/10.48047/intjecse/v14i5.1151
Habibzadeh, F. (2017). Statistical methods for medical research. Elsevier.
Hu, Y., & Kim, H. J. (2018). Positive and negative eWOM motivations and hotel customers’ eWOM behavior: Does personality matter? International Journal of Hospitality Management, 75, 27–37.
İnan, H. E. (2024). Comparison of machine learning algorithms for classification of hotel reviews: Sentiment analysis of TripAdvisor reviews. GSI Journals Series A: Advancements in Tourism, Recreation and Sports Sciences, 7(1), 111-122.
Isernia, S., Rossetto, F., Shamay-Tsoory, S., Marchetti, A., & Baglio, F. (2023). Standardization and normative data of the 48-item Yoni short version for the assessment of theory of mind in typical and atypical conditions. Frontiers in Aging Neuroscience, 14, 1048599. https://doi.org/10.3389/fnagi.2022.1048599
Jain, J., & Lyons, G. (2008). The gift of travel time. Journal of Transport Geography, 16(2), 81-89. https://doi.org/10.1016/j.jtrangeo.2007.05.001
Kalgi, D., Hire, J., & Dhole, V. (2023). A study on the role of 7ps of service marketing in the hospitality and tourism industry. Environmental, Industrialization, Management, Economics, Agriculture, Rural and Urban Development Towards Sustainable Potential, 1, 117-182.
Kalkbrenner, M. T. (2021). Alpha, Omega, and H internal consistency reliability estimates: Reviewing these options and when to use them. Counseling Outcome Research and Evaluation, 14(1), 77–88. https://doi.org/10.1080/21501378.2021.1940118
Kasikorn Research Center. (2023). In 2024, hotel and accommodation revenues have continued to improve, but competition is fierce and the recovery is not uniform. https://www.kasikornresearch.com/th/analysis/k-social-media/Pages/Hotel-CIS3489-FB-08-05-2024.aspx
Kim, K., Hallab, Z., & Kim, J. N. (2012). The moderating effect of travel experience in a destination on the relationship between the destination image and the intention to revisit. Journal of Hospitality Marketing & Management, 21(5), 486–505. https://doi.org/10.1080/19368623.2012.626745
Kim, Y-S., & Park, J-W. (2017). A study on the impact of online word-of-mouth for airlines on customer behavior. The Open Transportation Journal, 11, 81-89. https://doi.org/10.2174/1874447801711010081
Kwok, L., Tang, Y., & Yu, B. (2020). The 7 Ps marketing mix of home-sharing services: Mining travelers’ online reviews on Airbnb. International Journal of Hospitality Management, 90, 102616. https://doi.org/10.1016/j.ijhm.2020.102616
Kyriazos, T., & Poga, M. (2023). Dealing with multicollinearity in factor analysis: The problem, detections, and solutions. Open Journal of Statistics, 13, 404-424.
Le, H. T. P. M., & Ryu, S. (2023). The eWOM adoption model in the hospitality industry: The moderating effect of the vlogger’s review. Journal of Hospitality and Tourism Technology, 14(3). https://doi.org/10.1108/JHTT-08-2021-0233
Lee, W. L., Liu, C. H., & Tseng, T. W. (2022). The multiple effects of service innovation and quality on transitional and electronic word-of-mouth in predicting customer behavior. Journal of Retailing and Consumer Services, 64, 102791.
Li, J., Shi, J., Liu, Z., & Feng, C. (2023). A parallel and balanced SVM algorithm on spark for data-intensive computing. Intelligent Data Analysis, 27, 1-22. https://doi.org/10.3233/IDA-226774
Pavithra, C., & Saradha, M. (2024). Classification and analysis of clustered non-linear separable data set using support vector machines. Migration Letters, 21(S4), 901-913.
Shadeed, S., Judeh, T., & Riksen, M. (2020). Rainwater harvesting for sustainable agriculture in high water-poor areas in the West Bank, Palestine. Water, 12(2), 380. https://doi.org/10.3390/w12020380
Soper, D. S. (2024). A-priori sample size calculator for structural equation models. https://www.danielsoper.com/statcalc
Soteriades, M., & Van Zyl, C. (2013). Electronic world-of-mouth and online reviews in tourism services: The use of twitter by tourists. Journal of Electronic Commerce Research, 13, 103-124. https://doi. org/10.100 7/s10660-013-9108-1
Vargo, S. L., & Lusch, R. F. (2004). Evolving to a new dominant logic for marketing. Journal of Marketing, 68(1), 1-17. https://doi.org/10.1509/jmkg.68.1.1.24036
Verma, S., & Yadav, N. (2021). Past, present, and future of electronic word of mouth (EWOM). Journal of Interactive Marketing, 53, 111–128.
Wang, H., & Yan, J. (2022). Effects of social media tourism information quality on destination travel intention: Mediation effect of self-congruity and trust. Frontiers in Psychology, 13, 1049149. https://doi.org/10.3389/fpsyg.2022.1049149
Yoo, K.H. & Gretzel, U. (2011). Influence of personality on travel-related consumer-generated media creation. Computers in Human Behavior, 27, 609-621. https://doi.org/10.1016/j.chb.2010.05.002