ABSTRACT
The formation of social networks within urban environments is influenced by a multitude of factors, including the presence of various systems and spatial formations. These elements contribute to the emergence of distinctive patterns and configurations within these networks. Considering the social, economic, and geographical characteristics that define these networks, it is evident that the formation of “small worlds” is a tangible phenomenon. This phenomenon gives rise to new patterns and flows that diverge from the spatial structure. In consequence, the relationship between social networks and spatial formations presents a system in which each affect and shape the other. The aim of this study is to evaluate the forms and patterns of small-world networks created by social communities using multi-agent simulation. The simulation was prepared in NetLogo using the parameters and methodology of Stanley Milgram’s “Small-World Problem Experiment”. The simulation was tested in four different scenarios. The findings reveal that as constraints and distances within the network increase, the structure becomes longer (i.e., exhibits a higher degree of separation) and less connected. The influence of social status on clustering patterns is more significant than geographical distances. Consequently, this results in the emergence of nodes becoming more bridged within the network, as indicated by elevated levels of betweenness centrality. The value of the degrees of separation calculated in the ideal simulation scenario was found to be aligned with the examples presented in the literature. In this context, comments were developed within the framework of urban planning.
Keywords: Social network patterns, Small-world networks, Multi-agent simulation, Urban environments, NetLogo.
INTRODUCTION
As a human-made system, cities embody abstract knowledge of economic, social, and political spaces, and are shaped by networks of relations. Social reality is continuously produced on the space-time axis by agents’ daily experiences (Lippuner and Werlen, 2009, p. 39). From this point of view, the city is a social cluster product. In the context of cybernetics, social clusters act as “influencers” and cities can be regarded as “effects” resulting from the influencing process (Latil, 1953). From a teleological perspective, an “influencer” must possess a purpose to be effective. Pittendrigh (1958, pp. 394–395) posits that the fundamental objective of organizational structure among living organisms is the maintenance of continuity. Similarly, (Laborit, 1961) elucidates this purpose as ensuring the continuity of human relationship clusters in a less complex environment. Cities are a means of achieving this goal. In broader terms, an examination of the origin of cities reveals them to be a means of ensuring the continuity of human relationship clusters within communities (Hill, 1993). Piaget and Inhelder (1948, p. 393) offer a critique of the individualist approach, asserting that all events and phenomena occurring in space manifest at the societal and community levels. The individual, on this view, is regarded as an atomic passive reflection within these larger phenomena. Mayhew (1980, pp. 341–343; 1981, p. 636) develops his interpretation of social relations through a network analysis approach. According to this approach, the relationship and/or flow network structures formed by the activities of communities in certain locations or spaces will determine the strengths or weaknesses of societies. Mayhew’s views integrate spatial mobility and social relations, aligning the level of social structures with the organization of networks. Laborit (1971, pp. 22–23, 27) proposes that cities become an integral component of the system, rather than merely a tool shaped by the strength of social networks (see figure 1) and summarizes the concept as follows:
“The city is not a living entity in and of itself; rather, it is one of the instruments utilized by a social entity to regulate and maintain its own structure.”
Figure 1
Influence- configuration schema for the relationship between social clusters and the urban area, based on Laborit (1971, p. 23).

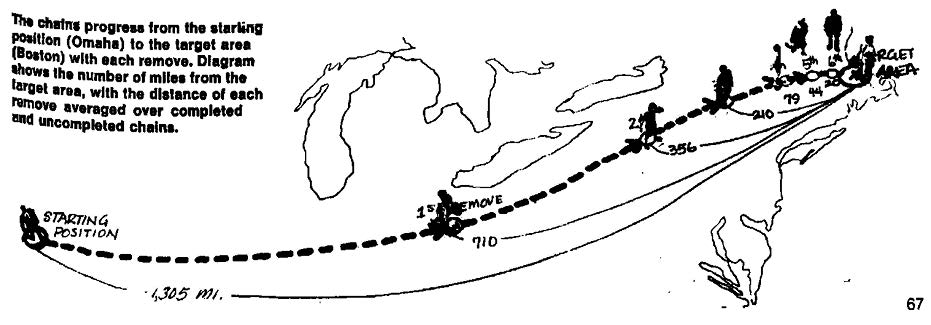
Urban areas reflect the social structure, with networks of communities forming an integral part of this reflection. The deepening of social strata and the expansion of networks of relations have a profound effect that extends beyond the concrete urban environment, uniting disparate societies (Şeker, 2015). The “shrunken worlds” that emerge differ from the Euclidean worlds[1] with which we are familiar, where distances are measured mathematically. Access to different people or communities will become increasingly independent of the geographical dimension (Barabási, 2014, p. 40). One of the earliest discourses on this subject was presented by Frigyes Karinthy in 1929 in his work, “Chain-Links.” Karinthy posited that as the possibilities for physical and verbal communication/interaction increase, the world will begin to “shrink,” and the networks of relationships between people will become more complex. The results of this hypothetical experiment indicate that in a shrinking world, a person can reach any other person after traversing a maximum of five links (Karinthy, 1929, pp. 21, 25–26). A similar study conducted by (Gurevitch, 1961, pp. 251–252) determined that communication between two groups can be achieved with a minimum of five links. One of the most significant findings of the study is that socioeconomic status, rather than geographical distance, is the primary factor influencing the extent and duration of communication. The most renowned study on this topic is Stanley Milgram’s “The Small-World Problem” experiment (see figure 2). In this experiment, Milgram examined the probability of a person reaching a randomly selected target in a shrinking world and densifying complex networks. The mean number of links established between two randomly selected individuals from two geographically and socially disparate cities was found to be six (Milgram, 1967, p. 67). In other studies that describe the experiment, factors such as gender, socioeconomic status, and the level of acquaintance of individuals are effective in the selection of links (Milgram, 1969; Travers and Milgram, 1969).
[1] The term “Euclidean worlds” refers to spatial systems based on Euclidean geometric principles, where physical distances can be measured and calculated using straight lines and mathematical formulas. In traditional physical space, the shortest distance between two points is represented by a straight line, following Euclidean geometry. However, in the context of social networks and small worlds, these mathematical distances lose their significance as social connections and relationships become more important than physical proximity.
Figure 2
Concept schema of the Small-World Problem (Milgram, 1967, p. 67).
Although there are debates about the accuracy or validity of the Milgram Experiment,[2] it presents two important findings: (1) An individual is capable of establishing connections and fostering relationships with others in order to expand their social network to encompass individuals in distant locations, and (2) While the impact of geographical distance on social interactions has diminished, the potential for either convergence or divergence in social groups remains significant. To elaborate further, the advent of space-dependent transportation systems has served to diminish the significance of conventional boundaries, thereby facilitating the mobility of social groups. However, the expansion and contraction of social clusters in urban areas gave rise to new abstract boundaries contingent on social status (Rand, 1964).[3] It is noteworthy that this issue was addressed in the 1960s, preceding the advent of globalization-era debates (Lash and Urry, 1987, pp. 293–294; 1994, pp. 13–16). These debates highlighted the impact of transportation and communication on the fluidity of space.[4]
[2] See Guiot (1976) and Kleinfeld (2002).
[3] The decisions that individuals make on issues have the potential to either foster cohesion or disunity within communities, and ultimately, at the societal level. The primary reason for this phenomenon is the predisposition of individuals facing similar challenges to collaborate to find solutions (Bikhchandani et al., 1998, p. 152). The benefits that potential associations offer in the form of abstract or tangible rewards encourage collective action and the growth of relationship networks (Banerjee, 1992, pp. 801, 812). The expansion of social boundaries gives rise to the formation of distinct social clusters, which create abstract (invisible) boundaries for those who are not part of these clusters.
[4] The study of small worlds also represents a significant area of inquiry within the domains of social and anthropological research (Watts, 1999, p. 524).
The phenomenon of “small worlds” emerging after the Milgram Experiment has been subject to empirical investigation in both real and simulated environments (Schnettler, 2009). de Sola Pool and Kochen (1978) asserted that randomly selected pairs can frequently be linked by chains of only a few agents, and that the world as we know it can likely be described as a “small world.” Watts and Strogatz (1998, pp. 441–442) found that different types of network structures (in biological, social and technological themes) create small worlds within themselves. These findings align with the existing literature, indicating that small world network clusters exhibit reduced edge and node counts but enhanced organization and density. Dodds et al. (2003, p. 827) conducted a replication of the Milgram Experiment in an electronic environment. The experiment involved approximately 60,000 users and revealed that an average of five to seven links could be established between users. The formation of links was found to be influenced by two main factors: geographical and socioeconomic (occupational) proximity between users. Leskovec and Horvitz (2008) analyzed approximately 30 billion conversations of 240 million people in the Microsoft Messenger instant-messaging system. As with Milgram’s findings, the shortest path between any two nodes in the network (degree of separation) was found to be six. As the geographical distance between users increases, communication and network density decrease. However, users can create small-world networks among themselves according to the “homophily” effect (i.e., the tendency of individuals to form connections with others who are similar to them in terms of social and cultural characteristics).
Bakhshandeh et al. (2011) conducted a study to quantify the degree of separation of Twitter users. Upon analysis of the interaction between users and mutual follow-ups of profiles, the separation value was found to be 3.43. Similarly, Szüle et al. (2014) and Ch’ng (2015) demonstrated that the act of sharing content on Twitter can facilitate the formation of coordinated social movements, which may in turn give rise to small-world networks of individuals and communities. As stated by Szüle et al. (2014, p. 2), geographical location is a significant factor influencing the interaction between users, with a resulting degree of separation of 4.95. In contrast to previous studies, Goodrich and Ozel (2022) examined the small-world network phenomenon with road patterns. According to the Neighborhood Preferential Attachment model, the evaluation revealed that small worlds were formed in hypothetical user flows in road networks, in accordance with Milgram’s findings.
The phenomenon of “small worlds” can also be analyzed as a transitive graph. In other words, the small world network is a graph characterized by a high clustering coefficient and low distances (Porter, 2012). The term “small” is not used in reference to the number of participants or agents involved, but rather to indicate the proximity of the networks in comparison to one another (Alchalabi, 2021; Watts, 1999, p. 495). In this regard, the most salient characteristics that differentiate small-world networks (see figure 3) from others are their integrated structure and their
self-organization (Neal et al., 2015, pp. 182–183).
Figure 3
Network configuration types (Neal et al., 2015, p. 183).
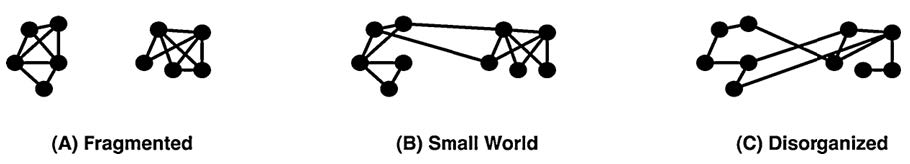
Amaral et al. (2000) identified three types of small-world networks: (1) Scale-free networks: networks exhibiting a decreasing connectivity level in accordance with the power law, (2) Broad-scale networks: networks displaying a sharp discontinuity of connectivity, (3) Single-scale networks: networks exhibiting a decreasing connectivity level, such as exponential or Gaussian. These three distinct models are predicated on the cost of establishing new connections within the network and the potential for nodes to lose their influence over time. In conclusion, a small-world network is a collection of nodes and links. The merging structure of networks is conducive to creating the shortest distance, facilitating a high clustering effect, and providing balancing (Ch’ng, 2015, p. 34; Holland and Leinhardt, 1971, pp. 107, 123; Rapoport, 1963, p. 533). Furthermore, agents demonstrate deliberate efforts to optimize the efficacy of their network connections (Jing, 2021). In order to statistically analyze small-world networks, three main components are employed (Watts, 1999, p. 498; Uzzi and Spiro, 2005, p. 453). The three main components used to statistically analyze small world networks are as follows: (1) L: the average path length,[5] (2) C: the clustering coefficient, and (3) Q: the small world quotient (which is C/L). The primary distinction between small world networks and other network topologies is that L is relatively low while C is high. In this regard, it can also be characterized as a concentrated and homogeneous pattern. Kleinberg (2000a; 2000b) incorporated distance and time components into the decentralized algorithmic framework. The length of the distance affects the level of homogeneity of the network structure and the potential for small-world formation over time (Fraigniaud, 2007, p. 4; Lattanzi et al., 2011). In their study, Uzzi and Spiro (2005, pp. 492–493) identify the small-world phenomenon but note that small-world network performance shows a strong effect up to a threshold value.[6] As the network density coefficient value increases, connectivity and cohesion also increase. This phenomenon is referred to as the “effective dimension” by Newman and Watts (1999, pp. 7–8). The construction and analysis of network structure allows the analysis of the sociometric structure of an urban community[7] (Holland and Leinhardt, 1977, pp. 417–418). In addition, small world networks can be used as a framework for analyzing the interaction networks of complex systems (Amaral et al., 2000).
[5] See also Newman & Watts (1999, p. 1).
[6] Similar findings are reported by Ingram & Roberts (2000) and Rao et al. (2001). The formation of homogenous network groups is influenced by factors such as socioeconomic status, friendship level, and the presence of a common culture.
[7] Furthermore, it has been identified as a key factor influencing social behavior (Uzzi & Spiro, 2005, p. 448).
The aim of this study is to evaluate the formation and patterns of small-world networks created by social communities through multi-agent simulation. In a broader sense, the aim is to evaluate the formation processes of social networks in a simulative and randomized urban environment. In this context, the approach used by Milgram in his experiment was taken into consideration, and a simulation environment was prepared by developing it with various parameters. Based on the results obtained, evaluations were conducted on the factors affecting social networks and their environments. These results were then discussed within the framework of urban environment-urban planning. This study offers a unique simulation model that considers geographical and social distance parameters together, a feature that distinguishes it from extant literature on the subject. The model, developed in the NetLogo environment, tests the formation of small world networks through different scenarios where these parameters can be active/passive. In this way, the formation of small world networks can be evaluated with multiple tests. Furthermore, a comparative analysis of metrics is expected to offer alternative insights into the city-network relationship. The study is expected to contribute to literature in terms of the simulation, its components and findings.
METHODOLOGY
The multi-agent simulation developed as part of the study was constructed using the NetLogo coding language and the same software environment. The fundamental components of the simulation are presented below, with all values generated randomly within the system:
Friend: Based on Milgram’s Experiment, the basic behavior of agents is to reach a target, but first to reach a friend.
Target: Agents have a main target which they have to reach.
Location information: Agents have a “geographical location” feature, which is expressed as a random number. The difference between locations (difference between numerical values) represents the distance between agents. This situation, which Milgram refers to as “geographical distance”, will affect the speed of the agent in the initial movement to reach his friend, and therefore it is a factor that will create differentiation in the formation of networks.
Social status information: Agents have the “friendship level” feature, which is expressed with a random number. The difference between levels (difference between numerical values) expresses the level of social relationship between agents. This situation, which Milgram refers to as “social distance”, will affect the speed of the agent in the initial movement to reach his friend, and therefore a factor that will create differentiation in the formation of networks.
Speed: The speed value, which varies according to components (c) and (d), is considered a feature in the movement of agents and in the process of reaching the target. Agents with higher speeds reach the destination faster, while agents with less speed reach the destination more slowly. This situation ultimately changes the formation process of networks.
In the simulation based on the Milgram Experiment, each agent is associated with two distinct entities: a friend and a target. Agents initially establish contact with their friends at a speed value contingent upon their geographical and social status levels. The connected friend—defined in the same way—connects with its friend and the process proceeds in this way, and the process continues in a similar manner. When the first agent successfully connects with its target as a result of this chain relationship, the success condition is met. It should be noted that no agent possesses the same friend and target values (see code block 1 and figure 4).
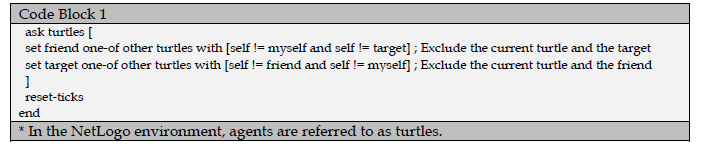
Figure 4
Concept schema of the methodology.
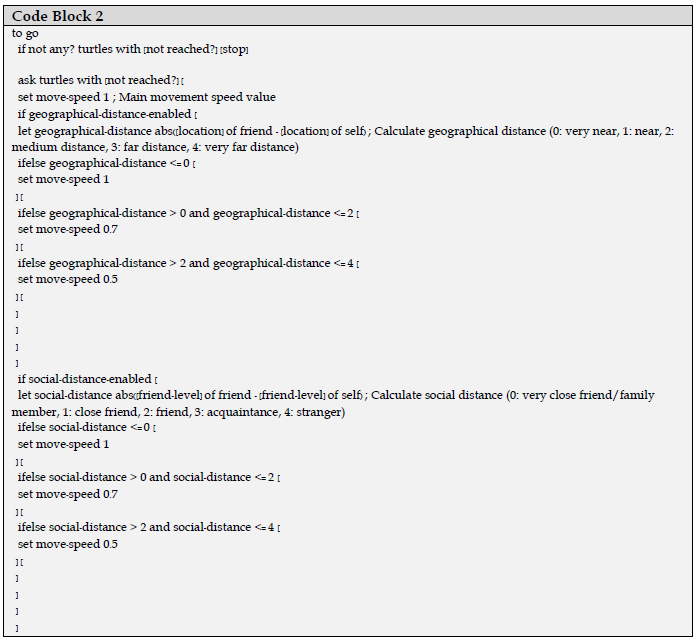
The simulation is differentiated from other examples by its geographical and social status[8] levels, with the objective of creating an urban environment.[9] In accordance with existing literature, there are abstract boundaries and distances between users in an urban environment based on social groups as well as geographical distances. Consequently, communication/interaction between groups varies in a certain (t) time. These two-level values can be activated or deactivated within the simulation. The optimal scenario is one in which no level discrepancy exists between any agents; however, experiments can be conducted in disparate scenarios. Agents are assigned a value between 0 and 4 for geographical and social status levels, and the speed level of users varies according to the value of this difference between the agent and its friend (see code block 2).
[8] Based on Castro et al. (2023) & Haslam (1994).
[9] As discussed in the introduction, scholars (Hill, 1993; Laborit, 1961; Mayhew, 1980; Şeker, 2015) argue that concentrated and hierarchical social networks centered on small worlds can occur in urban environments. The term “urban environment” used in this study refers to an environment where there are concentrated networks, interpersonal relations come to the fore, and where these networks form a “structure” rather than a physical space defined by infrastructure and transportation networks.
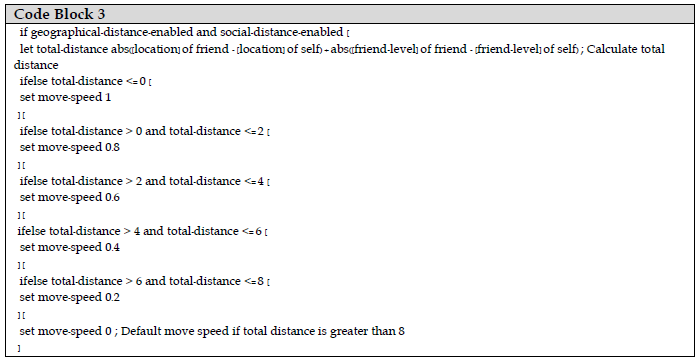
If a simulation scenario incorporating both aforementioned levels is implemented, the speed of the agents is contingent upon the total distance component (see code block 3).
In order to evaluate the performance of the simulated small-world networks, a series of metrics have been used. The simulation was evaluated in accordance with the outlined methodology, and the findings are presented in the subsequent section. The specific contents and formulas of these metrics are provided below for reference.
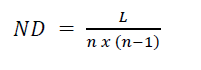
Network Density [ND]: Bott (1957) proposes a classification of network topologies into two principal categories: (1) tightly knit and (2) loosely knit. Networks with a high degree of interconnectivity are characterized by a robust structure. The network density value is calculated as a result of a mathematical analysis of the network structure and expressed as a percentage (Barnes, 1969, p. 220). While the network density value varies depending on the specific network topology, it is typically expressed as low density from 0-0.3, medium density from 0.3-0.7, and high density from 0.7-1.0 (Matni, 2021).
Equation 1
L: sum [link-count] of agents, n: count of agents.
Degree of Separation [DoS]: The term “degree of separation” is used to quantify the social distance between individuals. In other words, it demonstrates the number of connections an agent makes to reach its target, as proposed by Milgram (1967). Also see Heikkinen (2021).
Equation 2
SP: set of successful pairs (agents with happy face).

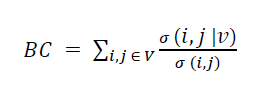
Mean Betweenness Centrality Value [BC]: Betweenness is defined as the extent to which a node in a network structure lies between all other nodes (Marsden, 1983, pp. 689-695). A node with high betweenness centrality can be conceptualized as a “bridge” between other nodes in the entire system. In this regard, high betweenness centrality in a network system is indicative of an integrated and highly fluid structure (Brandes, 2001; Hwang et al., 2006).
Equation 3
σ (i,j): total number of shortest paths from node i to node j, σ (i,j │v): the number of those paths that pass-through v (not where v is and endpoint).
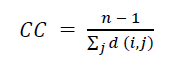
Mean Closeness Centrality Value [CC]: Closeness centrality represents a primary method for identifying nodes that can effectively manage and direct flows within a network topology. The CC of a node is calculated as the average distance from all other nodes. Nodes with a high centrality value are connected to other nodes at the shortest distance, resulting in the lowest access cost and the highest spillover (Okamoto et al., 2008).
Equation 4
d(i,j): total distance between nodes i and j in the system.
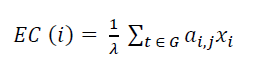
Mean Eigenvector Centrality Value [EC]: Eigenvector centrality is a measure of the centrality level of a node, which is determined by the strength of its interactions with other nodes. It is important to note that a node with a high eigenvector centrality does not necessarily indicate a high level of connectivity to all other nodes. Nevertheless, nodes with high values are situated in closer proximity to pivotal central locations within the topology (Bamakan et al., 2019). Eigenvector centrality can also be conceptualized as a prestige score. Nodes with high scores are linked to other nodes with high scores. Consequently, both the connectivity level of a node and the quality of other nodes to which it is connected are evaluated (Negre et al., 2018).
Equation 5
λ = eigenvalue of the adjacency matrix, a(i,j) = value in the adjacency matrix corresponding to nodes i and j, x(i) = eigenvector centrality value of node i.
Successfully Connected Agent Count [SC]: Number of nodes (agents) that succeeded in the simulation.
Equation 6
h: count of agents with happy face.
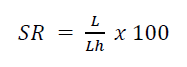
Success Rate (Link Count) [SR]: Number of successful links as a result of the simulation.
Equation 7
Lh: sum [link-count] of agents with happy face.
Link-Count Value [TL]: The total number of links formed between agents as a result of the simulation.
Equation 8
FINDINGS AND DISCUSSION
The simulation has been tested in four different scenarios. The content of the scenarios is described below, and the simulation results are analyzed in terms of the pattern forms of the resulting networks and metrics.
Scenario 1 (S1) is the ideal scenario where geographical and social distance parameters are not considered. In other words, there is no difference in social status or geographical distance between any of the agents in an environment. It is important for simulating and monitoring the performance of network formation without any factors. S1 provides a baseline for comparison with other scenarios, allowing a clearer understanding of the effects of distance parameters on network formation. The term “ideal” is used here as a baseline comparison scenario, not as a perfect scenario.
Scenario 2 (S2) is significant for monitoring a situation that closely resembles the actual urban environment, where both parameters are considered.[10] In particular, the comparison between scenarios 1 and 2 can facilitate an evaluation of the relationship between mechanical and organic solidarity, as conceptualized by Durkheim (1964). An environment where interaction is shaped strongly or weakly over time depending on social differences (organic solidarity) presents a complex, fragmented, and lower-density structure. In contrast, S1, in an environment where there are no differences and all agents are equal, would create a relatively higher-density, organized, and hub-like structure (mechanical solidarity).
[10] The geographical and social distance parameters employed in the scenarios may not fully capture the intricate socio-spatial dynamics observed in actual urban environments. This is due to the limitations of the NetLogo environment. Notwithstanding these constraints, S2 offers a controlled testbed, enabling the examination of the effects of the two parameters on network formation, both in combination. In this context, S2 is regarded as “the closest scenario to the real urban environment” due to its incorporation of both parameters, a feature that distinguishes it from other scenarios.
Scenarios 3 and 4 (S3 & S4): These scenarios are important for making comparisons between the two parameters. For example, Milgram, (1967) highlighted the influence of social status, while Szüle et al. (2014) highlighted the influence of geographic location.
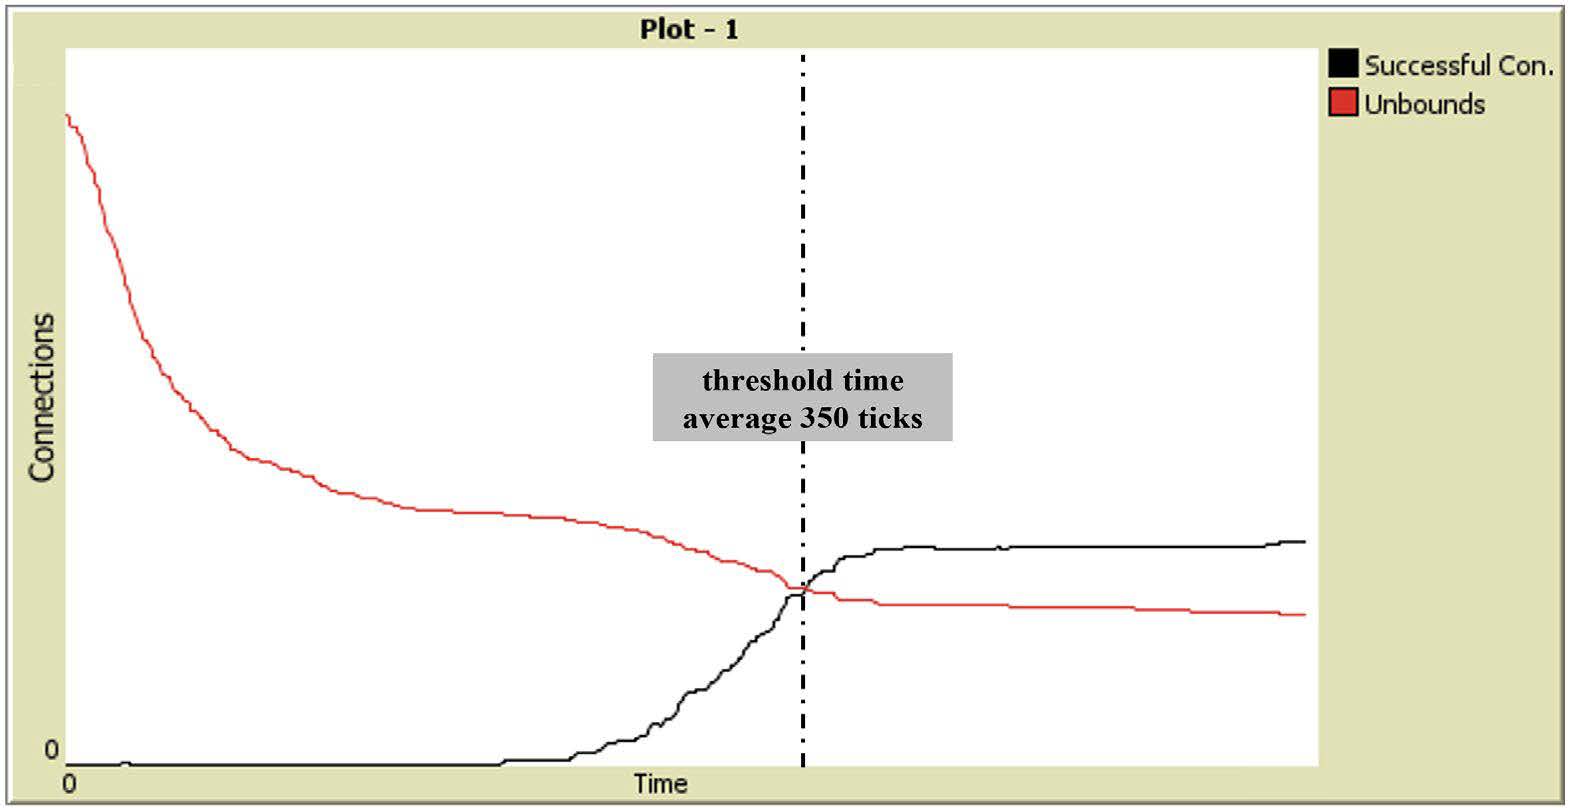
The time value (t), which is used to test the scenarios, is defined as ticks in the NetLogo environment (NetLogo, 2024). The mean value of 350 ticks is defined as the “threshold time” in the study—see Newman and Watts (1999) and Uzzi and Spiro (2005). This is the point of intersection between successful connections and all connections, after which the network density reaches a state of relative stability (see figure 5).
Figure 5
Network connections plot and threshold value.
The network patterns formed in accordance with the various scenarios are presented in figure 6.
Figure 6
Examples of small-world network patterns under different simulation scenarios
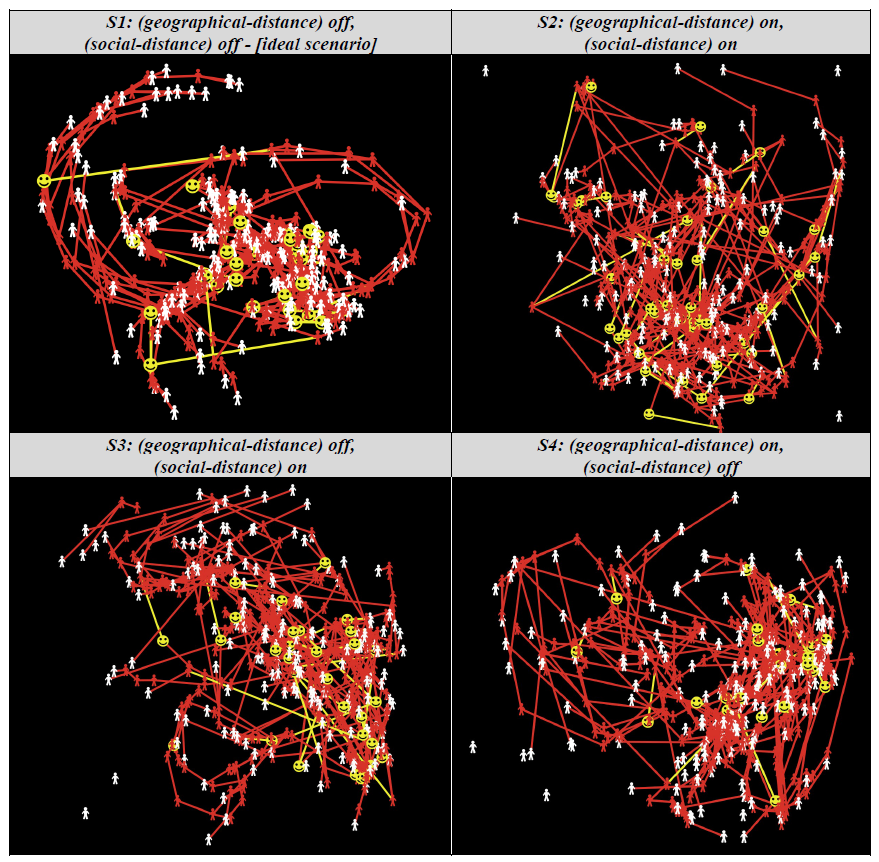
Upon examination of S1, an organized and dense structure is observed, consistent with the characteristics of mechanical solidarity. The network assumes an elliptical form around a central point. While long-distance connections are evident, there are distinct hubs. In this respect, it can be stated that dense and homogeneous clusters, or small worlds (see figure 3) are formed. There is a high density of successful connections (indicated by the yellow color and the happy face) which are distributed throughout the network. This scenario can be seen to represent an urban society where information spreads rapidly, social capital is high, and collaboration is straightforward.
In contrast, S2 exhibits a distinct pattern of short and localized connections. The prevalence of short-distance connections results in a notable reduction in proximity centrality. While small worlds are still evident, their size and cohesion are diminished compared to S1. The number of successful connections is also relatively limited, with a tendency for dispersion. This scenario is characterized by slower diffusion of information and interactions, lower social capital, and greater difficulty in collaboration. However, the necessity for interaction within this structure is undeniable.
As a preliminary assessment, scenarios 1 and 2 represent distinct aspects of urban structure. S1 demonstrates the ideal potential of urban society, reflecting a structure characterized by unrestricted, highly interactive, and densely connected networks. This scenario represents the optimal level that urban society can achieve in terms of social connectivity and interaction patterns. In contrast, S2 reflects the current reality of the urban environment, exhibiting a structure with more localized and limited interactions due to the constraints imposed by geographical and social distance parameters. Consequently, these two scenarios are complementary in illustrating different dimensions of urban - one reflecting the ideal potential, while the other represents the existing reality of urban dynamics.
In scenario 3, the impact of geographical factors is disregarded. The pattern is more dispersed than in S1 but more organized than in S2. Long-distance connections remain, but their number has decreased and the hubs that have formed have a limited number of connections. Local connections between small worlds persist. The number of successful connections is moderate and distributed across different parts of the network. This scenario presents a situation where physical mobility continues but social interactions are limited. Knowledge diffusion is moderate but social capital is partially preserved.
In scenario 4, the effect of social status is disregarded. The resulting networks are compact, dense, and small, exhibiting notable regionalization. Connections are short and local, yet highly dense within these local networks, leading to the formation of local hubs. This scenario strengthens local communities but restricts inter-community interaction.
A comprehensive evaluation reveals that scenario 3 exhibits a more dispersed and disorganized network configuration than scenario 4. This suggests that social distance (difference in social status) influences the network structure to a greater extent. Scenario 3 forms more distinct and isolated clusters, whereas scenario 4 maintains more localized dense clusters and long-distance connections between these clusters. Consequently, the network remains relatively dense and compact. Geographic distance reduces the scale of the network while maintaining its overall structure. Based on these findings, it can be concluded that social status difference exerts a relatively greater influence than geographic distance in small-world networks.
In order to assess the performance of the networks in accordance with the specified scenarios, a series of simultaneous tests were conducted. For each scenario, 10 simulations were performed, and the resulting metric values were calculated and tabulated (see table 1). The evaluations can be conducted in the following manner: The highest density in terms of [ND] is observed in S1 (0.399), which is greater than all other scenarios (S1 (0.399) > S4 (0.396) > S3 (0.394) > S2 (0.387)). This indicates that connections are more easily established in the absence of constraints. The relatively minor discrepancy between S3 and S4 once more indicates that geographical limitations exert a somewhat lesser influence than social constraints. The average density for all scenarios can be assessed as “moderate level”. The [DoS] values (S2 (14.40) > S3 (10.73) > S4 (8.28) > S1 (5.56)) represent the most significant outcome of the study. In the optimal scenario, S1, the mean value of degrees of separation was determined to be 5.56, consistent with the findings of previous studies (Bakhshandeh et al., 2011; Dodds et al., 2003; Gurevitch, 1961; Leskovec and Horvitz, 2008; Milgram, 1967; Szüle et al., 2014). Gurevitch (1961) posits that socioeconomic status, beyond geographical distance, is the most significant parameter influencing the level and duration of communication. From this perspective, social factors exert a greater influence than geographical factors, as evidenced by the fact that the DoS value in S3 is approximately 11 (a difference approximately twofold compared to S1). Furthermore, the highest [DoS] value observed in S2 highlights the cumulative impact of constraints. The relatively minor discrepancy in [TL] (S1 (497.6) > S4 (492.7) > S3 (491.4) > S2 (483)) indicates that the constraints exert a negligible impact on the overall number of connections, but a slight reduction in the number of connections as the constraints increase. The simulation rule requiring each agent to establish a connection with a friend is also effective in this case. However, the considerable discrepancy in [SC] (S1 (111.7) > S4 (63.5) > S3 (53) > S2 (35.9)) and [SR] between S1 and S2 underscores the significance of the cumulative impact of the constraints. The results for [SC]/[Total Agent] demonstrate the efficiency of the formation of small-world networks, with an average of 22.34% in S1, 7.2% in S2, 10.6% in S3, and 12.7% in S4. In this regard, the results show that [TL] tends to maintain a certain level of connection, contingent on the conditions that gave rise to its value. Nevertheless, in a hypothetical urban network with all constraints in place, small worlds would represent approximately 7% of all networks.
Table 1
Simulation metric results for different scenarios.
|
S1: (geographical-distance) off, (social-distance) off – [ideal scenario] |
|||||||||||
|
Run |
Agent |
Step |
[ND] |
[DoS] |
[BC] |
[CC] |
[EC] |
[SC] |
[SR] |
[TL] |
[SC]/[Total Agent] |
|
1 |
500 |
350 |
0.398 |
3.16 |
2567.011 |
0.142 |
0.126 |
157 |
3.810 |
496 |
8 |
|
2 |
500 |
350 |
0.398 |
13.81 |
2977.560 |
0.081 |
0.027 |
36 |
0.724 |
497 |
7.2 |
|
3 |
500 |
350 |
0.400 |
4.38 |
2181.719 |
0.124 |
0.069 |
114 |
2.565 |
499 |
22.8 |
|
4 |
500 |
350 |
0.398 |
5.22 |
2625.465 |
0.109 |
0.082 |
95 |
2.278 |
496 |
19.0 |
|
5 |
500 |
350 |
0.399 |
7.55 |
2386.619 |
0.109 |
0.082 |
66 |
1.365 |
498 |
13.2 |
|
6 |
500 |
350 |
0.398 |
7.65 |
2420.365 |
0.101 |
0.032 |
65 |
1.449 |
497 |
13.0 |
|
7 |
500 |
350 |
0.399 |
3.69 |
2683.923 |
0.129 |
0.062 |
135 |
3.133 |
498 |
27.0 |
|
8 |
500 |
350 |
0.400 |
4.09 |
2142.689 |
0.125 |
0.147 |
122 |
2.725 |
499 |
24.4 |
|
9 |
500 |
350 |
0.400 |
2.92 |
2400.322 |
0.144 |
0.104 |
171 |
4.188 |
499 |
34.2 |
|
10 |
500 |
350 |
0.398 |
3.19 |
2221.508 |
0.139 |
0.083 |
156 |
3.863 |
497 |
31.2 |
|
Mean Values |
0.399 |
5.564 |
0.399 |
5.564 |
0.081 |
118 |
2.610 |
497.60 |
22.34 |
||
|
S2: (geographical-distance) on, (social-distance) on |
|||||||||||
|
Run |
Agent |
Step |
[ND] |
[DoS] |
[BC] |
[CC] |
[EC] |
[SC] |
[SR] |
[TL] |
[SC]/[Total Agent] |
|
1 |
500 |
350 |
0.391 |
18.77 |
3056.379 |
0.083 |
0.055 |
26 |
0.492 |
488 |
5.2 |
|
2 |
500 |
350 |
0.387 |
11.78 |
2630.602 |
0.098 |
0.080 |
41 |
0.932 |
483 |
8.2 |
|
3 |
500 |
350 |
0.388 |
8.20 |
2457.287 |
0.098 |
0.107 |
59 |
1.219 |
484 |
11.8 |
|
4 |
500 |
350 |
0.386 |
9.84 |
2384.029 |
0.102 |
0.089 |
49 |
1.079 |
482 |
9.8 |
|
5 |
500 |
350 |
0.389 |
15.16 |
2607.397 |
0.094 |
0.085 |
32 |
0.660 |
485 |
6.4 |
|
6 |
500 |
350 |
0.389 |
19.40 |
3020.953 |
0.093 |
0.086 |
25 |
0.454 |
485 |
5.0 |
|
7 |
500 |
350 |
0.383 |
16.48 |
2689.402 |
0.088 |
0.075 |
29 |
0.565 |
478 |
5.8 |
|
8 |
500 |
350 |
0.385 |
15.00 |
2467.013 |
0.104 |
0.079 |
32 |
0.708 |
480 |
6.4 |
|
9 |
500 |
350 |
0.391 |
15.74 |
2540.672 |
0.099 |
0.074 |
31 |
0.615 |
488 |
6.2 |
|
10 |
500 |
350 |
0.382 |
13.63 |
2097.775 |
0.111 |
0.111 |
35 |
0.734 |
477 |
7.0 |
|
Mean Values |
0.387 |
14.400 |
2595.151 |
0.097 |
0.084 |
36 |
0.746 |
483.00 |
7.18 |
||
|
S3: (geographical-distance) off, (social-distance) on |
|||||||||||
|
Run |
Agent |
Step |
[ND] |
[DoS] |
[BC] |
[CC] |
[EC] |
[SC] |
[SR] |
[TL] |
[SC]/[Total Agent] |
|
1 |
500 |
350 |
0.391 |
18.77 |
2816.146 |
0.079 |
0.053 |
26 |
0.492 |
488 |
5.2 |
|
2 |
500 |
350 |
0.394 |
13.27 |
2970.413 |
0.087 |
0.062 |
37 |
0.835 |
491 |
7.4 |
|
3 |
500 |
350 |
0.394 |
11.98 |
2369.354 |
0.101 |
0.079 |
41 |
0.896 |
491 |
8.2 |
|
4 |
500 |
350 |
0.394 |
11.42 |
2839.429 |
0.092 |
0.061 |
43 |
0.896 |
491 |
8.6 |
|
5 |
500 |
350 |
0.394 |
9.11 |
2276.800 |
0.109 |
0.061 |
54 |
1.118 |
492 |
10.8 |
|
6 |
500 |
350 |
0.397 |
8.53 |
2279.760 |
0.116 |
0.072 |
58 |
1.333 |
495 |
11.6 |
|
7 |
500 |
350 |
0.395 |
8.65 |
2680.439 |
0.096 |
0.052 |
57 |
1.258 |
493 |
11.4 |
|
8 |
500 |
350 |
0.394 |
14.44 |
2935.043 |
0.084 |
0.058 |
34 |
0.733 |
491 |
6.8 |
|
9 |
500 |
350 |
0.391 |
6.42 |
2154.698 |
0.122 |
0.135 |
76 |
1.742 |
488 |
15.2 |
|
10 |
500 |
350 |
0.396 |
4.75 |
2143.774 |
0.125 |
0.076 |
104 |
2.328 |
494 |
20.8 |
|
Mean Values |
0.394 |
10.734 |
2546.585 |
0.101 |
0.071 |
53 |
1.163 |
491.40 |
10.60 |
||
|
S4: (geographical-distance) on, (social-distance) off |
|||||||||||
|
Run |
Agent |
Step |
[ND] |
[DoS] |
[BC] |
[CC] |
[EC] |
[SC] |
[SR] |
[TL] |
[SC]/[Total Agent] |
|
1 |
500 |
350 |
0.395 |
10.72 |
2803.860 |
0.087 |
0.073 |
46 |
0.953 |
493 |
9.2 |
|
2 |
500 |
350 |
0.394 |
6.06 |
2306.592 |
0.114 |
0.067 |
81 |
1.752 |
491 |
16.2 |
|
3 |
500 |
350 |
0.398 |
6.36 |
2266.276 |
0.117 |
0.107 |
78 |
1.875 |
496 |
15.6 |
|
4 |
500 |
350 |
0.396 |
9.69 |
2507.563 |
0.101 |
0.070 |
51 |
1.113 |
494 |
10.2 |
|
5 |
500 |
350 |
0.396 |
8.67 |
2373.062 |
0.109 |
0.057 |
57 |
1.255 |
494 |
11.4 |
|
6 |
500 |
350 |
0.394 |
8.20 |
2314.071 |
0.103 |
0.047 |
60 |
1.199 |
492 |
12.0 |
|
7 |
500 |
350 |
0.393 |
7.66 |
2391.655 |
0.104 |
0.058 |
64 |
1.306 |
490 |
12.8 |
|
8 |
500 |
350 |
0.397 |
13.03 |
2650.844 |
0.094 |
0.033 |
38 |
0.808 |
495 |
7.6 |
|
9 |
500 |
350 |
0.397 |
6.11 |
2458.702 |
0.109 |
0.046 |
81 |
1.818 |
495 |
16.2 |
|
10 |
500 |
350 |
0.398 |
6.29 |
2365.877 |
0.108 |
0.070 |
79 |
1.590 |
497 |
15.8 |
|
Mean Values |
0.396 |
8.278 |
2443.850 |
0.105 |
0.063 |
64 |
1.367 |
493.70 |
12.70 |
||
[BC] (S2 (2595.15) > S4 (2443.85) > S3 (2546.58) > S1 (2460.72)), [CC] (S1 (0.123) > S4 (0.105) > S3 (0.101) > S2 (0.097)) and [EC] (S2 (0. 084) > S1 (0.082) > S3 (0.071) > S4 (0.064)) are important for the qualities of the network structure and pattern analysis. The finding that S2 has the highest [BC] suggests that some nodes serve a “bridge” function in the presence of all constraints. In terms of organic solidarity structure, the effect of “inter-dependency” can be mentioned. The term “inter-dependency” is used to describe the phenomenon of specialization within a social network. In this regard, bridging long-distance ties are formed between small network clusters, yet only a limited number of them. These structural relationships organize communities in a complex hierarchical system involving different levels of power and control, which is characteristic of organic solidarity (Brown, 2020; Brodowicz, 2024; Lukes, 1985, pp. 150–151). The complex and hierarchical structure of S2 results in a higher centrality level in terms of the [EC] value within the topology. However, this leads to a lower [CC] value in S2 than in the ideal case of S1. As a natural consequence, geographical constraints result in [EC] being the lowest and [CC] being the highest in line with the ideal case.
In conclusion, as constraints and distances increase, the structure of the network becomes more “long” [high DoS] and less connected. Social status exerts a greater influence than geographical distances, directly shaping clustering patterns. However, this results in some nodes becoming more critical [high BC]. These findings offer insights into how social isolation or geographical distance effects can affect social networks in the real world.
CONCLUSION
This study examines the formation of small-world networks in an urban environment over a specified time using multi-agent simulation. The relationship between the individual and their environment can be conceptualized as a complex network when considering an urban settlement. This is due to the fact that urban settlements necessitate a high level of organization, specialized knowledge, and a production process based on the division of labor. In order to address potential concerns regarding solidarity and security that may emerge in situations where the level of organization is low, communities show location selection effects in specific spatial sub-regions based on different identities and cultures. Given that social network patterns are developed with a focus on “human-space,” the spatial formation structure can offer insights into the social structure of the settlement. Consequently, the geographical and social status constraints discussed in this study serve as fundamental components for network analysis. The findings and discussions reveal that social networks are more influenced by social status than by geographical distance. The degrees of separation obtained under ideal simulation conditions are in accordance with the examples presented in the literature. However, the constraints imposed on the simulation resulted in notable differences in network patterns and metric values. As the constraints increase, these interactions become more centralized, although the network density decreases. As we move toward the ideal state, the network becomes denser and more connected, but the importance of individual interactions decreases.
Similar processes can be observed in contemporary urban environments, particularly in the context of globalization and postmodernity, where the movement of people and ideas across geographical boundaries is more fluid. In this regard, it is essential to develop policies that regulate the interaction and segregation between communities within the context of urban planning. It can be argued that accessibility and connectivity are crucial factors in facilitating integration within an urban fabric and the formation of social relations. However, this increased connectivity is accompanied by a heightened visibility of social differences and individuality. In instances where social integration is not feasible within urban environments, issues may emerge regarding the formation of small-world networks or the social networks. Considering these, it becomes evident that policies aimed at regulating interactions and segregation between communities should be developed within the domain of urban planning. It is recommended that public space presentations be diversified to address the isolating effect of the social status factor, which was identified as a result of the simulation. Despite the existence of disparate social groups, public spaces can facilitate interaction and the formation of networks across the entire society. Settlements where physical and functional centrality is created are likewise unique and legible settlements that include human scale, belonging and social control. Diversifying the presentation of public spaces can address the isolating impact of social status, which is seen as a result of the simulation. Despite the existence of diverse groups within society, public spaces can facilitate interaction and network formation across the entire population. The model offers a fundamental framework for examining network structures within urban contexts. However, it can be enhanced by incorporating additional variables, such as economic (occupation, industry, etc.) and cultural (religion, political affiliation, ethnicity). The incorporation of these parameters will facilitate a more realistic assessment of the urban environment.
REFERENCES
Alchalabi, A. E. (2021). On small-world networks: Survey and properties analysis (arXiv:2101.11191). arXiv. https://doi.org/10.48550/arXiv.2101.11191
Amaral, L. A. N., Scala, A., Barthélémy, M., & Stanley, H. E. (2000). Classes of small-world networks. Proceedings of the National Academy of Sciences, 97(21), 11149–11152. https://doi.org/10.1073/pnas.200327197
Bakhshandeh, R., Samadi, M., Azimifar, Z., & Schaeffer, J. (2011). Degrees of Separation in Social Networks. Proceedings of the International Symposium on Combinatorial Search, 2(1), Article 1. https://doi.org/10.1609/socs.v2i1.18200
Bamakan, S. M. H., Nurgaliev, I., & Qu, Q. (2019). Opinion leader detection: A methodological review. Expert Systems with Applications, 115, 200–222. https://doi.org/10.1016/j.eswa.2018.07.069
Banerjee, A. (1992). A Simple Model of Herd Behavior. The Quarterly Journal of Economics, 107(3), 797–817.
Barabási, A.-L. (2014). Linked: How everything is connected to everything else and what it means for business, Science, and Everyday Life (3/30/03 edition). Basic Books.
Barnes, J. A. (1969). Graph theory and social networks: A technical comment on connectedness and connectivity. Sociology, 3(2), 215–232. https://doi.org/ 10.1177/003803856900300205
Bikhchandani, S., Hirshleifer, D., & Welch, I. (1998). Learning from the behavior of others: Conformity, fads, and informational cascades. Journal of Economic Perspectives, 12(3), 151–170. https://doi.org/10.1257/jep.12.3.151
Bott, E. (1957). Family and social network: Roles, norms, and external relationships in ordinary urban families (1st edition). Tavistock.
Brandes, U. (2001). A faster algorithm for betweenness centrality. The Journal of Mathematical Sociology, 25(2), 163–177. https://doi.org/10.1080/0022250X.2001.9990249
Brodowicz, M. (2024, July 6). Analyzing durkheim’s theory of social solidarity and its relevance in modern society. Aithor. https://aithor.com/essay-examples/analyzing-durkheims-theory-of-social-solidarity-and-its-relevance-in-modern-society
Brown, W. (2020, April 10). Emile durkheim: Solidarity and the birth of the modern city. Medium. https://will-brown.medium.com/emile-durkheim-solidarity-and-the-birth-of-the-modern-city-51a854b7d77
Castro, O., Repiso, E., Garrell, A., & Sanfeliu, A. (2023). Classification of humans social relations within urban areas. In D. Tardioli, V. Matellán, G. Heredia, M. F. Silva, & L. Marques (Eds.), ROBOT2022: Fifth Iberian Robotics Conference (pp. 27–39). Springer International Publishing. https://doi.org/10.1007/978-3-031-21065-5_3
Ch’ng, E. (2015). Local interactions and the emergence of a twitter small-world network. Social Networking, 4(2), Article 2. https://doi.org/10.4236/ sn.2015.42004
de Sola Pool, I., & Kochen, M. (1978). Contacts and influence. Social Networks, 1(1), 5–51. https://doi.org/10.1016/0378-8733(78)90011-4
Dodds, P. S., Muhamad, R., & Watts, D. J. (2003). An Experimental study of search in global social networks. Science, 301(5634), 827–829. https://doi.org/10.1126/science.1081058
Durkheim, E. (1964). The division of labor in society. The Free Press.
Fraigniaud, P. (2007). Small worlds as navigable augmented networks: Model, analysis, and validation. In L. Arge, M. Hoffmann, & E. Welzl (Eds.), Algorithms – ESA 2007 (pp. 2–11). Springer. https://doi.org/10.1007/978-3-540-75520-3_2
Goodrich, M. T., & Ozel, E. (2022). Modeling the small-world phenomenon with road networks. Proceedings of the 30th International Conference on Advances in Geographic Information Systems, 1–10. https://doi.org/10.1145/3557915. 3560981
Guiot, J. M. (1976). A modification of Milgram’s small world method. European Journal of Social Psychology, 6(4), 503–507. https://doi.org/10.1002/ejsp.2420060409
Gurevitch, M. (1961). The social structure of acquaintanceship networks [Thesis (Ph.D.), Massachusetts Institute of Technology]. https://dspace.mit.edu/handle/1721.1/11312
Haslam, N. (1994). Categories of social relationship. Cognition, 53(1), 59–90. https://doi.org/10.1016/0010-0277(94)90077-9
Heikkinen, I. (2021). Graph theory and the six degrees of separation. MIT Mathematics. https://math.mit.edu/research/highschool/primes/circle/documents/2021/Heikkinen.pdf
Hill, D. R. (1993). A case for teleological Urban form history and ideas: Lewis Mumford, F. L. Wright, Jane Jacobs and Victor Gruen. Planning Perspectives, 8(1), 53–71. https://doi.org/10.1080/02665439308725763
Holland, P. W., & Leinhardt, S. (1971). Transitivity in structural models of small groups. Comparative Group Studies, 2(2), 107–124. https://doi.org/10.1177/ 104649647100200201
Holland, P. W., & Leinhardt, S. (1977). A method for detecting structure in sociometric data. In S. Leinhardt (Ed.), Social networks (pp. 411–432). Academic Press. https://doi.org/10.1016/B978-0-12-442450-0.50028-6
Hwang, W., Cho, Y., Zhang, A., & Ramanathan, M. (2006). Bridging centrality: Identifying bridging nodes in scale-free networks. 20–23.
Ingram, P., & Roberts, P. W. (2000). Friendships among competitors in the sydney hotel industry. American Journal of Sociology, 106(2), 387–423. https://doi.org/10.1086/316965
Jing, J. (2021, September 19). Must-read networks paper: The small-world problem. Geek Culture. https://medium.com/geekculture/must-read-networks-paper-the-small-world-problem-dc0f843aa4a7
Karinthy, F. (1929). Chain-links. In The structure and dynamics of networks (pp. 21–26). Princeton University Press. https://doi.org/10.1515/9781400841356.21
Kleinberg, J. (2000a). Navigation in a small world. Nature, 406(6798), 845–845. https://doi.org/10.1038/35022643
Kleinberg, J. (2000b). The small-world phenomenon: An algorithmic perspective. Proceedings of the Thirty-Second Annual ACM Symposium on Theory of Computing, 163–170. https://doi.org/10.1145/335305.335325
Kleinfeld, J. S. (2002). The small world problem. Society, 39(2), 61–66. https://doi.org/10.1007/BF02717530
Laborit, H. (1961). Physiologie humaine, cellulaire et organique. MASSON ET CIE.
Laborit, H. (1971). L’homme et la ville, approche systémique de l’urbanisme. Flammarion.
Lash, S., & Urry, J. (1987). The end of organized capitalism. University of Wisconsin Press.
Lash, S., & Urry, J. (1994). Economies of signs and space. SAGE Publications.
Latil, P. (1953). La pensée artificielle: Introduction à la cybernétique. Gallimard.
Lattanzi, S., Panconesi, A., & Sivakumar, D. (2011). Milgram-routing in social networks. Proceedings of the 20th International Conference on World Wide Web, 725–734. https://doi.org/10.1145/1963405.1963507
Leskovec, J., & Horvitz, E. (2008). Planetary-scale views on an instant-messaging network (arXiv:0803.0939). arXiv. https://doi.org/10.48550/arXiv.0803.0939
Lippuner, R., & Werlen, B. (2009). Struction theory. In R. Kitchin & N. Thrift (Eds.), International encyclopedia of human geography (Vol. 1, pp. 39–48). Elsevier Science.
Lukes, S. (1985). Émile Durkheim: His life and work: A historical and critical study. Stanford University Press.
Marsden, P. V. (1983). Restricted Access in Networks and Models of Power. American Journal of Sociology, 88(4), 686–717.
Matni, Z. (2021, August 6). Social Network Analysis, Part 2—Information Matters. Information Matters. https://informationmatters.org/2021/08/social-network-analysis-part-2/
Mayhew, B. H. (1980). Structuralism versus Individualism: Part 1, Shadowboxing in the Dark. Social Forces, 59(2), 335–375. https://doi.org/10.2307/2578025
Mayhew, B. H. (1981). Structuralism versus Individualism: Part II, Ideological and Other Obfuscations. Social Forces, 59(3), 627–648. https://doi.org/10.2307/2578186
Milgram, S. (1967). The Small World Problem. Psychology Today, 2, 60–67.
Milgram, S. (1969). Interdisciplinary Thinking and the Small World Problem. In Interdisciplinary Relationships in the Social Sciences. Routledge.
Neal, Z. P., Neal, J. W., Lawlor, J. A., & Mills, K. J. (2015). Small worlds or worlds apart? Using network theory to understand the research-practice gap. Psychosocial Intervention, 24(3), 177–184. https://doi.org/10.1016/j.psi.2015.07.006
Negre, C. F. A., Morzan, U. N., Hendrickson, H. P., Pal, R., Lisi, G. P., Loria, J. P., Rivalta, I., Ho, J., & Batista, V. S. (2018). Eigenvector centrality for characterization of protein allosteric pathways. Proceedings of the National Academy of Sciences of the United States of America, 115(52), E12201–E12208. https://doi.org/10.1073/ pnas.1810452115
NetLogo. (2024). Ticks. https://ccl.northwestern.edu/netlogo/docs/dict/ticks.html
Newman, M. E. J., & Watts, D. J. (1999). Scaling and percolation in the small-world network model. Physical Review E, 60(6), 7332–7342. https://doi.org/10.1103/PhysRevE.60.7332
Okamoto, K., Chen, W., & Li, X.-Y. (2008). Ranking of closeness centrality for large-scale social networks. In F. P. Preparata, X. Wu, & J. Yin (Eds.), Frontiers in algorithmics (pp. 186–195). Springer. https://doi.org/10.1007/978-3-540-69311-6_21
Piaget, J., & Inhelder, B. (1948). La représentation de l’espace chez l’enfant [Representation of space by the child.] Presses Universitaires de France.
Pittendrigh, C. (1958). Adaptation, natural selection and behaviour. In A. Roe & G. G. Simpson (Eds.), Behavior and evolution. Yale University Press.
Porter, M. A. (2012). Small-world network. Scholarpedia, 7(2), 1739. https://doi.org/ 10.4249/ scholarpedia.1739
Rand, C. (1964). Cambridge, U.S.A: Hub of a New World. Oxford University Press.
Rao, H., Greve, H. R., & Davis, G. F. (2001). Fool’s gold: Social proof in the initiation and abandonment of coverage by wall street analysts. Administrative Science Quarterly, 46(3), 502–526. https://doi.org/10.2307/3094873
Rapoport, A. (1963). Mathematical models of social interaction. In D. Luce, R. Bush, & E. Galanter (Eds.), Handbook of mathematical psychology: Volume 2 (pp. 493–571). John Wiley & Sons.
Schnettler, S. (2009). A structured overview of 50 years of small-world research. Social Networks, 31(3), 165–178. https://doi.org/10.1016/j.socnet.2008.12.004
Şeker, Ş. E. (2015, February 2). Ayrımın Altı Derecesi (Six Degrees of Separation). MISSözlük. https://mis.sadievrenseker.com/2015/02/ayrimin-alti-derecesi-six-degrees-of-separation/
Szüle, J., Kondor, D., Dobos, L., Csabai, I., & Vattay, G. (2014). Lost in the city: Revisiting milgram’s experiment in the age of social networks. PLOS ONE, 9(11), e111973. https://doi.org/10.1371/journal.pone.0111973
Travers, J., & Milgram, S. (1969). An experimental study of the small world problem. Sociometry, 32(4), 425–443. https://doi.org/10.2307/2786545
Uzzi, B., & Spiro, J. (2005). Collaboration and creativity: The small world problem. American Journal of Sociology, 111(2), 447–504. https://doi.org/10.1086/432782
Watts, D. J. (1999). Networks, dynamics, and the small‐world phenomenon. American Journal of Sociology, 105(2), 493–527. https://doi.org/10.1086/210318
Watts, D. J., & Strogatz, S. H. (1998). Collective dynamics of ‘small-world’ networks. Nature, 393(6684), Article 6684. https://doi.org/10.1038/30918