ABSTRACT
Water scarcity, driven by rapid population growth and climate change, presents a critical challenge worldwide. This study examines Pakistan’s struggle with water scarcity, emphasizing the impacts of population growth, climate change, and inadequate water management, particularly within the vital Indus River system. Using time-series data from AQUASTAT and World Development Indicators from 1980-2020, we apply indices such as Falkenmark’s Water Resource Vulnerability Index and the Water Poverty Index to assess Pakistan’s water stress. Our findings reveal that per capita water availability has dropped below critical levels, exacerbated by outdated irrigation systems and slow progress in dam capacity expansion. With over 90% of water directed toward agriculture, efficient water use and increased storage are crucial. However, inter-provincial conflicts and water wastage remain significant barriers. This study highlights areas for improvement, including enhanced industrial water use efficiency and reduced municipal consumption and its recommendations are to advocate for public awareness, better storage infrastructure, and coordinated efforts to achieve water-related Sustainable Development Goals by 2030.
Keywords: Indus River system, Water Scarcity, Population Growth, Water Resource Management, Falkenmark’s Indicator, Pakistan.
INTRODUCTION
Pakistan shares borders with India to the east, Afghanistan to the west, and China to the north. The country’s diverse topography encompasses the Himalayan and Karakoram mountain ranges in the east, the Hindukush ranges, hill regions, and the upland Baluchistan plateau in the north. With a climate ranging from arid to semi-arid, the Indus River flows from the Karakoram ranges down to the south, ultimately emptying into the Arabian Sea. A total of 27% of the total land area in Pakistan is utilized for agriculture, with crops such as wheat, maize, rice, cotton, and sugarcane. Agriculture therefore is pivotal to Pakistan’s economy. Major industries, including textiles, pesticides, and fertilizers, are concentrated in urban areas. Despite ample surface and groundwater resources, industrialization, urbanization, and rapid population growth exert stress on these water sources (Sahoutara, 2017).
WATER SCARCITY CHALLENGES
Water availability is critical for socioeconomic development and ecosystem sustainability. Pakistan faces severe water scarcity, which significantly risks its economy, agriculture, and overall stability. This article investigates the root causes of this water crisis. These include inefficient water management, regional disputes over shared rivers, and the increasing demands of a growing population. Additionally, climate change has exacerbated scarcity through rising temperatures, erratic precipitation patterns, and accelerated glacier melting.
The International Monetary Fund (IMF) warns that Pakistan could face extreme drought by 2025 unless urgent measures are taken. Contributing factors include India’s construction of dams on shared rivers, which threaten Pakistan’s water supply, and sediment accumulation in existing reservoirs, further reducing their storage capacity. If left unaddressed, the crisis could result in desertification, economic instability, health insecurity, and potential conflicts over diminishing water resources (Shukla, 2021). This study aims to identify the extent and implications of water scarcity in Pakistan and develop strategies for its mitigation. The article underscores the urgent need for sustainable water resource management to safeguard Pakistan’s future by focusing on these challenges.
IMPLICATIONS OF WATER SCARCITY
Water scarcity in Pakistan has wide-ranging implications, severely impacting agriculture, economic development, and public health. Agriculture, the backbone of Pakistan’s economy, consumes approximately 93% of the country’s water resources (Muqarrab et al., 2021). The Pakistan Irrigation Development Authority manages an extensive irrigation system that spans 17 million hectares, featuring 45 main irrigation canals, 23 barrages, and three significant reservoirs, with a combined storage capacity of 20 billion cubic meters (Muzammil et al., 2020). Despite this infrastructure, inefficient practices and poor water management exacerbate water scarcity, impeding agricultural productivity. Water shortages also constrain economic growth, disrupting industrial activity and increasing production costs. Social life is adversely affected due to limited access to clean water, causing health crises in underserved communities. Zaheer (2022) highlights that the failure to implement water conservation measures has aggravated the situation, with the IMF predicting severe drought conditions in Pakistan by 2025 if urgent interventions are not undertaken.
External factors such as India’s construction of dams on shared rivers further complicate the crisis by reducing Pakistan’s water inflows and causing sediment accumulation in its reservoirs. Maitlo (2019) and Hadid (2019) note that these pressures could fuel resource-based conflicts, threatening regional stability. Moreover, the economic ramifications of water scarcity include reduced development potential, financial instability, and heightened vulnerability to health risks. This article explores the multifaceted consequences of water scarcity through quantitative analyses of its impacts on agriculture, economic development, and public health. These insights can help inform policy recommendations to mitigate water scarcity and its cascading effects in Pakistan.
OVERVIEW OF FACTORS AGGRAVATING THE CRISIS
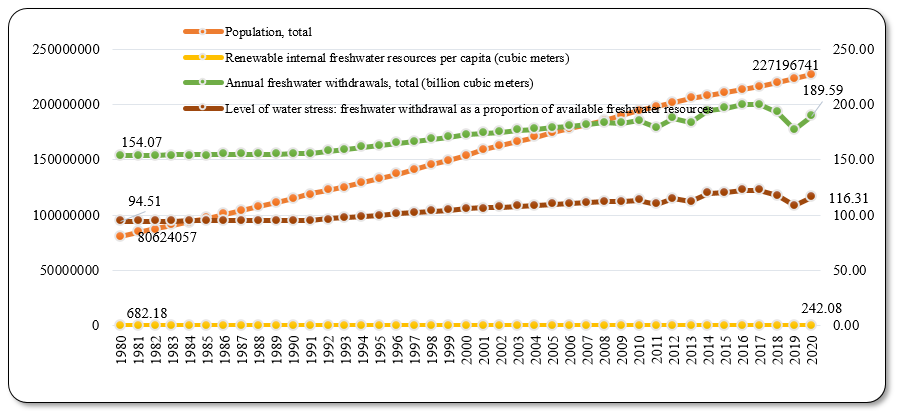
Table 1 provides a quantitative overview of some of the relevant indicators between 1980 and 2020. Pakistan’s population grew significantly during this time, from 80.624 million to 227.196 million, reflecting an annual growth rate of 1.817. Concurrently, the per capita availability of renewable water resources saw a substantial decline from 3161.9 cubic meters to 1,117.29 cubic meters, marking a drop of 64.66%. Total water withdrawal increased from 154.07 billion cubic meters (BCM) to 183.45 BCM, representing a 19.06% rise. The per capita water withdrawal per year exhibited a notable reduction from 1,973.82 cubic meters to 830.5 cubic meters, depicting a decrease of 57.29%. The level of water stress, measured as freshwater withdrawal as a percentage of accessible freshwater resources, also increased from 94.51% to 116.31%, indicating a 23.06% rise in water stress over the period. These trends highlight the challenge of sustaining water resources amidst population growth and increased water demand in Pakistan (as shown in figure 1).
Table 1
Population Growth, Water Resources, and Water Withdrawals in Pakistan (1980-2020).
|
Indicators |
1980 |
2020 |
Annual growth rate |
|
Total population (millions) |
80.62 |
227.19 |
1.817 |
|
Total renewable water resources in BCM |
246.80 |
246.80 |
No change |
|
Total renewable water resources per person (cubic meters) |
3,161.90 |
1,117.30 |
-0.646 (-64.66%) |
|
Total water withdrawal in BCM |
154.07 |
183.45 |
0.190 (19.06%) |
|
Total water withdrawal per capita (m3/inhabitant/year) |
1,973.80 |
830.50 |
-0.579 (-57.29%) |
|
Level of water stress: freshwater withdrawal as a proportion of available freshwater resources |
94.51% |
116.31% |
0.23 (23.06%) |
Sources: FAO AQUASTAT Dissemination System 2021.
Figure 1
Trends in per capita water availability, water withdrawal, and level of water stress compared to population in Pakistan from 1980 to 2020.
COMPREHENSIVE SOLUTIONS FOR WATER MANAGEMENT
Addressing Pakistan’s water scarcity requires a multifaceted approach encompassing structural, managerial, and behavioral reforms. With a projected water shortfall of 30% by 2025, immediate interventions are needed to improve water resource management (Raza et al., 2017). Effective solutions must address water availability, enhance infrastructure, and promote sustainable water usage practices. Building large dams to increase water storage capacity is critical for mitigating seasonal water variability and supporting agricultural and industrial needs. Additionally, upgrading irrigation systems, redesigning farm layouts, and introducing high-efficiency methods such as drip irrigation can significantly improve water use efficiency in agriculture, which consumes 93% of available water. Regulating groundwater through a Groundwater Regulation Authority and removing subsidies on groundwater extraction is vital for curbing over-extraction and ensuring sustainable usage. Implementing watershed management practices, including soil conservation, afforestation, and stakeholder collaboration, can reduce soil erosion, maintain water quality, and preserve water resources. Recycling wastewater and drainage water is another viable solution to address supply-demand imbalances; properly managed wastewater treatment can supplement agricultural and industrial water supplies (Hafeez et al., 2020). Public awareness campaigns on water conservation and efficiency are equally essential for educating communities about sustainable water use and fostering behavioral change. By combining infrastructural improvements, efficient resource management, and awareness initiatives, Pakistan can effectively address its water challenges and work toward achieving sustainable water management. This study aims to quantitatively analyze the impacts of water scarcity while exploring dynamic policies for sustainable resource management.
LITERATURE REVIEW
The availability of adequate water resources is fundamental for creating a productive environment that meets the needs of people, animals, and plants while ensuring a reliable food supply. Water is critical for human survival and plays a vital role in sectors like agriculture, which directly influences economic stability. However, the growing global population and increasing economic activities have exacerbated the pressures on water resources. Pimentel et al. (2004) highlight how spatial and temporal inequalities in water distribution, combined with human-induced stressors, have created significant challenges in ensuring equitable water access. While nations with abundant water resources, such as Brazil, Canada, China, Russia, and the USA, are likely to exert substantial global influence, regions facing water insecurity grapple with inadequate access, making water scarcity a persistent threat to sustainable development. Ethiopia’s construction of the Millennium Reservoir demonstrates how proactive infrastructure can safeguard water resources even under challenging circumstances (Wattoo, 2022).
Despite substantial surface and groundwater reserves in Pakistan, water resources are under immense strain due to rapid industrialization, urbanization, and population growth (Soomro, 2011). The deterioration of water quality further compounds the crisis. Contaminated drinking water, driven by industrial waste and inadequate drainage systems, poses significant health risks. Approximately 50% of diseases and 40% of deaths in Pakistan are linked to unsafe water, as noted by Park (2007). The limited focus on water cleanliness, combined with insufficient drainage infrastructure, exacerbates the problem, with only 25% of the population having access to protected drinking water (Nils, 2005). Urbanization has further strained groundwater resources, leading to inconsistent water supplies in cities (Hifza et al., 2021). Additionally, 80% of the population relies on contaminated water, with around 60 million people at risk of arsenic poisoning, resulting in severe health and socioeconomic consequences (Guglielmi, 2017).
The Pakistan Council of Research in Water Resources (PCRWR) predicted in 2018 that fresh water would be scarce by 2025, a projection supported by the decline in per capita water availability below the critical threshold of 1,000 cubic meters annually (Aziz et al., 2018). Pakistan ranks third among nations facing acute water scarcity, with deteriorating water quality affecting agriculture, livestock, fisheries, and coastal communities (Abbasi, 2022). The lack of interest from national and provincial authorities in water policies, ongoing water conflicts, deforestation, and threats to glacier reserves further exacerbate the issue, posing significant challenges to Pakistan’s water security (Kirby et al., 2014; Nabi et al., 2018). Shakeel et al. (2023) emphasize the urgent need for a holistic approach to water resource management, incorporating infrastructure development, climate adaptation, and the inclusion of socio-environmental considerations. Climate change further complicates Pakistan’s water crisis, intensifying hydrological cycles and threatening river systems. The Indus Water Treaty, which governs water distribution between India and Pakistan, is limited in addressing modern challenges like sedimentation and declining storage capacities in Pakistan’s major dams (Ashraf et al., 2022). Baccour et al. (2024) emphasize integrating water quality management with water resource strategies to address water scarcity effectively. Using the Pearl River Basin as a case study, the authors demonstrate that improving water quality through pollution reduction and sustainable water use can halve future water scarcity risks. This cost-effective approach highlights the need for comprehensive policies that simultaneously address water quality and quantity challenges. These findings are relevant for regions like Pakistan, where resource insufficiency and pollution exacerbate water scarcity. Sedimentation alone results in significant annual storage loss, emphasizing the importance of constructing additional reservoirs.
Iqbal (2010) highlights the pressing need for conflict resolution, capacity-building initiatives, and rural community involvement to address water shortages effectively. Global insights underscore the role of robust frameworks in addressing water scarcity. Mekonnen and Hoekstra (2016) emphasize the importance of Environmental Flow Requirements (EFR) and water scarcity indicators like the Falkenmark Indicator, Water Resources Vulnerability Index, Physical and Economic Scarcity of Water, and the Water Poverty Index. However, these tools often lack contextual specificity, highlighting the need for methodologies tailored to Pakistan’s unique socioeconomic and environmental conditions. Such indicators could provide researchers with more reliable tools to assess water stress and devise actionable strategies.
Despite these challenges, addressing water scarcity in Pakistan offers opportunities for transformative change. The lack of empirical studies focusing on the factors influencing water stress highlights a critical research gap. Human activities, including urbanization and industrial development, continue to intensify the effects of climate change on water resources. Addressing these issues requires comprehensive measures integrating legal reforms, infrastructure investments, climate adaptation, and community engagement. Lessons from global examples, such as Ethiopia’s reservoir construction and the strategic management of water-rich nations, provide valuable insights into the potential for resilience and sustainability. In conclusion, Pakistan’s water scarcity crisis demands urgent attention and a multifaceted approach. Integrating policy reforms, improved water management practices, and innovative research can pave the way for sustainable solutions. Examining existing water scarcity indicators and developing new, context-specific frameworks will be instrumental in guiding efforts to mitigate water stress and ensure equitable resource distribution.
DATA SOURCES AND METHODOLOGY
Water scarcity is a complex issue requiring diverse metrics to comprehensively assess water availability, demand, and variability. This study adopts a systematic approach, utilizing internationally recognized indices and formulas to evaluate access, stress levels, and spatio-temporal dynamics, particularly emphasizing Pakistan’s unique water challenges. By incorporating established methodologies such as the Falkenmark Indicator, Basic Human Needs Index, and Water Stress Index (WSI), alongside innovative measures like the AWARE Characterization Factor and Water Use in Life Cycle Assessment, the study provides a holistic framework for understanding water scarcity. Secondary time-series data from AQUASTAT and World Development Indicators for 1980 to 2020 underpin the analysis, enabling an evaluation of water withdrawal relative to basic human needs, ecosystem requirements, and human development levels. This comprehensive assessment highlights Pakistan’s alarming water scarcity, emphasizing the need for sustainable water management strategies tailored to the country’s specific socioeconomic and environmental conditions.
MODEL SPECIFICATIONS FOR THE CLASSICAL SCARCITY OF WATER INDICES
ACCESS TO DRINKING WATER AND SANITATION SERVICES
In 2012, the World Health Organization assessed global access to drinking water and sanitation services, analyzing the percentage of populations served to gain insights into infrastructure development and the provision of essential services (WHO and UNICEF, 2012). This evaluation highlights disparities, tracks progress, and underscores the need for targeted interventions to address water scarcity in underserved regions, emphasizing the importance of equitable service provision and sustainable infrastructure development.
THE FALKENMARK INDICATOR (RESOURCES TO POPULATION INDEX)
Falkenmark et al. (1989) proposed an influential water scarcity indicator, calculating available water per person (m³/cap/year). With a threshold of 1,700m³/cap/year indicating scarcity, severe scarcity below 1,000m³/cap/year, and absolute scarcity below 500m³/cap/year (Falkenmark and Rockström, 2004; Falkenmark, 2013), it provides a straightforward assessment. However, it overlooks temporal variations, demand drivers, and management practices, focusing solely on supply-side impacts. This indicator does not consider infrastructure factors or spatial distribution of demand, limiting its comprehensive analysis of water scarcity. Despite its limitations, it remains a widely used metric for evaluating water availability relative to population needs (see table 2).
Table 2
Classifications of the Falkenmark Indicator.
|
Index (m³/capita/year) |
Category |
|
>1,700 |
No Stress |
|
1,000-1,700 |
Stress |
|
500-1,000 |
Scarcity of water |
|
˂500 |
Absolute scarcity of water |
BASIC HUMAN NEEDS INDEX
The methodology introduced by Traskin and Gleick in 1996 focuses on water usage, quantifying the minimum required for daily needs (Basic Water Requirements) at 50 liters per person per day. This approach assesses countries where average domestic water consumption falls below the threshold, though it has certain limitations. Exclusively at the country level, it overlooks regional water availability and lacks consideration for water quality. Reliability issues with country-level data and excluding other vital water users, like industry and agriculture, limit its comprehensive analysis.
WATER AVAILABILITY INDEX
Meigh et al. (1999) examined the Global Water Availability Assessment model, which assesses the temporal variability of water availability. This index evaluates the total amount of surface water and groundwater resources against the demands of various domestic, industrial, and agricultural sectors. The critical factor is the month with the most significant deficit or the smallest surplus. The range of the index is normalized to -1 to +1. When the index is zero, availability and demand are equal.
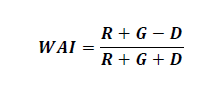
Where;
R The surface runoff
G The groundwater resources
D The sum of demands of all sectors
The assessment of surface water availability utilizes 90% of reliable runoff. Potential recharge or aquifer yield is considered for groundwater, prioritizing the lower figure.
MODELS FOR THE WITHDRAWAL TO AVAILABILITY RATIOS
The withdrawal-to-availability ratios and consumption-to-availability ratios are used as characterization factors (C.F) to assess water withdrawal, consumption, and degradation impacts. Here is a breakdown of their applications:
Withdrawal-to-availability ratios, employed by Frischknecht et al. (2006), Ridoutt and Pfister (2010), and Pinero et al. (2011), gauge the environmental impact of water withdrawal. This ratio assesses the proportion of withdrawn water relative to available resources, indicating potential ecological and resource consequences. Frischknecht et al. (2006) calculated Universal Freshwater Losses per unit of Benefit (UBP) using a formula that provides values in points per BCM per year (see table 3).
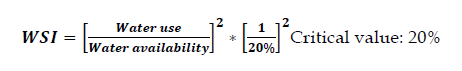
Table 3
Classification of the Frischknecht et al. indicator.
|
Less availability of water |
UBP (points/10^9 m3/year used) |
|
Low |
24 |
|
Moderate |
220 |
|
Medium |
880 |
|
High |
2,400 |
|
Very high |
6,200 |
|
Extreme |
22,000 |
CONSUMPTION-TO-AVAILABILITY RATIOS
Pfister and Hellweg (2009), Boulay et al. (2011a), and Hoekstra et al. (2011;2012) employ consumption-to-availability ratios to assess the impacts of water consumption. The consumption-to-availability ratio indicates the proportion of water consumed in a specific process or activity relative to the available water resources. It helps evaluate the potential environmental and resource impacts associated with water consumption.
THE DEGRADATION OF WATER
Boulay et al. (2011b), Pinero et al. (2011), and Hoekstra et al. (2011) utilize ratios to evaluate the repercussions of water degradation. Water degradation involves the decline in water quality due to factors like pollution and contamination. These ratios quantify potential environmental and human health impacts caused by water degradation. C.F.s employed for withdrawal, consumption, and degradation offer a framework to assess and compare the sustainability of various processes or activities regarding their water-related impacts on ecosystems and resources.
THE WATER STRESS INDEX
Pfister and Hellweg (2009) introduced the WSI as a comprehensive indicator considering multiple water availability and use factors. The WSI incorporates three main components. Withdrawal to Availability (WTA) assesses the ratio between water withdrawals and availability, indicating the proportion of water withdrawn compared to accessible supply. A higher WTA signals elevated water stress, suggesting withdrawals nearing or surpassing available resources. Variability in Precipitation gauges precipitation pattern fluctuations, introducing uncertainty in water availability. Higher variability can contribute to water stress, particularly in regions reliant on precipitation. Flow Regulation considers human-induced alterations like dams or reservoirs impacting natural flow. Increased regulation may affect water availability and ecological processes, potentially elevating water stress.
Figure 2
The Boulay et al. (2011a) indicator.
When water is abundant, consuming 1m3 does not impact other users. However, when water is scarce, consuming 1m3 of water deprives other competing users of the same amount.
The original WSI, created by Vörösmarty et al. (2005), is called the Index of Local Relative Water Use. It is formulated as:
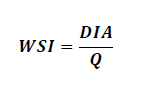
The letters D, I, and A represent water withdrawals for domestic, industrial, and agricultural sectors, respectively, while Q represents river corridor discharge. The WSI determines the WTA by comparing total withdrawals to stream flow within gridded study areas. WSI surpassing 0.2 indicates water stress constraining economic growth, with WSI exceeding 0.4, signifying high water stress (see table 4).
Table 4
Classification of WSI Values.
|
Category |
Index |
|
Low |
< 0.1 |
|
Moderate |
0.1 - 0.2 |
|
Medium |
0.2 - 0.4 |
|
High |
> 0.4 |
WATER IMPACT INDEX
The Water Impact Index (Pinero et al., 2011) is a vital metric designed to gauge the repercussions of human activities on water resource availability. Measured in “m3-Water Impact Index-equivalent” units, it comprehensively evaluates potential water deprivation for diverse users, including humans and ecosystems.
Volume of Water Used: By quantifying water abstraction for specific activities, this parameter considers usage in irrigation, industry, and domestic consumption. It assesses the direct impact on water availability resulting from the volume of water utilized.
Water Quality: Examining the water quality and factors in potential pollution or contamination from human activities. Considerations include the discharge of pollutants, chemicals, or harmful substances, with implications for human and ecosystem health.
Local Hydrological Context: This parameter accounts for the regional freshwater availability, encompassing factors like water stress, demand-supply balance, and overall hydrological conditions. Providing a broader understanding of water availability contributes to assessing the impact on users in the assessed region.
By integrating these parameters, the Water Impact Index offers a robust evaluation of human-induced impacts on water resources. It measures the extent of potential water availability reduction and sheds light on the implications for diverse water users, addressing both human populations and ecosystems.
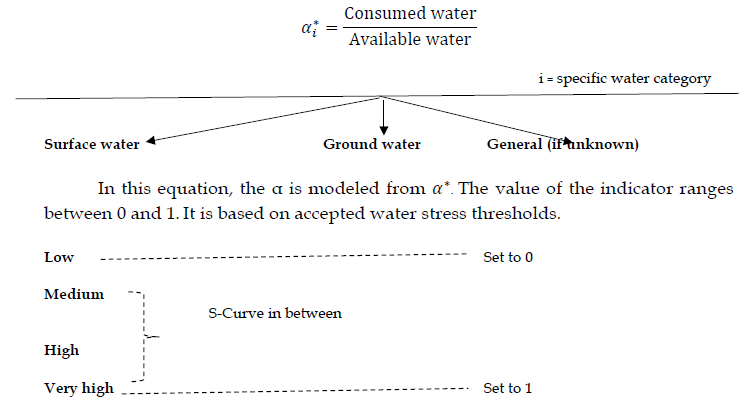
MEASUREMENT OF AWARE CHARACTERIZATION FACTOR
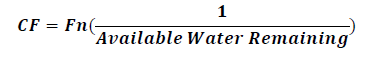
Assessing Water Availability Deprivation: The C.F. is a crucial metric for evaluating water availability in different regions. Represented mathematically as C.F., this factor is determined based on the remaining available water, with the function Fn relating it to the C.F. The C.F. is constrained within a range from 0.1 to 100, where a value of 1 indicates a region with the same remaining water per area as the world average.
Assessing Agricultural and Non-Agricultural Water Use: C.F.s for water use are derived from country annual averages, computed based on water consumption-weighted averages at monthly and watershed levels. Aggregating data from more minor scales to larger ones helps understand water consumption’s time and space distribution, benefiting agricultural and non-agricultural users.
Quantifying Remaining Available Water: The formula calculates Available Water Remaining by subtracting demand from availability, reflecting the potential water availability to fulfill future demands. This calculation aids in assessing overall water availability and identifying potential scarcity risks in each system or region. This approach provides a comprehensive understanding of water availability and facilitates the assessment of the impact or risk of remaining available water on different users.
RELATIVE REGIONAL WATER STRESS
Boulay et al. (2015; 2016) constructed the relative regional stress of the AWARE index in the following manner:
AWARE = water consumption X C.F.
The formula calculates the AWARE metric by multiplying the water consumption value by the C.F. This multiplication considers both the volume of water consumed and the relative impact of that consumption on water availability for other users. The AWARE value highlights the remaining or available water resources not consumed and indicates the potential risk of reduced water availability or deprivation. This method offers a straightforward approach to measuring water consumption. However, the suitability of this approach is still a subject of discussion (Pfister et al., 2017).
SPATIO-TEMPORAL VARIABILITY
In Life Cycle Assessment (LCA), minimizing uncertainty involves assessing standard deviations across temporal and spatial dimensions. When the temporal dimension exhibits a higher standard deviation than the spatial dimension, focusing on enhancing temporal resolution precedes spatial resolution improvement.
In Pakistan, diverse geographical and climatic factors contribute to spatio-temporal water variability. Regional disparities, exacerbated by climate change, urbanization, and inefficient agricultural practices, affect arid regions like Balochistan. Addressing this requires comprehensive strategies, including sustainable water management, infrastructure development, and climate resilience measures.
The indices incorporated into this study offer a comprehensive evaluation of Pakistan’s water scarcity, addressing both theoretical and practical dimensions. Metrics like the Falkenmark Indicator and Water Availability Index provide quantitative assessments by linking data to scarcity thresholds, while models such as the WSI and AWARE characterization capture temporal and spatial variability reflective of Pakistan’s climatic diversity. Additionally, withdrawal and consumption ratios highlight sectoral impacts across domestic, industrial, and agricultural demands. By explicitly connecting these methodologies to Pakistan’s unique water challenges, the revised framework ensures a holistic understanding of water resource management.
RESEARCH HYPOTHESES
This article seeks to validate the following hypotheses.
Hypothesis 1: Using various methodologies, a comprehensive evaluation of diminished water availability indicators can effectively quantify and assess the extent of water scarcity in Pakistan by considering factors such as water availability, demand, and stress.
Hypothesis 2: The quantitative indices and the AWARE Model, implemented through the AQUASTAT Dissemination System, World Development Indicators (WDI), and Water Use in Life Cycle Assessment method (WULCA), accurately measure the remaining available water in Pakistan within the LCA context.
Hypothesis 3: A higher quantity of water remaining per unit area correlates with a lower potential for depriving other users in Pakistan. This hypothesis proposes a direct link between water availability per unit area and the potential impact on other users, suggesting that greater water availability indicates a more sustainable and less resource-constrained situation.
Hypothesis 4: The formula for C.F. units, comparing regional and global water consumption, provides insights into the relative scale of water impact within the international context. This aids in evaluating water resource management, sustainability, and potential impacts on other users or ecosystems.
EMPIRICAL RESULTS
This section discusses various aspects of water stress, availability, and agriculture in Pakistan from 1980 to 2020. It notes positive trends in access to safe drinking water, with 80.5% of people having access in 1980, increasing to 91.4% in 2020. The percentage of the population using safely managed drinking water services also increased from 29.83% to 48.55%. There was a substantial improvement in basic handwashing facilities, rising from 40.92% to 81.80%. Irrigated agricultural landscape challenges included salinization and waterlogging, affecting 7,003,000 hectares and 7,072,000 hectares in 2020. The Flood Occurrence Index for 2020 was 3.9, indicating the frequency of flooding events. Pakistan saw a slight reduction in the percentage of land dedicated to cultivation, with an increase in permanent crop areas. Population density rose significantly, reflecting rapid urbanization and population growth. Despite a slight increase in total dam capacity, dam capacity per capita decreased notably. Pakistan’s total renewable water resources per capita declined from 3161.9 m³/inhabitant/year in 1980 to 1,117.29 m³/inhabitant/year in 2020, falling below the Falkenmark Indicator’s critical threshold. Renewable internal freshwater resources per capita also decreased significantly.
A study by Khan et al. (2023) examined domestic water usage in specific Pakistani cities, noting variations in per capita consumption from 30 to 350 liters/day. Limited-income individuals faced challenges of contaminated or inadequate water supply. The proportion of domestic use in total freshwater withdrawals rose from 1.19% in 1980 to 5.26% in 2020. The Pakistan Water Availability Index declined from 0.312 in 1980 to 0.231 in 2020, indicating a small surplus in water availability but with increasing pressure. The withdrawal-to-availability ratio rose from 9.73 in 1980 to 13.81 in 2020, showing “Very high” water stress. Total water withdrawal increased from 154.07 to 183.45 BCM from 1980 to 2020, with freshwater withdrawal as a percentage of total renewable water resources rising from 62.43% to 76.82%. Agricultural water withdrawal decreased slightly from 60.94% to 93.98%, while industrial withdrawal went down from 1.19% to 0.76%. Municipal withdrawal increased significantly from 1.19% to 5.26%. These trends highlight the need for sustainable water management strategies in Pakistan.
In Pakistan, the interannual variability in exploitable water resources and dam capacity was reported as 2.4, while the seasonal variability was 2.7 in 2020. Water stress intensified from 94.51% in 1980 to 116.31% in 2020, indicating increased pressure on water resources and the urgent need for sustainable water management strategies. The proposed WSI in Pakistan changed from 0.033 in 1980 to 0.314 in 2020, categorizing the country as “High” in water stress. Environmental Flow Requirements remained constant at 83.79 BCM per year, reflecting a consistent demand for ecological sustainability. Industrial water use efficiency increased significantly from 5.14 US dollars/m3 in 1980 to 36.63 US dollars/m3 in 2020, indicating growing pressure on water resources in the industrial sector. Overall water use efficiency in 2020 was 1.54 US dollars/m3, highlighting the economic cost of water usage and the need for sustainable water management practices in Pakistan.
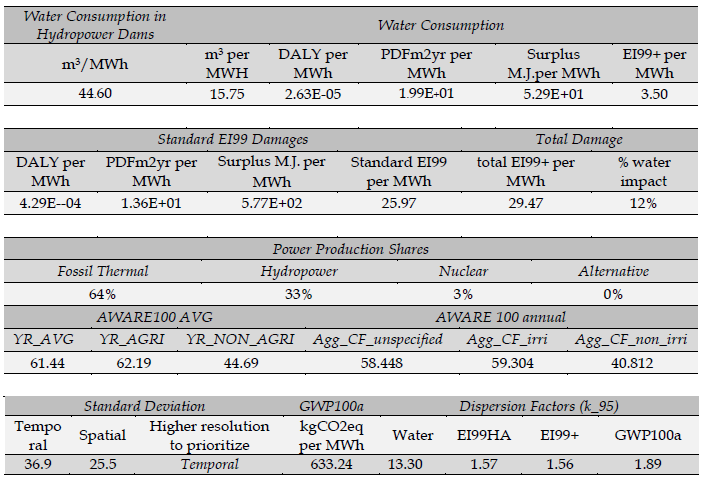
The study uses indices like the AWARE C.F. and the WULCA to enhance water footprint assessments in Pakistan (Boulay et al. 2018). The water consumption rate for hydropower dams is 44.60 cubic meters per megawatt-hour (m3/MWh), which is crucial for assessing hydropower project efficiency. Managing water consumption in these dams is vital for balancing clean energy demand with responsible water resource use. The water consumption associated with energy production in Pakistan is typically 15.75 cubic meters per megawatt-hour (m3/MWh), with low health impacts. Environmental impacts include photochemical oxidant formation of 19.9 per square meter per year per megawatt-hour (PDFm2yr per MWh) and a surplus of 52.9 megajoules per megawatt-hour (Surplus M.J. per MWh). The Eco-Indicator 99+ score per megawatt-hour (EI99+ per MWh) is 3.50, indicating a moderate overall ecological impact. This data provides insights into water and environmental considerations in energy generation, highlighting areas for efficiency and sustainability improvements.
The Eco-Indicator 99 methodology reveals that for every megawatt-hour of energy generated in Pakistan, there are 4.29E-04 disability-adjusted life years per megawatt-hour, indicating a relatively low health burden. Photochemical oxidant formation is 13.6 per square meter per year per megawatt-hour (PDFm2yr per MWh), with a substantial surplus of 577 megajoules per megawatt-hour (Surplus M.J. per MWh). The overall standard Eco-Indicator 99 score per megawatt-hour (Standard EI99 per MWh) is 25.97, suggesting a significant ecological impact. Using the comprehensive Eco-Indicator 99+ (EI99+) methodology, the total damage associated with energy production in Pakistan is 29.47 per megawatt-hour (total EI99+ per MWh), including health and environmental impacts. This data emphasizes the importance of health, environmental factors, and water-related considerations in assessing the sustainability of Pakistan’s energy production.
Pakistan’s power production relies heavily on fossil thermal sources (64% of the total output) and hydropower (33%). Nuclear power contributes 3%, while the alternative energy sector, including solar and wind, currently makes up zero percent of the mix. This distribution reflects the dominance of conventional energy sources, with the potential for future exploration of alternative and sustainable options to diversify the energy mix. In Pakistan, precipitation levels vary significantly throughout the year. January experienced substantial precipitation of 98.67, gradually decreasing to 12.31 in May 2023. There is a notable increase from June to September, peaking at 99.81 in August, followed by a decline, with December registering 97.39. This pattern reflects a monsoonal influence, with a distinct wet season from June to September and drier conditions during the remaining months. Understanding this temporal variability is crucial for effective water resource management and agricultural planning in Pakistan.
The AWARE100 values in Pakistan show that agricultural water use efficiency is slightly higher (62.19) than for non-agricultural purposes (44.69). These insights aid decision-making in water resource management and sustainable farming. Pakistan’s diverse geography and climate lead to critical spatio-temporal variability in water availability. Arid regions like Balochistan face water shortages from low rainfall and high evaporation rates. Climate change intensifies these challenges. Addressing this requires sustainable water management and climate resilience strategies. Pakistan exhibits high variability in water availability, emphasizing the need for improved water resource management. The climate change impact of electricity generation in Pakistan is significant, with a global warming potential over 100 years (GWP100a) of 633.24 kgCO2eq per MWh. Addressing this impact is crucial for Pakistan to contribute to international climate change mitigation efforts and build a more sustainable energy infrastructure. Dispersion factors (k_95) provide insight into the environmental impact of substance releases across different categories. For water, the dispersion factor is 13.30, indicating the potential for pollutants to spread and affect water quality.
Regarding human health impact (EI99HA), the factor is 1.57, showing the extent of dispersion and harm to human health. The Eco-Indicator 99+ (EI99+) dispersion factor is 1.56, measuring the overall ecological impact. The global warming potential over 100 years (GWP100a) has a dispersion factor of 1.89, illustrating the influence of climate change. These values are crucial for assessing and managing environmental risks, guiding policies to minimize the dispersion and influence of ingredients released into the environment, and promoting sustainable practices in Pakistan (See Appendix A1). The analysis highlights water availability in Pakistan, with a limited share of global freshwater resources (0.5%) and only 36% of the population having access to safe drinking water. The wastewater treatment ratio is exceptionally low at 1%. Climatic changes are evident, with an average annual temperature increase of almost 0.57°C over the past century, indicating climate change and heightened water demands. Pakistan ranks 5th in the global climate risk index, with 80% of the population suffering from water stress and predicted water shortages by 2025 at 31%. With a Water Resources Vulnerability Index of 82%, Pakistan ranks 160th globally in water resources. These indicators emphasize the urgent need for strategic water management and conservation efforts in Pakistan to address imminent challenges posed by water scarcity and climate change.
This detailed methodology and the results highlight the rigor and validity of the hypothesis testing process in our study.
Hypothesis 1: Various indices, such as water availability, demand, and stress levels, were calculated using global datasets like AQUASTAT, WDI, and Food and Agriculture Organization (FAO) to test the hypothesis that a comprehensive evaluation of water availability indicators can effectively quantify water scarcity in Pakistan. The results demonstrate that these metrics comprehensively capture the extent of water scarcity in the country.
Hypothesis 2: The hypothesis that the AWARE Model, implemented through AQUASTAT Dissemination Systems and WULCA methods, effectively measures water availability within the LCA context was validated by calculating quantitative indices. The indices accurately reflected the remaining water resources and their sustainability, supporting the hypothesis.
Hypothesis 3: No regression analysis was conducted for the hypothesis proposing that higher water availability per unit area correlates with a lower potential for depriving other users. Instead, a matrix of relationships was calculated using specific formulas. The results confirmed that increased water availability per unit area reduces the potential for deprivation, thus validating the hypothesis through precise quantitative metrics.
Hypothesis 4: The hypothesis that the formula for C.F. units helps compare regional and global water consumption impacts was tested by applying the formula to evaluate water resource management. This approach provided insights into the scale and sustainability of water impacts regionally and globally, confirming its utility for comparative assessments. Effective measures and policies can motivate individuals toward water security, highlighting the importance of efficient water usage and sustainability.
DISCUSSION
Our empirical study on water stress and availability in Pakistan provides a comprehensive analysis of various factors affecting water resources, offering insights that can be compared and contrasted with findings from earlier studies. The literature review highlighted global concerns about water availability, citing factors such as population growth and economic activities (Pimentel et al., 2004). The discussion in the empirical study delves deeper into the specific challenges faced by Pakistan due to rapid industrialization, urbanization, and population growth, which have resulted in substantial pressure on water sources (Soomro, 2011). As outlined by the study, the situation in Pakistan mirrors the global trends discussed in the literature. Earlier studies emphasized the importance of water quality alongside quantity, noting the impact of industrial growth on drinking water contamination (Park, 2007). The prioritization of water quantity by water and sanitation agencies exacerbates the issue, resulting in just 25% of the population having access to safe drinking water. (Nils, 2005). The linkage between water quality, public health, and industrial activities is a recurring theme in the literature and the empirical study.
The prediction by the PCRWR in 2018 regarding minimal freshwater availability by 2025 aligns with the empirical study’s findings of a significant decrease in per capita water availability below the threshold for water shortage (Aziz et al., 2018; Shukla, 2018). The alarming risks of arsenic contamination, drought-related deaths, and the lack of storage systems highlighted in the study resonate with the literature’s concern about water scarcity, ongoing water conflicts, and threats to glacier reserves (Kirby et al., 2014; Guglielmi, 2017; Nabi et al., 2018). The study’s examination of societal practices influencing water use, especially in rural areas, aligns with the literature’s recognition of the impact of climate change and socioeconomic progress on hydrological cycles and water security (Mekonnen and Hoekstra, 2016). The empirical study contributes by incorporating various water scarcity indicators, such as the AWARE C.F. and the WULCA initiative, providing a nuanced perspective on water usage.
The comprehensive set of recommendations in the empirical study echoes the literature’s call for a holistic approach to water resource management, including formulating a national water policy, infrastructure development, climate change adaptation, and consideration of social and environmental factors (Shakeel et al., 2023). The empirical study builds upon earlier research, offering a detailed analysis of water stress and availability in Pakistan. The findings align with global concerns outlined in the literature while providing specific insights into the challenges faced by Pakistan. The recommendations presented in the study are in harmony with earlier calls for a holistic approach to address water scarcity, emphasizing the interconnectedness of environmental, social, and economic factors.
CONCLUSION AND POLICY RECOMMENDATIONS
Water scarcity in Pakistan is a multifaceted issue driven by population growth, urbanization, climate change, and inadequate infrastructure. The challenges associated with the Indus River system, including limited storage capacity, inefficient farming practices, and mismanagement of resources, exacerbate the country’s water stress. This study, spanning data from 1980 to 2020, highlights these issues but also reveals limitations in its reliance on development-oriented perspectives and the absence of a robust theoretical framework and transparent methodological approach. Despite these shortcomings, the research identifies key drivers of water scarcity, such as rising water demand due to population growth and urbanization, climate change impacts like irregular rainfall and temperature variability, infrastructure constraints, and the lack of wastewater treatment systems that exacerbate pollution and reduce water availability.
Addressing these challenges requires comprehensive policy measures. Enhancing water use efficiency in agriculture through modern irrigation techniques, promoting conservation practices, and optimizing water consumption in industry and services are critical steps. Additionally, integrated water resource management frameworks, improved governance, and institutional capacity are essential for sustainable water allocation. Investing in infrastructure, such as expanding storage capacity, developing wastewater treatment plants, fostering public awareness, and incentivizing conservation, can alleviate water stress. International collaboration on transboundary water-sharing agreements and access to global expertise and funding is equally crucial. Research and innovation must be prioritized to improve data collection, advance modeling techniques, and develop adaptive management strategies.
Pakistan must translate these recommendations into actionable policies, requiring coordinated efforts from the government, private sector, and civil society. Streamlined regulations, adherence to principles, and periodic reassessment of strategies are vital to achieving water-related Sustainable Development Goals by 2030. While immediate interventions are necessary, long-term strategies grounded in sound theoretical and methodological frameworks are imperative to ensure resilience and sustainability. By addressing these gaps and operationalizing evidence-based policies, Pakistan can secure its water future and balance growing demands with environmental sustainability.
REFERENCES
Abbasi, J. (2022, July 13). The looming ‘water crisis’ in Pakistan needs due attention. Daily Islamabad Post. https://islamabadpost.com.pk/the-looming-water-crisis-in-Pakistan-needs-due-attention/
Ashraf, S., Ali, M., Shrestha, S., Hafeez, M. A., Moiz, A., & Sheikh, Z. A. (2022). Impacts of climate and land-use change on groundwater recharge in the semi-arid lower Ravi River basin, Pakistan. Groundwater for Sustainable Development, 17, 100743. https://doi.org/10.1016/j.gsd.2022.100743
Aziz, D., Masood, A., & Hashmi, Z. (2018). Turning the tide, The News International. https://www.thenews.com.pk/print/328174-turning-the-tide
Baccour, S., Goelema, G., Kahil, T., Albiac, J., van Vliet, M., Zhu, X., & Strokal, M. (2024). Water quality management could cost-effectively halve future water scarcity: A case study in the Pearl River Basin. Nature Communications, 15(1). https://doi.org/10.1038/s41467-024-49929-z
Boulay, A. M., Bouchard, C., Bulle, C., Deschênes, L., & Margni, M. (2011a). Categorizing water for LCA inventory. The International Journal of Life Cycle Assessment, 16(7), 639-651.
Boulay, A. M., Bulle, C., Bayart, J. B., Deschênes, L., & Margni, M. (2011b). Regional characterization of freshwater use in LCA: Modeling direct impacts on human health. Environmental Science & Technology, 45(20), 8948-8957. https://doi.org/ 10.1021/es1030883
Boulay, A. M., Bare, J., Benini, L., Berger, M., Lathuillière, M. J., Manzardo, A., Margni, M., Motoshita, M., Núñez, M., Pastor, A. V., Ridoutt, B., Oki, T., Worbe, S., & Pfister, S. (2018). The WULCA consensus characterization model for water scarcity footprints: Assessing impacts of water consumption based on available water remaining (AWARE). International Journal of Life Cycle Assessment, 23, 368-378. https://doi.org/10.1007/s11367-017-1333-8
Boulay, A. M., Bare, J., De Camillis, C., Döll, P., Gassert, F., Gerten, D., Humbert, S., Inaba, A., Itsubo, N., Lemoine, Y., Margni, M., Motoshita, M., Núñez, M., Pastor, A. V., Ridoutt, B., Schencker, U., Shirakawa, N., Vionnet, S., Worbe, S., Yoshikawa, S., & Pfister, S. (2015). Consensus building on the development of a stress-based indicator for LCA-based impact assessment of water consumption: Outcome of the expert workshops. International Journal of Life Cycle Assessment, 20(5), 577-583.
Boulay, A. M., Bare, J., Benini, L., Berger, M., Michael, J., Lathuilliere, Manzardo, A., Margni, M., Motoshita, M., Núñez, M., Pastor, A. V., Ridoutt, B., Oki, T., Worbe, S., & Pfister, S. (2016). The WULCA consensus characterization model for water scarcity footprints: Assessing impacts of water consumption based on available water remaining (AWARE).
Falkenmark, M., Lundqvist, J., & Widstrand, C. (1989). Macro-scale water scarcity requires micro-scale approaches. Natural Resources Forum, 13(4), 258-267. https://doi.org/10.1111/j.1477-8947.1989.tb00348.x
Falkenmark, M., & Rockström, J. (2004). Balancing water for humans and nature: The new approach in ecohydrology. Earthscan.
Falkenmark, M. (2013). Growing water scarcity in agriculture: Future challenge to global water security. Philosophical Transactions of the Royal Society A: Mathematical, Physical and Engineering Sciences, 371(2002), 20120410.
Frischknecht, R., Steiner, R., Braunschweig, A., Egli, N., & Hildesheimer, G. (2006). Swiss ecological scarcity of water method: The new version 2006. Swiss Federal Office for the Environment (FOEN).
Guglielmi, G. (2017). Arsenic in drinking water threatens up to 60 million in Pakistan. Science. http://www.sciencemag.org/news/2017/08/arsenic-drinking-water-threatens-60-million-pakistan
Hadid, D. (2019, November 21). Maybe it will destroy everything’: Pakistan’s melting glacier causes alarm. NPR. https://www.npr.org/2019/11/21/779412377/maybe-it-will-destroy-everything-pakistan-s-melting-glaciers-cause-alarm
Hafeez, M. M., Ahmed, R. N., Khan, M. D., & Safdar, M. A. (2020). What are the crises and issues of governance in Pakistan? An analysis. Review of Applied Management and Social Sciences, 3(1), 53-59. https://doi.org/10.47067/ramss.v3i1.24
Hoekstra, A. Y., Chapagain, A. K., Aldaya, M. M., & Mekonnen, M. M. (2011). The water footprint assessment manual. Earthscan. http://www.waterfootprint.org/ ?page=files/ WaterFootprintAssessmentManual
Hoekstra, A. Y., Mekonnen, M. M., Chapagain, A. K., Mathews, R. E., & Richter, B. D. (2012). Global monthly water scarcity: Blue water footprints versus blue water availability. PLoS ONE, 7(2), e32688. https://doi.org/10.1371/journal.pone. 0032688
Hoekstra, A. Y. (2016). A critique on the water-less availability of water weighted water footprint in LCA. Ecological Indicators, 66, 564-573. http://linkinghub.elsevier.com/retrieve/pii/S1470160X16300474
Hifza, R., Fauzia, A., Kiran, A., & Ashraf, M. (2021). Drinking water quality in Pakistan: Current status and challenges. Pakistan Council of Research in Water Resources (PCRWR). https://pcrwr.gov.pk/wp-content/uploads/2021/10/Drinking-Water-Quality-in-Pakistan-2021.pdf
Iqbal, A. R. (2010). Water shortage in Pakistan- A crisis around the corner. ISSRA Papers, 2(2), 1-13.
Khan, H. F., Arif, M. A., Intikhab, S., & Arshad, S. A. (2023). Quantifying household water use and its determinants in low-income, water-scarce households in Karachi. Water, 15(19), 3400. https://doi.org/10.3390/w15193400
Kirby, J. M., Connor, J., Ahmad, M. D., Gao, L., & Mainuddin, M. (2014). Climate change and environmental water reallocation in the Murray–Darling Basin: Impacts on flows, diversions and economic returns to irrigation. Journal of Hydrology, 518(Part A), 120-129. https://doi.org/10.1016/j.jhydrol.2014.01.024
Maitlo, N. A. (2019, May 29). Water scarcity: A threat for Pakistan. The Nation. https://nation.com.pk/29-May-2019/water-less-availability-of-water-a-threat-for-pakistan
Meigh, J. R., McKenzie, A. A., & Sene, K. J. (1999). A grid-based approach to water scarcity estimates for Eastern and Southern Africa. Water Resources Management, 13(2), 85-115. https://doi.org/10.1023/A:1008025703712
Mekonnen, M. M., & Hoekstra, A. Y. (2016). Four billion people facing severe water scarcity. Science Advances, 2(2), e1500323. https://doi.org/10.1126/ sciadv.1500323
Muqarrab, A., Shoaib, A. K., Shumaila, D., & Muhammad, T. H. (2021). Water crisis in Pakistan: Prospects and implications. PalArch’s Journal of Archaeology of Egypt/Egyptology, 18(1), 4884-4892.
Muzammil, M., Azlan, Z., & Lutz, B. (2020). Water resources management strategies for irrigated agriculture in the Indus Basin of Pakistan. Water, 12(5), 1429. https://doi.org/10.3390/w12051429
Nabi, G., Ullah, S., Khan, S., Ahmad, S., & Kumar, S. (2018). China-Pakistan Economic Corridor (CPEC): Melting glaciers a potential threat to ecosystem and biodiversity. Environmental Science and Pollution Research, 25(4), 3209-3210. https://doi.org/10.1007/s11356-017-1151-3
Nils, R. (2005). The drinking water crisis in Pakistan and the issue of bottled water (Actioned Pakistan, 2).
Park, K. (2007). Preventive and social medicine (25th ed.). M/S BanarsidusBhanot.
Pimentel, D., Berger, B., Filiberto, D., Newton, M., Wolfe, B., Karabinakis, E., & Nandagopal, S. (2004). Water resources: Agricultural and environmental issues. BioScience, 54(10), 909-918.
Pinero, E., Bayart, J., Bénichou, F., Grimaud, J., & Aoustin, E. (2011). Veolia’s water impact index, a new tool for water footprinting. Proceedings of the Water Environment Federation, 2011(10), 980-983. https://doi.org/10.2175/ 193864711802836526
Pfister, S., & Hellweg, S. (2009). The water shoesize vs. footprint of bioenergy. Proceedings of the National Academy of Sciences, 106(2), E93-E94.
Pfister, S., Boulay, A. M., Berger, M., Hadjikakou, M., Motoshita, M., Hess, T., Ridoutt, B., Weinzettel, J., Scherer, L., Döll, P., Manzardo, A., Núñez, M., Verones, F., Humbert, S., Buxmann, K., Harding, K., Benini, L., Oki, T., Finkbeiner, M., & Henderson, A. (2017). Understanding the LCA and ISO water footprint: A response to Hoekstra (2016) “A critique on the water-scarcity weighted water footprint in LCA”. Ecological Indicators, 72, 352-359. https://doi.org/10.1016/ j.ecolind.2016.07.051
Traskin, P., & Gleick, P. H. (1997). Water futures: Assessment of long-range patterns and problems. Stockholm Environmental Institute.
Ridoutt, B. G., & Pfister, S. (2010). A revised approach to water footprinting to make transparent the impacts of consumption and production on global freshwater scarcity. Global Environmental Change, 20(1), 113-120. https://doi.org/10.1016/ j.gloenvcha.2009.08.003
Raza, M., Hussain, F., Lee, J. Y., Shakoor, M. B., & Kwon, K. D. (2017). Groundwater status in Pakistan: A review of contamination, health risks, and potential needs. Critical Reviews in Environmental Science and Technology, 47(18), 1713-1762. https://doi.org/10.1080/10643389.2017.1400852
Sahoutara, S. (2017). Karachi’s water is unfit for human consumption. The Express Tribune. https://tribune.com.pk/story/1458783/90-water-supplied-karachi-unfit-human-consumption/
Shakeel, A., Haifeng, J., Anam, A., Dingkun, Y., Zhengxia, C., Changqing, X., Wang, C., Qimeng, J., Zhang, X., Muhammad, I., & Rasheed, A. (2023). Water resources and their management in Pakistan: A critical analysis on challenges and implications. Water-Energy Nexus, 6, 137-150. https://doi.org/10.1016/ j.wen.2023.10.001
Shukla, V. (2018). Quantity and quality. Ecological Indicators, 34, 441-449. https://doi.org/10.1016/j.ecolind
Shukla, V. (2021, February 25). Pakistan’s alarming water crisis: Country to run out of clean water by 2025. (2018, May). ValueWalk. https://www.valuewalk.com/ 2018/05/pakistan-water-crisis-clean-water-2025/
Soomro, Z. A., Khokhar, M. I. A., Hussain, W., & Hussain, M. (2011). Drinking water quality challenges in Pakistan. World Water Day, 17-28.
Vörösmarty, C. J., Douglas, E. M., Green, P. A., & Revenga, C. (2005). Geospatial indicators of emerging water stress: An application to Africa. Ambio, 34(3), 230-236. http://www.bioone.org/doi/abs/10.1579/0044-7447-34.3.230
Wattoo, Z. I. (2022). Water scarcity could be killing our economy. Rehman Habib Consultants Pvt. Ltd. https://www.linkedin.com/pulse/water-less-availability-of-water-could-killing-our-economy-zafar-iqbal-wattoo?trk=public_profile_article_view
WHO & UNICEF. (2012). Progress on drinking water and sanitation. Joint Monitoring Programme.
Zaheer, H. J. (2022). A critical review of the water crisis in Pakistan. Webology, 19(2), 10007-10014. http://www.webology.org
Appendix A1
The calculations correspond to the final deliverable of the WULCA working group, modeled in LCA.