ABSTRACT
This article utilizes confirmatory factor analysis through the JASP Program, as indicated by loading factors exceeding 0.5, to uncover key factors playing a significant role in the success of an esteemed night market, the Ton Tann Green Market, Khon Kaen, Thailand, including product, pricing, place, people, and facilities. Managing Cronbach’s alpha values at 0.7 ensures the reliability of collected data by assessing internal consistency and convergence. A variety of fit indices were also used to quantify the model’s suitability and ability to represent relationships between observed variables. An appropriate sample size of 305 respondents was determined and the collected data was statistically sound and capable of accurately validating the research findings. Respondents in this survey rated their satisfaction on a five-point Likert scale, revealing valuable information about tourist behavior. The findings are crucial for improving the night market. Tourists can benefit from harnessing these factors, especially younger demographics and tourists satisfied with place, people, price, and facilities. These findings provide crucial recommendations to both policymakers and entrepreneurs, ensuring that the market retains its relevance as a pillar of the Khon Kaen community while simultaneously upholding local traditions.
Keywords: Factor analysis, satisfaction, night market, tourism, Khon Kaen.
INTRODUCTION
Night markets have gained immense popularity as sought-after tourist destinations, offering a rich tapestry of cultural experiences, local products, and vibrant atmospheres that contribute to the charm of various locations (Chomvilailuk & Butcher, 2010). Despite the widespread appeal and interest in night markets by scholars, there have been few studies in Thailand, and none of the Ton Tann Green Market, a renowned tourist night market nestled in Khon Kaen, Thailand. This article is the first to meticulously scrutinize the viewpoints of customers frequenting this unique market, thereby broadening scholars’ understanding of urban night markets in Thailand and beyond.
Through an exhaustive assessment of tourist satisfaction, this article also provides Thailand’s entrepreneurs and the business community with invaluable insights about how patrons perceive night markets. It underscores the paramount importance of acknowledging the broader context in which micro-entrepreneurs operate, recognizing their integral role in shaping the overall tourist experience (Hung & Wu, 2020; Li et al., 2021). By exploring the intricate factors that shape the way tourists perceive night markets across a spectrum of tourist groups visiting Ton Tann Green Market, each characterized by their unique socio-demographic profiles, this article’s findings can help inform the segmentation of markets and the development of tailored marketing strategies (Sohail et al., 2018).
Night markets are central hubs of cultural exchange within Asian societies. A deeper understanding of tourist satisfaction not only contributes to the preservation of cherished traditions but also enhances community prosperity. Improvements in infrastructure, culinary offerings, safety measures, and cultural activities collectively enhance the quality of tourist experiences. This research article has the potential to inform policies elevating overall tourist experiences, attract more tourists, and breathe new life into the tourism industry in Khon Kaen and elsewhere.
Night markets offer a diverse array of products, including traditional artifacts and trendy collectibles. The Ton Tann Green Market has a unique layout, featuring distinct zones such as the Ton Tann, Gypsy Market, Tann Daeng, Tann Blue, Tann Khao (Let’s Eat Together), and Tann Som (Watching the Sun) zones. Additionally, the market incorporates the Ton Tann Art Space and Gallery, an art gallery complementing the overall market experience (Pa Lan La, 2020). Tourist experiences of and satisfaction with night markets are influenced by various factors, such as the diversity of on-site activities (Mat Som et al., 2018). The market’s location and facilities, such as the presence of other tourists and feelings of acceptance, significantly affect tourists’ experiences (Seočanac & Dimitrovski, 2022). Creating a relaxed and enjoyable atmosphere is key to shaping consumer behavior (Mat Som et al., 2018). Social interactions with vendors and other tourists, including factors like staff, the presence of other people, atmosphere, and music, positively impact tourists’ experiences and encourages them to recommend experiences to others (Seočanac & Dimitrovski, 2022).
Additionally, authenticity and cultural immersion are drivers for tourists visiting night markets as they seek to learn about local specialties, history and culture (Liu et al., 2021). Tourists are drawn to night markets by opportunities to enjoy entertainment and activities, and seek new and meaningful experiences, particularly by exploring various foods (Chang & Hsieh, 2006). Safety and cleanliness are essential considerations, especially in the early development of night tourism, as issues like inadequate lighting, space congestion, and safety concerns can affect the overall experience (Huang et al., 2023). Furthermore, pricing and value for money are critical factors influencing customer satisfaction in night market tourism, which may be influenced by elements like brand equity, benefits, and pricing (Liu et al., 2021).
By shedding light on the factors that influence tourists’ satisfaction perceptions in the Ton Tann Green Market, this research aims to provide practical implications for destination management organizations, local businesses, and policymakers. Ultimately, the study seeks to aid in the development of effective strategies to enhance the overall tourist experience and further promote the Ton Tann Green Market as a must-visit destination for both domestic and international tourists.
LITERATURE REVIEW
NIGHT MARKETS AND TOURISM
Night markets are vibrant and thriving centers of activity, offering a plethora of consumer experiences encompassing food, tourism, shopping, entertainment, sports, exhibitions, and performances (Zhang et al., 2022). They serve as cities’ distinguished calling cards, attracting tourists and generating considerable economic advantages (Liu et al., 2021). Night markets in Asia, including in Taiwan, Thailand, Singapore, Malaysia, China, and Vietnam, hold immense appeal for tourists (Connell, 2017). They provide tourists with a remarkable nocturnal shopping and dining experience, allowing them to fully immerse themselves in local culture (Chang & Hsieh, 2006). Night markets feature myriad street food vendors and local shops offering a diverse range of merchandise, including clothing and accessories (Kalnaovakul & Promsivapallop, 2021). Found in both urban and rural areas, night markets offer distinctive consumption experiences, tantalizing snack options, captivating displays, and an extensive array of commodities (Ahmad et al., 2019). Tourists are enticed there for various reasons, such as the opportunity to deeply engage in local culture and witness traditional customs and traditions (Kuo et al., 2012). The night economy, encompassing services, businesses, and activities catering to the entertainment needs of both tourists and locals, plays a pivotal role in maximizing time utilization, diversifying activities, and attracting tourists (Huong, 2021). Local economies are bolstered by investment and employment opportunities (Bozick, 2009).
Numerous studies have looked at the relationship between night markets and tourism in Thailand. As asserted by Bamrongpol et al. (2020), night markets hold significant sway over tourists, particularly among the younger generation, when deciding to explore the wonders of Thailand. The preservation of cultural heritage takes precedence, and the government has played a pivotal role in this endeavor by providing financial backing to foster the growth and progress of small businesses operated by local communities. Furthermore, leveraging cultural resources to bolster tourism has also emerged as a key factor in safeguarding the richness of cultural heritage (Lo & Janta, 2020). Nevertheless, the surging popularity of night markets has sparked concerns regarding the consequences of over-tourism and its impacts. As articulated by Nguyen & Peña-García (2019), residents have voiced apprehension regarding the adverse effects of tourism on their quality of life, such as amplified noise levels, traffic congestion, and environmental deterioration. To tackle these challenges, certain night markets have implemented sustainable tourism practices, encompassing waste reduction initiatives and the promotion of eco-friendly products. In a noteworthy case study of a night market in Chiang Mai, Sofronov (2017) discovered that sustainable tourism practices can engender positive outcomes for both the environment and local communities while simultaneously enhancing the overall tourist experience.
TOURIST BEHAVIOR IN NIGHT MARKETS
Tourists are drawn to night markets for various reasons, including the wide range of products available. The variety of goods and services offered at night markets encourages tourists to spend money and contributes to a lively atmosphere and bustling business activity (Mat Som et al., 2018). Vendors and traders play a crucial role at night markets by providing food, goods, and services to consumers (Shin et al., 2019). Welcoming atmosphere of some night markets also influence tourist behavior, as their perception of the atmosphere significantly affects their satisfaction and intention to revisit (Liao & Hsiao, 2017). A friendly environment encourages tourists to spend more time exploring, leading to impulsive purchases due to the lively energy and abundance of options (Liang et al., 2021). Bargain hunting is a popular activity at night markets, as visitors are attracted low prices and discounts (Chen et al., 2017). Sensory stimulation, including bright lights, crowds, delicious aromas, and vibrant sounds, also influences tourist behavior at night markets (Hsieh & Chang, 2006). Social interaction plays a crucial role in enhancing the night market experience for tourists by providing them with new experiences and opportunities to learn about different cultures (Liu et al., 2018).
One study aimed to assess the compatibility between Hong Kong night market vendors’ perceptions of tourists and the evaluations made by tourists themselves (Lee et al., 2020). The study found that vendors maintain favorable attitudes toward international tourists, primarily driven by the economic benefits derived from serving them, and the vendors’ positioning within the market. Another study explored the current state of the Taishan night market and the organization of night markets in the People’s Republic of China (Li et al., 2021), highlighting the potential of night markets to be promoted as tourism attractions, offering economic advantages to host communities. Then, a Taiwanese study investigated the impact of night markets on local residents, considering the perspectives of four distinct groups. The research indicated that night markets not only provide food, shopping, and entertainment but also create opportunities for social interaction among local residents (Hung & Wu, 2020).
Studies have also examined the behavior of tourists in night markets in Thailand. Night markets are open late, usually from 4 p.m. until midnight or later, which allows tourists to visit after a day of sightseeing or other activities (Lee & Pearce, 2020). In Phuket, night markets attract tourists for souvenirs, clothing, and street food, with quality and variety being crucial factors determining experiences (Kalnaovakul & Promsivapallop, 2021).
TOURIST SATISFACTION
Night markets have gained popularity as tourist attractions in various parts of the world, particularly in East Asia (Hsu, 2020). Prior research indicates that several factors contribute to tourist satisfaction. Hsu (2020) emphasizes how crucial food and drink options are, highlighting that the quality, variety, and authenticity of available food and beverages play a crucial role in determining tourist satisfaction. Chen (2018) focuses on the shopping experience, stating that the availability of a diverse selection of affordable souvenirs and local products is a significant aspect of night market tourism. Tourists enjoy exploring the stalls and discovering unique mementos to bring back home. The atmosphere and ambience of night markets (Wang, 2019) draw in tourists. Entertainment and performances (Chang, 2017) are often offered at many night markets, including live music, dance shows, and other forms of entertainment. These elements contribute to the overall experience and enhance tourist satisfaction. Liu (2016) underlines the importance of cleanliness and safety in night markets. Tourists expect these markets to be clean and safe, with adequate lighting, waste management systems, and security measures in place. Huang (2019) emphasizes accessibility and location as attracting tourists. Tourists prefer markets that are within close proximity to their accommodations or other popular tourist attractions.
Regarding pricing, Zhang (2018) asserts that reasonable prices for food, drinks, and souvenirs are essential for ensuring tourist satisfaction. High prices or perceived rip-offs are likely to discourage tourists. Al-Salamin et al. (2015) highlight that good brand prices negatively impact purchasing, with low incomes hindering young people’s willingness to buy. By understanding tourists’ needs and catering to them, businesses can enhance the overall tourist experience and build long-term customer loyalty (Kim et al., 2020). This can be achieved through clear pricing information (Zhou et al., 2021), fair pricing strategies, and authentic products and experiences (Huang et al., 2017). Interacting with vendors effectively requires clear communication, trust-building, fairness, and diligent vendor selection (Diegmann et al., 2015). Interacting with vendors, trying new foods, and learning about the local way of life are aspects that tourists enjoy. The social interaction dimension of night markets is also significant (Liu, 2018). Tourists appreciate the opportunity to interact with other tourists and locals. Markets that offer communal seating or group activities provide avenues for socializing and can enhance the overall experience.
METHODOLOGY
A quantitative approach was used in this study in order to conduct descriptive analysis. The target population was visitors to Ton Tann Green Market in Khon Kaen. A total of 305 respondents were determined using the G*Power program by selecting linear multiple regression with a fixed model, an R2 deviation from zero, an error probability of 0.05, and a power (1-B error probability) = 0.95. The influence size was chosen as small (effect size = 0.25) due to the large (N > 10,000) sample size. The test confidence value was 0.95. An effect size of 0.25 is appropriate given the study’s objective of identifying consumer behavior at night markets and analyzing their impact on consumer decision-making (Kang, 2021). The effect size in this study is 0.25, which is considered small to medium since no large differences between groups were expected. A sample size that is appropriate for detecting meaningful differences between groups can be achieved by selecting this effect size (In et al., 2020).
The survey administered to respondents was structured into three sections: consumer demographics, shopping behaviors, and overall satisfaction. A five-point answer scale, ranging from “strongly dissatisfied” to “strongly satisfied,” was employed. To evaluate the survey’s validity, experts used the Item-Objective Congruence index (Rovinelli & Hambleton, 1977; Taber, 2018). Three specialists individually assessed each survey item against the specific objectives set by the test’s creators. Ratings of 1 (clearly measuring), -1 (clearly not measuring), or 0 (uncertain degree of measurement) were assigned to each item based on its alignment with each objective. Inspired by Rovinelli & Hambleton (1977), no item received a conformance index below 0.50, and the consistency index ranged from 0.60 to 1.00. Experts were kept unaware of the constructs being assessed to ensure impartial and independent evaluations. Each expert was provided with a list of objectives and used a predefined rubric to assess the extent to which each item corresponded with these objectives.
The internal consistency of the survey’s subscales was evaluated using Cronbach’s alpha coefficient (n = 30). An alpha value of 0.70 (Shemwell et al., 2015) was considered acceptable, and a reliability value of 0.85 (Hair et al., 2017), indicated that the survey met the quality acceptance criteria.
DATA COLLECTION
Data was generated from the sample of 305 respondents at Ton Tann Green Market in Khon Kaen, selected by accidental sampling. Data collection for the main survey took place from 2 April to 2 May, 2021. Research on confirmatory factor analysis (CFA) relied primarily on the rule of thumb ratio of respondents to free parameters, which was 10:1 (Kyriazos, 2018). A sample size of 25 x 10 (250) was calculated according to this formula, and 305 respondents were surveyed at the Ton Tann Green Market, where questionnaires were handed out. Consumers who visited the night market during the day for a week or a month were chosen to survey. The respondents visited the night market on weekends from 3 p.m. to 9 p.m. and on weekdays from 3 p.m. to 6 p.m. This research model has 25 parameters to estimate, and is an example of elemental analysis research; consequently, the data are sufficient to analyze the exploratory component, whose sample exceeded the specified criteria. The survey was tried out with a minimum of 30 respondents at another site to investigate profile, behavior, and satisfaction. The questionnaire contained 25 questions. Model fit was checked using the JASP program.
DATA ANALYSIS
Research proceeded by calculating descriptive statistics including percentages, averages, and standard deviations. The next step was to determine the elements that influence changes in purchase behavior. To rule out the potential of item connections producing an idfactor matrix, the researcher used a Bartlett’s sphericity test and a Kaiser-Meyer-Olkin (KMO) test to establish eligibility for factor analysis.
To assess the normality of scores, skewness and kurtosis were examined in the research studies cited. The Kolmogorov-Smirnov test and Shapiro-Wilk test were used to evaluate normality, and the assumption of normality was based on the skewness of values within the range ± 2 and the kurtosis of values within the range ± 7 (Blanca et al., 2013). Mardia’s Skewness Test and Mardia’s Kurtosis Test were also conducted to investigate the multivariate normality of distribution (Pehlivan et al., 2024). The convergent validity of the scales was determined using the measurement model, utilizing factor loadings, composite reliability (CR), and average variance extracted (AVE) (Hamid et al., 2015). The CR value is an additional metric used to assess convergent validity, with a threshold of 0.7 or higher considered satisfactory (Hair et al., 2010). The scale’s convergent validity was also verified by examining both AVE and CR (Hair et al. (2010). Likewise, to meet convergent validity criteria, AVE values should not dip below 0.5 (Cheung et al., 2023). To ensure convergent validity, we carefully scrutinized factor loadings, AVE values, and CR values. Factor loadings were required to exceed a predefined threshold, indicating the strength of the loading. CR values above 0.7 signify robust internal consistency and reliability (Hair et al., 2014). Additionally, AVE values surpassing 0.5 fulfilled the convergent validity requirement (Hair et al., 2014). To assess discriminant validity, we employed the heterotrait-monotrait ratio of correlations (HTMT) analysis. A cutoff level of 0.85 was used to indicate strong discriminant validity, while 0.9 denoted a lenient criterion for discriminant validity (Henseler et al., 2015).
In the context of CFA, acceptable model fit was indicated by a relative Chi-square value of 5.33. Goodness of fit (GFI) and adjust goodness of fit (AGFI) values > 0.9 demonstrated goodness of fit (Byrne, 2001). Additionally, comparative fit index (CFI), incremental fit index (IFI), and Tucker-Lewis index (TLI) values approaching 1 indicated a more suitable model, while values > 0.9 represented a good fit (Hu & Bentler, 1999). A standardized root mean square residual (SRMR) value below 0.10 was considered acceptable, with 0.80 indicating adequate fit and 0.50 suggesting good fit (Kim et al., 2016a). Root mean square error of approximation (RMSEA) values around 0.05 indicated a good fit, approximately 0.08 reflected a moderate fit, and values > 0.1 indicated a poor model fit (Kim et al., 2016a). A good fit between the model and the data does not mean the model is “right” or even that it explains a significant amount of the covariance. A “good model fit” only indicates that the model is plausible (Finch, 2020). When reporting the results of CFA, one is urged to report the indices of fit, including the Chi-square, GFI/AGFI, CFI/IFI/TLI, SRMR, and RMSEA.
FINDINGS
TOURIST PROFILES
A total of 305 respondents completed the survey, of whom 58.3 percent were female and 41.6 percent were male. In terms of age, 62.3 percent of respondents were between 20 and 39 years old, and 23.28 percent were under 20 years old. Several respondents were over 60 years old. In terms of marital status, 77.7 percent were single, while 19.02 percent were married. By employment status, the majority of respondents were students, and 12.46 percent were self-employed. In terms of educational background, 51.8 percent of respondents had a bachelor’s degree or higher, while 32.13 percent had less than a bachelor’s degree. In terms of monthly income, the 32 percent respondents earned less than 5,000 Thailand baht and 25 percent earned between 5,001 and 10,000 baht. The vast majority of consumer behavior was purposeful. A total of 40 percent of tourists were pursuing leisure; 30.16 percent were visiting in a personal car; 47.54 percent were visiting on a motorcycle; and 40 percent were spending between 501 and 1,000 baht, or 12.79 percent. More information is shown in table 1.
Table 1
Demographics of tourists.
|
Gender |
Number |
% |
Occupation |
Number |
% |
|
Male |
127 |
41.6 |
Student |
189 |
62 |
|
Female |
178 |
58.3 |
Government official |
31 |
10.2 |
|
Age (years old) |
Number |
% |
Self-employed |
38 |
12.5 |
|
<20 |
71 |
23.3 |
Worker |
35 |
11.5 |
|
20-39 |
190 |
62.3 |
Trader |
12 |
3.8 |
|
40-59 |
38 |
12.4 |
Education |
Number |
% |
|
60> |
6 |
2 |
No Bachelor degree |
98 |
32.1 |
|
Income (Y) |
Number |
% |
Bachelor degree |
158 |
51.8 |
|
<5,000 |
98 |
32.1 |
> Master degree |
49 |
16.1 |
|
5,001 - 10,000 |
75 |
24.6 |
Marital Status |
Number |
% |
|
10,001 - 15,000 |
61 |
20 |
Single |
237 |
77.7 |
|
>15,001 |
71 |
23.3 |
Married |
58 |
19 |
|
|
|
|
Divorced |
10 |
3.3 |
|
|
|
|
Divorced |
10 |
3.3 |
The results of the skewness analysis showed that most respondents were within the standard criterion, which was less than two results. The skewness analysis found that the values were between 1.58 and 0.94, mostly negative. This shows that the majority of respondents responded at a higher-than-average level, skewed to the left. The dimension with the smallest skewness value is the product, which has a skewness equal to -1.580, indicating that this dimension does not have the same or consistent opinions. The distribution of data is therefore not normal. As for the aspect with the highest skewness value, the salesperson had a skew value of -0.94. The kurtosis analysis result showed that most of the kurtosis values were between 1.027 and 4.348, which was within the standard criterion, which was less. Seven indicates that the height is higher than the normal curve set for normal data criteria. Skewness is between -2 and +2, and kurtosis is between -7 and +7 (Hair et al., 2017).
EXPLORATORY FACTOR ANALYSIS
Exploratory factor analysis (EFA) using varimax rotation was carried out to derive the underlying factor structure of shopping. The KMO index and Bartlett’s test of sphericity were used to determine factorability. The anti-correlation matrix’s diagonal was also examined for any values less than 0.5. Kaiser’s criterion (retention of variables with eigenvalues > 1), in combination with a visual inspection of the scree plots, were used to identify the ideal number of elements from the factor analysis. Only items with factor loadings larger than 0.4 were evaluated for inclusion in each component (Field, 2005). Table 2 shows the KMO index of sampling adequacy (KMO = 0.893), indicating the sampling sufficiency for the proposed analysis (Maskey et al., 2018). Bartlett’s test of sphericity was significant, with an approximate Chi-square of 3462.215 (p < 0.05).
Table 2
KMO and Bartlett’s Test.
|
KMO Measure of Sampling Adequacy |
.893 |
|
|
Bartlett’s Test of Sphericity
|
Approx. Chi-Square |
3462.215 |
|
df |
435 |
|
|
Sig. |
.000 |
|
Factors loadings were examined by category: People, Place, Price, Facility, and Product. The factors loading, as illustrated in table 3, indicate the extent to which these categories affect the entities under consideration. For People, factor E3 stood out with the highest factor loading, registering at 0.777, signifying a significant impact. Additionally, other entities (E4, E5, E2, and E1) also displayed noteworthy factor loadings. For Place, factor C3 exhibited the most substantial influence, boasting a factor loading of 0.764. Furthermore, other entities (C4, C2, C6, C1, and C5) presented varying levels of significance in relation to place-related factors. For Price, factor B2 displayed the highest factor loading at 0.715, highlighting a robust association with price-related variables. Similarly, other entities (B1, B4, and B5) also exhibited considerable factor loadings. In the context of Facility, factor D2 recorded the highest factor loading at 0.718, indicating a significant influence of facility-related factors. Notably, other entities (D3, D4, and D1) also demonstrated noteworthy factor loadings. For Product, factor A2 displayed a notable factor loading of 0.647, signifying a considerable impact of product-related variables. Additionally, factor A4 also showed a substantial influence with a factor loading of 0.585.
Table 3
Factor loading.
|
|
People |
Place |
Price |
Facility |
Product |
||||||
|
Take excellent care of your consumers (E3) |
0.777 |
|
|
|
|
||||||
|
Be willing to serve (E4) |
0.765 |
|
|
|
|
||||||
|
Sufficient service staff (E5) |
0.741 |
|
|
|
|
||||||
|
Be courteous (E2) |
0.654 |
|
|
|
|
||||||
|
The entrepreneur provided accurate facts (E1) |
0.589 |
|
|
|
|
||||||
|
There are multiple entry and exit options available (C3) |
|
0.764 |
|
|
|
||||||
|
Neat and tidy (C4) |
|
0.607 |
|
|
|
||||||
|
Interior environment (C2) |
|
0.578 |
|
|
|
||||||
|
Shop idfactor (C6) |
|
0.551 |
|
|
|
||||||
|
Accessibility (C1) |
|
0.524 |
|
|
|
||||||
|
Sufficient stores (C5) |
|
0.523 |
|
|
|
||||||
|
Food and beverages are reasonably priced (B2) |
|
|
0.715 |
|
|
||||||
|
The prices are negotiable (B1) |
|
|
0.709 |
|
|
||||||
|
Value for money in relation to service (B4) |
|
|
0.635 |
|
|
||||||
|
When contrasted to tourism, value for money (B5) |
|
|
0.620 |
|
|
||||||
|
Sufficient toilets (D2) |
|
|
|
0.718 |
|
||||||
|
Signs clearly indicate locations of points (D3) |
|
|
|
0.715 |
|
||||||
|
Clean toilets (D4) |
|
|
|
0.661 |
|
||||||
|
Convenient public transportation (D1) |
|
|
|
0.611 |
|
||||||
|
Products are of high quality (A2) |
|
|
|
|
0.647 |
||||||
|
A wide range of products on offer (A4) |
|
|
|
|
0.585 |
||||||
Table 4’s discriminant validity compares the AVE value of each construct to the correlation between other constructs in the model. If the AVE root value of each construct is greater than the correlation value between constructions and other constructs in the model, it is regarded as having excellent discriminant validity. Table 3 reveals the results of analyzing the discriminant validity measurement model with cross-loading. The Cronbach’s alpha for all variables exceeds 0.7 (Hair et al., 2014), indicating a high level of confidence and reliability. The CR validity test was used to support the measuring tool’s total reliability (Cassoni et al., 2017). Each variable has a definition of 0.7, indicating that the variables are consistent, and the resultant values vary from 0.936 to 0.969, with price having the lowest CR (Noor et al., 2015). The convergent validity requirement of the variables is fulfilled if the AVE values are greater than 0.5 (Hair et al., 2014; Manzar et al., 2019). If the AVE values are less than 0.5, the CR surpasses the 0.6 threshold (Abebe & Assemie, 2023). The place variable has an AVE of 0.530 and a CR of 0.968, both of which are acceptable. Furthermore, all variables have a higher CR value than AVE, satisfying the discriminant validity test conditions (Noor et al., 2015). These findings illustrate the measuring tool’s dependability and validity. The measurement of discriminant validity between latent variables was determined through the utilization of the HTMT. It is imperative that this value remain below 1, as a value above 1 indicates an inaccurate result (Henseler et al., 2015).
Table 4
CR, AVE, Cronbach’s Alpha and HTMT.
|
Variable |
α |
CR |
AVE |
|||||
|
HTMT |
Place |
Price |
Facility |
Product |
||||
|
People |
||||||||
|
People |
0.834 |
0.969 |
0.638 |
1 |
1 |
|||
|
Place |
0.770 |
0.968 |
0.530 |
0.645 |
0.697 |
1 |
||
|
Price |
0.732 |
0.936 |
0.606 |
0.419 |
0.606 |
0.316 |
1 |
|
|
Facility |
0.824 |
0.937 |
0.702 |
0.610 |
0.537 |
0.637 |
0.159 |
1 |
The findings demonstrate that the product variable has an AVE value less than 0.5, whereas the other variables have values above 0.5. Furthermore, Cronbach’s alpha value is less than 0.7. Despite this, CR meets the necessary standards. As a result, these indicators may not be reliable in accurately measuring the latent variables.
CONFIRMATORY FACTOR ANALYSIS
After conducting EFA, CFA was used to confirm the measurement model (Hair et al., 2017). The following fit indices were before the model was fitted: GFI = 0.89; CFI = 0.93; normed fit index (NFI) = 0.87; TLI = 0.92; SRMR = 0.035; RMSEA = 0.052; a Hoelter index at a significance level of 0.05 = 188; and a relative Chi-square of (χ2/df) = 0.000. The initial CFA results showed that the measurement model did not fit the data. The factors that affect the purchase of goods at the Ton Tann Green Market in Khon Kaen Province have 25 variables and five components, namely people, place, price, facilities, and product.
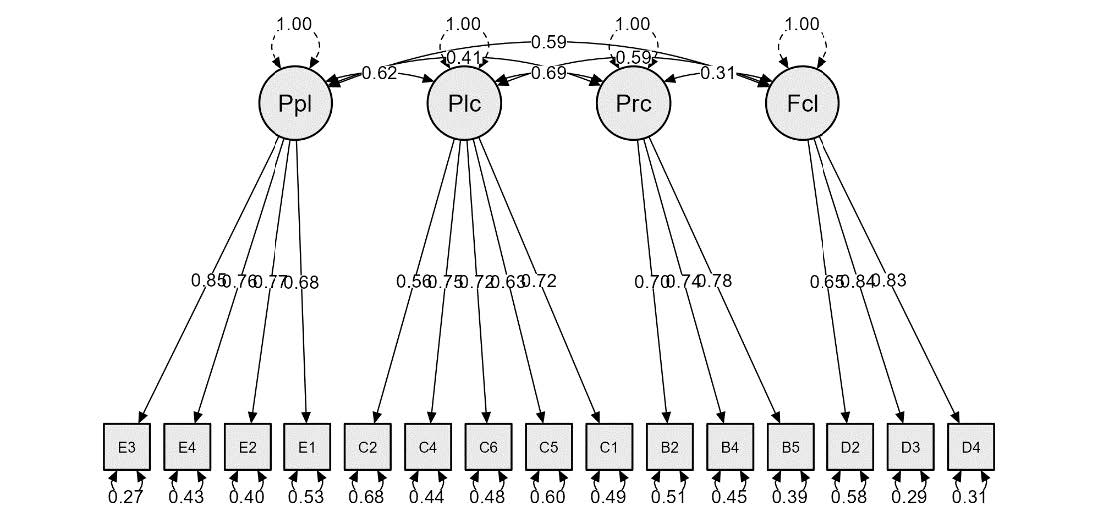
In order to assess the discriminant and convergent validity of the constructs identified through EFA, CFA was performed using the maximum likelihood method. Furthermore, the validity of the constructs was evaluated through fit indices in CFA, allowing all constructs to freely correlate. The CFA analysis resulted in a final measurement model consisting of 17 indicators and four components: people, place, price, facilities, and products, shown in table 5. The researcher decided to exclude these items from the instrument. After making this modification, the model achieved a strong fit and was approved.
Table 5
Fit indices for Confirmatory Factor Models.
|
Statistic |
p |
CFI |
TLI |
NFI |
IFI |
GFI |
SRMR |
RMSEA |
Hoelter (.05) |
|
Standard for a Good Fit |
> 0.05 |
> 0.90 |
> 0.90 |
> 0.90 |
> 0.90 |
> 0.90 |
< 0.05 |
< 0.05 |
> 200 |
|
After Modification |
0.003 |
0.983 |
0.975 |
0.954 |
0.983 |
0.998 |
0.031 |
0.042 |
273 |
After fitting the model, several fit indices were considered. The CFI was found to be 0.983, TLI was 0.975, NFI was 0.954, IFI was 0.983, GFI was 0.998, SRMR was 0.031, and RMSEA with Hoelter’s criterion was 0.042. All these indices were measured at a significance level of 0.05, which is considered significant. The model showed a harmonious relationship with the empirical data, shown in figure 1. The relative Chi-square (X2/df) was 0.003, indicating a good fit.
Figure 1
The second corroborative component analysis.
Additionally, reporting GFI and AGFI is recommended. GFI and AGFI values exceeding 0.9 indicate a strong fit, providing a clear measure of how well the model accounts for the data and its representativeness. The CFI, IFI, and TLI values approaching 1 indicate a more suitable model, while values above 0.9 demonstrate a good fit. These indices assess whether the model is better than a baseline model and explain the captured variance. The SRMR value, below 0.10, is considered acceptable and helps assess the model’s adequacy in representing the observed data and minimizing discrepancies. The RMSEA evaluates the error of approximation in the model. Values around 0.05 indicate a good fit, approximately 0.08 suggest a moderate fit, and values exceeding 0.1 indicate a poor model fit. Reporting the RMSEA helps gauge the accuracy of the model.
Table 6 shows results of data analysis to determine the model’s goodness of fit indices, with indicators for each of the four components, namely people, place, price, and facility, consisting of 15 items, weighed and determined by the coefficient of determination. The results of the analysis revealed that the factor loading values of the indicators for all four components had component weights ranging from 0.285 to 0.724, standard error values ranging from 0.036 to 0.056, and statistical significance test values for the weights. The composition values ranged from 5.301 to 17.552 and were statistically significant (p < 001).
Table 6
Component Weight (B), Standard Error (SE), Statistical Significance Value (Z) and Predictive Coefficient (R2) obtained from the second correlative component analysis of factors affecting purchasing at the Ton Tann Green Market, Khon Kaen.
|
Factor |
Index |
B |
SE |
Z |
p |
R2 |
|
People |
Take excellent care of your consumers (E3) |
0.648 |
0.037 |
17.536 |
< .001 |
0.730 |
|
(ppl) |
Be willing to serve (E4) |
0.569 |
0.039 |
14.738 |
< .001 |
0.572 |
|
Be courteous (E2) |
0.547 |
0.036 |
15.218 |
< .001 |
0.600 |
|
|
|
The entrepreneur provided accurate facts (E1) |
0.530 |
0.041 |
12.843 |
< .001 |
0.467 |
|
Place |
Interior environment (C2) |
0.390 |
0.039 |
10.001 |
< .001 |
0.319 |
|
(plc) |
Neat and tidy (C4) |
0.563 |
0.040 |
14.246 |
< .001 |
0.556 |
|
Shop idfactor (C6) |
0.561 |
0.041 |
13.574 |
< .001 |
0.519 |
|
|
Sufficient stores (C5) |
0.462 |
0.040 |
11.538 |
< .001 |
0.403 |
|
|
|
Accessibility (C1) |
0.551 |
0.041 |
13.516 |
< .001 |
0.515 |
|
Price |
Food and beverages are reasonably priced (B2) |
0.501 |
0.040 |
12.625 |
< .001 |
0.493 |
|
(prc) |
Value for money in relation to service (B4) |
0.521 |
0.039 |
13.506 |
< .001 |
0.547 |
|
When contrasted to tourism, value for money (B5) |
0.614 |
0.043 |
14.432 |
< .001 |
0.612 |
|
|
Facility |
Sufficient toilets (D2) |
0.569 |
0.048 |
11.768 |
< .001 |
0.419 |
|
(fcl) |
The signs clearly indicate locations (D3) |
0.730 |
0.044 |
16.506 |
< .001 |
0.711 |
|
|
Clean toilets (D4) |
0.689 |
0.043 |
16.174 |
< .001 |
0.690 |
DISCUSSION AND ANALYSIS
The proposed CFA successfully met the acceptance criteria, demonstrating a good overall fit. These results validate the existence and credibility of satisfaction factors influencing night market shopping, thereby confirming the validity of many proposed assumptions. Specifically, these findings support the structural relationship between products, prices, place, people, and facilities, as elaborated upon below. For several organizations, tourist satisfaction is a crucial quality indicator. Achieving high levels of tourist satisfaction necessitates well-structured processes designed to meet their expectations (Taghavi & Soleimani, 2017). Tourist satisfaction is a pivotal factor in destination selection. Satisfied tourists are more likely to revisit a destination and recommend it to others.
The demographic data collected from the study carries substantial significance for night market businesses, offering valuable insights about their target tourist group. The study reveals that the majority of respondents were females aged 20 to 39, primarily single. The majority of respondents were students with a bachelor’s degree or higher educational qualification. Regarding monthly income, most reported earnings below 5,000 baht. These findings align with previous research (e.g., Khwantongyim et al., 2023; Limpremwattana, 2023), which also identified the target consumer group as females aged 20 to 39, predominantly single, holding a bachelor’s degree, and earning a monthly income below 15,000 baht. Notably, students constitute a significant portion of this demographic. Understanding the socio-demographic characteristics of night market tourists is paramount for entrepreneurs. This knowledge allows them to tailor their offerings and marketing strategies to enhance overall satisfaction. By providing a diverse array of products and services catering to the needs and preferences of different demographic groups, night markets can expand their tourist base and create a more inclusive and enjoyable experience for all tourists.
Younger tourists demonstrate a strong inclination in fashion, motivated by a desire to stay up-to-date with the latest trends and compete with their peers in acquiring the latest fashion items (Bahng et al., 2013). This behavior is rooted in their aspiration to align themselves with prevailing fashion trends. Academic studies underscore the importance of comprehending students’ fashion preferences and the joy many women derive from shopping (Perrine, 2004). Additionally, research has shown that college students are becoming more fashion-conscious, which drives demand for certain clothing (He, 2011). Recognizing the situational and contextual factors that influence consumer behavior is of paramount significance for marketing managers, equipping them to make well-informed decisions and devise tailored marketing strategies (Keller, 2020). Their research also reveals that a higher percentage of female college students find shopping enjoyable compared to their male counterparts (Arnaudovska et al., 2010).
The results of CFA strongly support the validity and reliability of the final scale used to measure tourist satisfaction. The model fit statistics indicate a favorable match between the theoretical framework and the observed data, suggesting that the proposed model accurately represents the underlying constructs. Cronbach’s alpha is a statistical measure used to evaluate how consistently a set of items on a scale are related to each other in terms of their cumulative score (Cronbach, 1951; Raykov & Marcoulides, 2011). A commonly accepted threshold for reliability is an alpha coefficient of 0.70, although higher values like 0.80 and 0.95 are preferred for ensuring the psychometric quality of scales (Boateng et al., 2018). While Cronbach’s alpha has traditionally been widely used and respected for assessing reliability, other statistics like Raykov’s rho, ordinal alpha, and Revelle’s beta are gaining recognition as they are thought by some to offer improvements over Cronbach’s alpha (Boateng et al., 2018). Convergent validity is confirmed by AVE values, surpassing the recommended threshold of 0.5 (Hamid et al., 2015). This indicates that a substantial portion of the variance in each construct is captured by its corresponding indicators, demonstrating convergent validity. Furthermore, the loading values of 0.7 or higher for each variable indicate a strong relationship between the individual items and their respective constructs, ensuring consistency and reliability in measurement. The CR was employed to assess the overall reliability of the measurement tool (Noor et al., 2015). This statistic evaluates the consistency and stability of the scale, further bolstering the reliability of the measurement model.
Entrepreneurs in the service business must understand the importance of good customer service to succeed. This starts with having staff members who are civil, friendly, and able to explain clearly (Murray et al., 2019). Companies can rely on frontline employees that deliver exceptional service, control impressions, and demonstrate caring behavior, even when faced with challenging customers (Xiao et al., 2022). Empathy is the ability to understand and share another person’s emotions. Being empathetic allows representatives to better understand their customers and provide a more satisfactory experience (Ioannidou & Vaya, 2008). Clear communication is essential for ensuring that customers understand information provided to them (Reddy & Gupta, 2020): being courteous and treating customers with respect and courtesy at all times, being polite, friendly, and professional in your interactions (Yoon et al., 2022). According to scholars, transparency is the cornerstone of trust, as is clear pricing (Hanna et al., 2019). Several studies have highlighted the crucial role of service quality in affecting the consumer experience. For instance, responsiveness and reliability were key determinants of customer satisfaction in the hospitality industry (Smith et al., 2018). Similarly, empathy in service encounters positively influences the emotional well-being of customers (Johnson & Michaels, 2019). By following these practices and understanding the value of good customer service, entrepreneurs can improve their chances of success in the service business.
Research highlights the paramount significance of various quantified factors within the retail setting. These criteria encompass the interior environment, cleanliness, shop layout, store availability, and accessibility in night markets. Melese & Belda (2021) confirm that traditional architectural elements, physical surroundings, and decorative attributes exert a significant influence on consumers’ shopping experiences. These are collectively referred to as “physical evidence” and include visible components like building architecture, decor, surroundings, landscapes, parking facilities, lighting systems, and color schemes. In the tourism industry, multiple strategies are employed to integrate physical evidence into the marketing mix (Xu et al., 2022). Within the sphere of tourism, physical evidence typically encompasses the travel experience and the overall level of comfort. As defined by Zeithaml et al. (2006), physical evidence represents the environment where services are delivered, the points of interaction between the company and the customer, and any tangible factors that enhance performance and communication.
Night markets that offer a wide variety of merchandise, maintain cleanliness, and provide an uncluttered environment are considered to deliver added value to consumers (Hjalager et al., 2016). The appeal of night markets can be influenced by factors such as their location, convenience, and adherence to international standards. Xu et al. (2018) suggest that the tourist experience (TE) constitutes a form of mental and psychological fulfillment derived from tourists’ participation in tourism activities. They argue that TE is the core essence of tourism. Tourists actively pursue distinctive and meaningful encounters that create enduring memories, engage the senses, evoke emotions, and stimulate intellectual curiosity (Song et al., 2015). For local brands situated within extensive shopping complexes, it is imperative to create a distinctive shopping experience that aligns with international benchmarks and establishes their unique identity (Feier & Milincu, 2015). The number of available stores, pricing structures, and elements that impact people’s moods are significant factors contributing to the overall attractiveness of night markets. These findings provide valuable insights for entrepreneurs and night market managers who are in the process of designing and planning their establishments, considering these essential elements of appeal. It is worth noting that all these factors are of significant importance.
Entrepreneurs should prioritize offering reasonable prices and good value for money to achieve success (Rondan-Cataluña et al., 2019). In the fashion retail industry, value for money is crucial for consumers; however, their priorities have shifted from seeking lower costs to seeking emotional rewards from their experiences (Kim et al., 2019b). Fashion retailers can increase consumer involvement and emotional bonds by involving them in consumption experiences and facilitating personal identification with the brand (Kim et al., 2019). Value for money in relation to service, aligning service quality with an appropriate price range, is crucial in the food and beverage industry, as price significantly influences consumer purchasing decisions (Rondan-Cataluña et al., 2019). Consumers’ awareness of product value also guides their purchasing decisions (Leyrini & dos Santos, 2021). Evaluating what a business offers helps consumers determine the perceived value of a product or service. Business-to-business providers should align their capacities, resources, and capabilities with consumer needs. Customer satisfaction metrics, for example, “Top 2 Box” scores and “intention-to-repurchase” loyalty scores are widely used to evaluate and predict business performance, providing insights into customer satisfaction and loyalty (Hohenberg & Taylor, 2020; Morgeson et al., 2020).
This study found that having enough toilets and displaying clear signs pointing to them is crucial for night markets to attract customers. Night markets that offer a pleasant shopping experience and serve as tourist attractions are more successful (Ooi & Sim, 2007). Tourist destinations that are easily accessible through nearby public facilities have an advantage since they allow visitors to explore the area more conveniently (Peter & Anankumar, 2016). The availability of facilities and amenities, such as furnishings, air conditioning, cleanliness, spaciousness, and security protocols, is crucial for attracting customers (Peter & Anankumar, 2016). Night markets are preferred by customers, and providing essential facilities and additional amenities can enhance their satisfaction (Lee & Pearce, 2020). Clean restrooms are a crucial facility that customers demand, and offering excellent restroom facilities can enhance the value of night markets’ offerings and improve their overall appeal (Lee & Pearce, 2020). Night market vendors can encourage impulse buying by cultivating positive attitudes and tendencies toward impulsive purchasing (Liang et al., 2021). Clear and visible signage can effectively capture attention and influence consumer behavior, leading to increased sales (Liang et al., 2021). Signage at night markets can be aesthetically pleasing and serve as decorative elements that enhance the market’s ambience (Leung & Lam, 2020). These signs can also act as landmarks, contributing to a unique and memorable experience for tourists (Leung & Lam, 2020).
CONCLUSION
This study emphasizes the crucial role of night markets in the shopping tourism business. The ability of a night market to satisfy the varying expectations and appearances of numerous market categories, particularly the younger generation of tourists, is critical to its success. To promote customer loyalty and encourage revisits, businesses must recognize the value of offering great customer service and provide themselves with the knowledge required to satisfy the expectations of tourists. Retailers and night markets should prioritize service-oriented employees to ensure they provide a high level of client attention and great service. Furthermore, these establishments should place a high priority on hygiene and maintaining their particular brand identity. Pricing strategies should strive to provide exceptional value for money while also ensuring that tourists perceive the provision of high-quality products or services. The provision of immaculate and well-maintained toilet facilities, as well as clearly indicated amenities, is critical for preserving industrial competitiveness.
Implementing a pricing strategy can draw in consumers. Retailers can use bundle deals, limited-time offers, competitive pricing, seasonal discounts, value-added products, and value-added services to attract customers. Bundle deals involve offering discounts or bundle packages on multiple items, such as buy-one-get-one-free or mix-and-match promotions, to encourage tourists to purchase more products while saving money. Limited-time offers involve creating urgency by offering limited-time deals that expire within a few hours or days. Competitive pricing involves pricing merchandise competitively with neighboring vendors; seasonal discounts involve special discounts during off-seasons; and value-added services involve providing value-added services like free gift wrapping and home delivery options.
In conclusion, night market managers can implement several strategies to improve restroom facilities and reduce wait times during peak hours. These include regular cleaning of often-touched surfaces, installing proper signage to guide tourists to restrooms, ensuring adequate staffing for cleanliness and supplies, increasing spacing between bathroom stalls for privacy, and analyzing foot traffic patterns to identify areas of high congestion. Additionally, clear messaging, consistent branding, strategic placement of signs, digital displays at entrances, and customized navigation maps can enhance the TE and promote brand identity.
A potential area of future study could concentrate on the indicators of influences on shopping at Ton Tann Green Market, which could be applicable to marketing studies or consumer behavior at other sites. Others include:
- Future research to evaluate the influence of sample corrections through the re-examination of previous studies that were based on accidental samples. This will allow for a more comprehensive understanding of the data and ensure greater accuracy in future research.
- The research method could be replicated or modified.
- Future studies might target night market employees or store owners.
- The study could be replicated in other regions of Thailand.
- A longitudinal study should be conducted in the future to examine more closely the long-term effects of the variable, given that this study was cross-sectional.
The research for this article was limited to a single-night market in Khon Kaen, Thailand, which may limit the generalizability of the findings to other settings. Future research should consider expanding the study to include other types of night markets, such as 24-hour markets in major cities like Bangkok or those in northeastern provinces. Additionally, incorporating international research can provide a more comprehensive understanding of the factors that influence tourist satisfaction in night markets and inform the development of targeted strategies to enhance visitor experiences. Integrating international research can also provide valuable insights into the diversity of night market experiences around the world and lead to more accurate and robust findings. By conducting further investigations that cover a wider range of night markets and incorporate international perspectives, researchers can contribute to a deeper understanding of the factors that impact tourist satisfaction in night markets and ultimately improve the overall experience for visitors, which will have positive implications for local economies and the broader tourism industry.
REFERENCES
Abebe, A., & Assemie, A. (2023). Quality of work life and organizational commitment of the academic staff in Ethiopian universities. Heliyon, 9(4), e15139. https://doi.org/10.1016/j.heliyon.2023.e15139
Ahmad, A., Weng, P. K., Azizc, K. A., Din, N. A. N., Hasbullah, N. A. (2019). The Dynamism of the Night Market Environment at Bandar Baru Kuala Selangor. International Journal of Innovation, Creativity and Change, 6(4), 169-187. https://www.ijicc.net/images/Vol6Iss4/6410_Ahmad_2019_TD_R.pdf
Al-Salamin, H., Al-Baqshi, J., Al Rasasi, M., & Al Salem, H. (2015). Behavioral measurement of young generations towards brand products in Saudi Arabia: Al-hassa case study. Journal of Marketing and Consumer Research, 18, 60–66.
Arnaudovska, E., Bankston, K., Simurkova, J. & Budden, M. (2010). University Student Shopping Patterns: Internet vs. Brick And Mortar. Journal of Applied Business Research (JABR). 26. https://doi.org/10.19030/jabr.v26i1.274.
Bahng, Y., Kincade, D. H., & Yang, J. (2013). College students’ apparel shopping orientation and brand/product preferences. Journal of Fashion Marketing and Management, 17(3), 367-384. https://doi.org/10.1108/JFMM-07-2012-0036
Bamrongpol, D., Sornsaruht, P., & Deebhijarn, S. (2020). Antecedents to Thai night market tourist revisit intention. Asia-Pacific Social Science Review, 20(3), 182–191.
Blanca, M. J., Arnau, J., López-Montiel, D., Bono, R., & Bendayan, R. (2013). Skewness and Kurtosis in Real Data Samples. Methodology, 9(2), 78–84. https://doi.org/10.1027/1614-2241/a000057
Boateng, G. O., Neilands, T. B., Frongillo, E. A., Melgar-Quiñonez, H. R., & Young, S. L. (2018). Best practices for developing and validating scales for health, social, and behavioral research: A primer. Frontiers in Public Health, 6, 149. https://doi.org/10.3389/fpubh.2018.00149
Bozick, R. (2009). Job opportunities, economic resources, and the postsecondary destinations of American youth. Demography, 6(3), 493-512. https://doi.org/10.1353/dem.0.0065
Byrne, B. M. (2001). Structural equation modeling with AMOS: Basic concepts, applications, and programming. Erlbaum.
Cassoni, C., Marturano, E. M., Coimbra, S., & Fontaine, A. M. (2017). A validation study of the Multidimensional Life Satisfaction Scale for Children. Psicologia: Reflexão e Crítica, 30(1), 14. https://doi.org/10.1186/s41155-017-0068-6
Chang, C. (2017). The impact of entertainment and performances on tourist satisfaction in night markets. International Journal of Tourism Research, 19(3), 297-306.
Chang, J., & Hsieh, A-T. (2006). Leisure motives of eating out in night markets. Journal of Business Research, 59(12), 1276-1278. https://doi.org/10.1016/j.jbusres. 2006.10.002
Chen, A., Lu, Y., & Wang, B. (2017). Customers’ purchase decision-making process in social commerce: A social learning perspective. International Journal of Information Management, 37(6), 627-638. https://doi.org/10.1016/j.ijinfomgt.2017.05.001
Chen, Y. (2018). An examination of the relationship between shopping experience and tourist satisfaction in night markets. Journal of Tourism and Leisure Studies, 10(2), 157-170.
Cheung, G. W., Cooper-Thomas, H. D., Lau, R. S., & Wang, L. C. (2023). Reporting reliability, convergent and discriminant validity with structural equation modeling: A review and best-practice recommendations. Asia Pacific Journal of Management. https://doi.org/10.1007/s10490-023-09871-y
Chomvilailuk, R., & Butcher, K. (2010). Tourist perceptions of night markets: The case of the Ton Tann Green Market, Khon Kaen, Thailand. Journal of Vacation Marketing, 16(2), 119-132. https://doi.org/10.1177/1356766709352475
Connell, J. (2017). ‘Timeless Charm’? Tourism and development in Southeast Asia. In A. McGregor, L. Law, & F. Miller (Eds.), Routledge Handbook of Southeast Asian Development (pp. 153-168). Routledge.
Cronbach, L. J. (1951). Coefficient alpha and the internal structure of tests. Psychometrika, 16, 297–334. https://doi.org/10.1007/BF02310555
Diegmann, P., Basten, D., & Pankratz, O. (2015). Influence of Communication on Client Satisfaction in Information System Projects – A Quantitative Field Study. International Research Workshop on IT Project Management, 7, 46-61.
Feier, I., & Milincu, C. O. (2015). Redefining Id factor in Shopping Environments–3rd Year Interior Design Studio. Procedia-Social and Behavioral Sciences, 197, 1803-1810. https://doi.org/10.1016/j.sbspro.2015.07.239
Finch, W. H. (2020). Using fit statistic differences to determine the optimal number of factors to retain in an exploratory factor analysis. Educational and Psychological Measurement, 80(2), 217-241. https://doi.org/10.1177/0013164419865769
Hair, J.F., Black, W.C., Babin, B.J. & Anderson, R.E. (2010). Multivariate Data Analysis. 7th ed., Pearson, New York.
Hair, J. F., Black, W. C., Babin, B. J., & Anderson, R. E. (2014). Multivariate data analysis. Pearson Education.
Hair, J. F., Matthews, L. M., Matthews, R. L., & Sarstedt, M. (2017). PLS-SEM or CB-SEM: Updated guidelines on which method to use. International Journal of Multivariate Data Analysis, 1(2), 107–123. https://doi.org/10.1504/IJMDA.2017. 087624
Hamid, S., Waycott, J., Kurnia, S., & Chang, S. (2015). Understanding students’ perceptions on the benefits of online social networking use for teaching and learning. The Internet and Higher Education, 26, 1-6. https://doi.org/10.1016/j.iheduc.2015.02.004
Hanna, R. C., Lemon, K. N., & Smith, G. E. (2019). Is transparency a good thing? How online price transparency and variability can benefit firms and influence consumer decision making. Business Horizons, 62(2), 227–236. https://doi.org/10.1016/j.bushor.2018.11.006
He, Y. (2011). College students’ apparel shopping orientation changes in relations to life events [Unpublished master’s thesis]. Louisiana State University. https://repository.lsu.edu/gradschool_theses/1221/
Henseler, J., Ringle, C. M., & Sarstedt, M. (2015). A new criterion for assessing discriminant validity in variance-based structural equation modeling. Journal of the Academy of Marketing Science, 43(1), 115–135. https://doi.org/10.1007/s11747-014-0403-8
Hjalager, A.-M., Tervo-Kankare, K., & Tuohino, A. (2016). Tourism value chains revisited and applied to rural well-being tourism. Tourism Planning and Development, 13(4), 379–395. https://doi.org/10.1080/21568316.2015.1133449
Hohenberg, S., & Taylor, W. (2020). Measuring Customer Satisfaction and Customer Loyalty. In C. Homburg, M. Klarmann, & A. Vomberg (Eds.), Handbook of Market Research (pp. 1–30). Springer. https://doi.org/10.1007/978-3-319-05542-8_30-1
Hsieh, A-T., & Chang, J. (2006). Shopping and tourist night markets in Taiwan. Tourism Management, 27, 138-145. https://doi.org/10.1016/j.tourman.2004.06.017
Hsu, C. (2020). Night market tourism: A review of the literature. Journal of Tourism and Leisure Studies, 11(1), 19-34.
Hu, L.-I., & Bentler, P. M. (1999). Cutoff criteria for fit indexes in covariance structure analysis: Conventional criteria versus new alternatives. Structural Equation Modeling, 6, 1-55.
Huang, P-L., Lee, B., & Chen, C-C. (2017). The influence of service quality on customer satisfaction and loyalty in B2B technology service industry. Total Quality Management & Business Excellence, 30, 1-17. https://doi.org/10.1080/14783363. 2017.1372184
Huang, R., Xie, C., Lai, F., Li, X., Wu, G., & Phau, I. (2023). Analysis of the characteristics and causes of night tourism accidents in China based on SNA and QAP methods. International Journal of Environmental Research and Public Health, 20(3), 2584. https://doi.org/10.3390/ijerph20032584
Huang, Y. (2019). The effect of accessibility and location on tourist satisfaction in night markets. Tourism and Hospitality Research, 19(2), 147-158.
Hung, H.-K., & Wu, C.-C. (2020). Impact of night markets on residents’ quality of life. Social Behavior and Personality: An International Journal, 48(8), e8316.
Huong, T. T. T. (2021). Night-time economy development in Vietnam. International Journal of Advanced Engineering and Management Research, 6(3), 26-34.
In, J., Kang, H., Kim, J. H., Kim, T. K., Ahn, E. J., Lee, D. K., Lee, S., & Park, J. H. (2020). Tips for troublesome sample-size calculation. Korean Journal of Anesthesiology, 73(2), 114–120. https://doi.org/10.4097/kja.19497
Ioannidou, F., & Vaya, K. (2008). Empathy and Emotional intelligence: What is it really about. International Journal of Caring Sciences, 1(3), 118–123.
Johnson, M., & Michaels, A. (2019). The role of empathy in customer service encounters: A qualitative study. Journal of Consumer Behavior, 18(4), 356-367.
Kalnaovakul, K., & Promsivapallop, P. (2021). Dimensions of night market visit experience of international tourists: An analysis of google reviews of night markets in Phuket. Thailand Asia-Pacific Social Science Review, 21(3), September 2021, 57-73.
Kang, H. (2021). Sample size determination and power analysis using the G*Power software. Journal of Educational Evaluation for Health Professions, 18(17). https://doi.org/10.3352/jeehp.2021.18.17
Keller, K.L. (2020). Consumer Research Insights on Brands and Branding: A JCR Curation. Journal of Consumer Research. 46, 995-1001. https://doi.org/10.1093/jcr/ucz058
Khwantongyim, P., Wansee, S., Lu, X., Zhang, W., & Sun, G. (2021). Variations in the Community Structure of Fungal Microbiota Associated with Apple Fruit Shaped by Fruit Bagging-Based Practice. Journal of Fungi, 7(9), 764. https://doi.org/10.3390/jof7090764
Kim, H., Ku, B., Kim, J. Y., Park, Y.-J., & Park, Y.-B. (2016a). Confirmatory and Exploratory Factor Analysis for Validating the Phlegm Pattern Questionnaire for Healthy Subjects. Evidence-Based Complementary and Alternative Medicine, 2016, e2696019. https://doi.org/10.1155/2016/2696019
Kim, K. T., Bae, J., Kim, J-C., & Lee, S. (2016b). The Servicescape in the Fitness Center: Measuring Fitness Center’s Services. International Journal of Sport Management, Recreation & Tourism, 21, 1-20.
Kim, J., Cui, Y., Choi, C., Lee, S. J., & Marshall, R. (2020). The influence of preciseness of price information on the travel option choice. Tourism Management, 79, 104012. https://doi.org/10.1016/j.tourman.2019.104012
Kuo, C.-T., Chung, M.-L., & Kuo, F.-C. (2012). To Explore Taiwanese Night Markets Culture and Tourism Experience and Behaviour. Procedia - Social and Behavioral Sciences, 40, 435–440. https://doi.org/10.1016/j.sbspro.2012.03.212
Kyriazos, T. A. (2018). Applied psychometrics: Sample size and sample power considerations in factor analysis (EFA, CFA) and SEM in General. Psychology, 9(8), 2207-2230. https://doi.org/10.4236/psych.2018.98126
Liao, S.-H., & Hsiao, P.-Y. (2017). The Study of Snack Purchasing Behavior and Foreign Tourists’ Eating Habits at Taiwanese Night Markets. In T. Taufik, I. Prabasari, I. A. Rineksane, R. Yaya, R. Widowati, S. A. Putra Rosyidi, S. Riyadi, & P. Harsanto (Eds.), ICoSI 2014 (pp. 263–270). Springer. https://doi.org/10.1007/978-981-287-661-4_27
Limpremwattana, V. (2023). Factor Analysis Model of Fashion-Shopping Behavior of Teenagers in Bangkok. Rajabhat Rambhai Barni Research Journal. 17 (2), May – August, 1-14.
Lee, D., & Pearce, P. (2020). Shining a light on Asian night markets: vendors’ and tourists’ views. International Journal of Tourism Cities, 6(2), 467-484. https://doi 10.1108/IJTC-02-2019-0027
Lee, S. H. N., & Chow, P.-S. (2020). Investigating consumer attitudes and intentions toward online fashion renting retailing. Journal of Retailing and Consumer Services, 52, 101892.
Leung, H. Y., & Lam, S. T. (2020). The Urban Night Market: A Global Perspective. Routledge.
Leyrini, G. R. D., & dos Santos, M. J. (2021). The Influence of Price on Purchase Intentions: Comparative Study Between Cognitive, Sensory, and Neurophysiological Experiments. Behavioral Sciences, 11(2), 16. https://doi.org/10.3390/bs11020016
Li, R., Wang, X., & Wang, Y. (2021). Night Market Cultural Transformation and Upgrading. Journal of Service Science and Management, 14, 412-428. https://doi.org/10.4236/jssm.2021.144026
Liang, C.-C., Yu, A. P.-I., & Le, T. H. (2021). Customers focus and impulse buying at night markets. Journal of Retailing and Consumer Services, 60, 102434. https://doi.org/10.1016/j.jretconser.2020.102434
Liu, J., Chen, Y., Chao, S., Cao, H., Zhang, A., & Yang, Y. (2018). Emission control priority of PM2.5- bound heavy metals in different seasons: A comprehensive analysis from health risk perspective. Science of the Total Environment, 644, 20–30. https://doi.org/10.1016/j.scitotenv.2018.06.226
Liu, C., Chou, S.-F., & Lin, J.-Y. (2021). Implementation and evaluation of tourism industry: evidentiary case study of night market development in Taiwan. Evaluation and Program Planning, 89, 101961. https://doi.org/10.1016/j.evalprogplan.2021.101961
Liu, Y. (2016). The impact of cleanliness and safety on tourist satisfaction in night markets. Tourism and Hospitality Research, 16(3), 277-287.
Liu, Y. (2018). Social interaction and tourist satisfaction in night markets. International Journal of Tourism Research, 20(2), 197-206.
Lo, Y.-C., & Janta, P. (2020). Resident’s Perspective on Developing Community-Based Tourism – A Qualitative Study of Muen Ngoen Kong Community, Chiang Mai, Thailand. Frontiers in Psychology, 11. https://www.frontiersin.org/articles/10.3389/fpsyg.2020.01493
Manzar, M. D., Salahuddin, M., Alamri, M., Albougami, A., Khan, M. Y. A., Nureye, D., Spence, D. W., & Pandi-Perumal, S. R. (2019). Psychometric properties of the Epworth sleepiness scale in Ethiopian university students. Health and Quality of Life Outcomes, 17(1), 30. https://doi.org/10.1186/s12955-019-1098-9
Maskey, R., Fei, J., & Nguyen, H-O. (2018). Use of exploratory factor analysis in maritime research. Asian Journal of Shipping and Logistics, 34(2), 91-111. https://doi.org/10.1016/j.ajsl.2018.06.006
Mat Som, A. P., Som, M., Aref, B., & Ibrahim, H. M. (2018). Shopping Motivation Factors at Tourist Night Markets. Journal of Tourism, 11(1), 1-10.
Melese, K. B., & Belda, T. H. (2021). Determinants of tourism product development in southeast Ethiopia: Marketing perspectives. Sustainability, 13(23), 13263. https://doi.org/10.3390/su132313263
Morgeson, F. V., Hult, G. T. M., Mithas, S., Keiningham, T., & Fornell, C. (2020). Turning Complaining Customers into Loyal Customers: Moderators of the Complaint Handling–Customer Loyalty Relationship. Journal of Marketing, 84(5), 79–99. https://doi.org/10.1177/0022242920929029
Murray, J., Elms, J., & Curran, M. (2019). Examining Empathy and Responsiveness in a High-service Context. International Journal of Retail & Distribution Management, 47(12), 1364-1378. https://doi.org/10.1108/IJRDM-01-2019-0016
Nguyen, T. P. L., & Peña-García, A. (2019). Users’ Awareness, Attitudes, and Perceptions of Health Risks Associated with Excessive Lighting in Night Markets: Policy Implications for Sustainable Development. Sustainability, 11(21), Article 21. https://doi.org/10.3390/su11216091
Noor, N. M., Aziz, A. A., Mostapa, M. R., & Awang, Z. (2015). Validation of the Malay version of the Inventory of Functional Status after Childbirth questionnaire. BioMed Research International, 2015, 972728. https://doi.org/10.1155/2015/972728
Ooi, J. T. L., & Sim, L.-L. (2007). The magnetism of suburban shopping centers: Do size and cineplex matter. Journal of Property Investment and Finance, 25(2), 111-135. https://doi.org/10.1108/14635780710733816
Pa Lan La. (2020, December 14). Ton Tann Market, Khon Kaen, Thailand. https://palanla.com/th/domesticLocation/detail/1515
Pehlivan, D., Aras, S., Glaze, D.G. Muharrem, A.k., Bernhard, S., & Kathleen, J. M. (2024). Development and validation of parent-reported gastrointestinal health scale in MECP2 duplication syndrome. Orphanet J Rare Dis 19, 52. https://doi.org/10.1186/s13023-024-03022-2
Perrine, W.C. (2004). A Comparison of the Shopping Preferences of College Age Apparel Shoppers in Turkey and the United States. Master's Theses. 3987 Western Michigan University
Peter, S., & Anandkumar, V. (2016). Deconstructing the shopping experience of tourists to the Dubai Shopping Festival. Cogent Business \& Management, 3(1), 1199109. https://doi.org/10.1080/23311975.2016.1199109
Raykov, T., & Marcoulides, G.A. (2011). Introduction to Psychometric Theory. Routledge.
Reddy, B. V., & Gupta, A. (2020). Importance of effective communication during COVID-19 infodemic. Journal of Family Medicine and Primary Care, 9(8), 3793-3796.
Rondan-Cataluña, F. J., Escobar-Perez, B., & Moreno-Prada, M. A. (2019). Setting Acceptable Prices: A Key for Success in Retailing. Spanish Journal of Marketing–ESIC, 23(1), 119-139. https://doi.org/10.1108/SJME-03-2018-0013
Rovinelli, R. J., & Hambleton, R. K. (1977). On the use of content specialists in the assessment of criterion-referenced test item validity. Dutch Journal of Educational Research, 2, 49-60.
Seočanac, M. & Dimitrovski, D. (2022). Factors influencing tourists’ nightlife experience in Belgrade. Consumer Behavior in Tourism and Hospitality, 17(4), 436-452. https://doi.org/10.1108/CBTH-11-2021-0279
Shemwell, J. T., Chase, C. C. & Schwartz, D. L. (2015). Seeking the general explanation: a test of inductive activities for learning and transfer. Journal of Research in Science Teaching, 52(1), 58–83. https://doi.org/10.1002/tea.21185
Shin, Y. O., Im, J., & Severt, K. (2019). Consumers’ intention to patronize food trucks: An application of the theory of planned behavior. Journal of Foodservice Business Research, 22(6), 582-599. https://doi.org/10.1080/15378020.2019.1671120
Smith, J., Johnson, A., & Davis, R. (2018). The impact of service quality dimensions on customer satisfaction: An empirical analysis in the hospitality industry. Journal of Hospitality and Tourism Management, 35, 1-8.
Sofronov, B. (2017). Impact of Sustainable Tourism in The Travel Industry. Annals of Spiru Haret University Economic Series, 17(4), 85. https://doi.org/10.26458/1747.
Sohail, T., Gayen, B., & Hogg, A. M. (2018). Convection enhances mixing in the Southern Ocean. Geophysical Research Letters, 45, 1–10. https://doi.org/10.1029/2018GL077711
Song, H. J., Ahn, Y. J. & Lee, C. K. (2015). Examining relationships among expo experiences, service quality, satisfaction, and the effect of the expo: The case of the expo 2012 Yeosu Korea. Asia Pacific Journal of Tourism Research, 20(11), 1266-1285.
Taber, K. S. (2018). The Use of Cronbach’s Alpha when Developing and Reporting Research Instruments in Science Education. Research in Science Education, 48, 1273–1296. https://doi.org/10.1007/s11165-016-9602-2
Taghavi, M., & Soleimani, A.G. (2017). The factors influencing the growth of the tourism industry. Econ Res. 3, 157. 8
Wang, Y. (2019). Atmosphere and ambiance in night markets: A factor analysis. International Journal of Tourism Research, 21(2), 227-237.
Xiao, B., Liang, C., Liu, Y., & Zheng, X. (2022). Service Staff Encounters with Dysfunctional Customer Behavior: Does Supervisor Support Mitigate Negative Emotions? Frontiers in Psychology, 13, 987428. https://doi.org/10.3389/fpsyg.2022.987428
Xu, S., Kim, H. J., Liang, M., & Ryu, K. (2018). Interrelationships between tourist involvement, tourist experience, and environmentally responsible behavior: a case study of Nansha Wetland Park, China. Journal of Travel & Tourism Marketing, 35(7), 856-868. https://doi.org/10.1080/10548408.2018.1439429
Xu, S., Zhou, X., & Ahmad, Z. (2022). Measuring the Psychological Behavior of Tourism Service Providers in Low-Income Regions: Implementing Effective Service Marketing and Performances Strategies. Sustainability, 14(18), Article 18. https://doi.org/10.3390/su141811459
Yoon, D. J., Muir, C. P., Yoon, M. H., & Kim, E. (2022). Customer courtesy and service performance: The roles of self-efficacy and social context. Journal of Organizational Behavior, 43(6), 1015–1037. https://doi.org/10.1002/job.2625
Zeithaml, V. A., Bitner, M. J., & Gremler, D. D. (2006). Services marketing: Integrating customer focus across the firm. McGraw-Hill.
Zhang, J. (2018). The effect of pricing on tourist satisfaction in night markets. Tourism and Hospitality Research, 18(1), 73-84.
Zhang, Z., Li, H., & Cao, Y. (2022). Research on the Coordinated Development of Economic Development and Ecological Environment of Nine Provinces (Regions) in the Yellow River Basin. Sustainability, 14(20), Article 20. https://doi.org/10.3390/su142013102
Zhou, H., Yao, X., Liu, Z., & Yang, Q. (2021). Impact of Pricing and Product Information on Consumer Buying Behavior with Customer Satisfaction in a Mediating Role. Frontiers in Psychology, 12, 720151. https://doi.org/10.3389/fpsyg.2021.720151