ABSTRACT
Although the Information Technology (IT) sector accounts for the highest contribution to Gross Development Product in India, it has high employee turnover. This turnover is a waste of investment and detracts from organizations’ knowledge and experience pools. Person organization (PO) fit theories posit that when people are hired by and for organizations (not just individual jobs), they are less likely to quit. This study examines the benefits provided by IT firms to retain their employees and how these benefits’ effectiveness vary by designation and firm. It does so by employing the ‘work environment congruence’ approach to PO fit. Moreover, it proposes how to build a strategic model of the mix of benefits for retaining staff at different position levels (designations) in the firm. Findings show that preferred benefits differ by designation. For all factors except location, organization does not play an important role in retention, but designation impacts it in all the factors.
Keywords: Retention strategies, Retaining employees, Information technology, Indian IT industry.
INTRODUCTION
The Information Technology (IT) sector is important to India’s economic and social development and provides the highest relative market share of the nation’s Gross Development Product. However, employee turnover has emerged as a major challenge to the IT sector. The rate of attrition increases with the skill levels of employees (Cho & Lewis, 2012) and is also impacted by experience, with the highest level of turnover occurring in the first four years of employment (Elkjaer & Filmer, 2015; Malhotra, 2004; Yiu & Saner, 2008). One prominent reason for staff turnover in the IT sector is demand for higher pay packages (Ganco et.al., 2015). Turnover has many repercussions for firms, such as waste of financial investments (Perez, 2008) and a reduction in the combined knowledge and experience of a firm’s workforce (Hancock et al., 2013).
Firms need to retain their human resources as these are their highest source of competitive advantage in what is known as the resource-based view (RBV) (Holland et al., 2007; Ostroff & Bowen, 2016). Employers aim to be the “employer of choice” (Bellou et al., 2015) and strategically attract, retain, and motivate its employees. However, retention varies significantly among industries and organizations due to different cultures, policies and procedures, and management (Sheridan, 1992). Research suggests that Person Organization (PO) fit can play a significant role in retaining employees in high turnover jobs (McCulloch & Turban, 2007) by enhancing the environmental and value congruence of employees with the firm (Amos & Weathington, 2008; Steers & Mowday, 1981). When people are hired into an organization and not just for ‘jobs,’ their satisfaction with organizational factors (salary and career advancement) increases, and they display significantly better work attitudes, lower turnover intention, and higher work performance (Elkjaer & Filmer, 2015; Kristof, 1996).
Given all of this, this study aims to examine how to retain employees in IT firms by employing the ‘work environment congruence’ and ‘value congruence’ approaches to PO fit in two Indian technology firms: Tata IT Consultancy Services (TCS) and Infosys (Arthur, 2001). It aims to identify the organizational factors that aid in enhancing this approach to PO fit, leading to employee retention. The study also shows how the preferences for the retention mix of benefits varies by designation in IT firms, with the term designation in this article referring to the kind of work that an employee conducts in their job position at a firm. Organizations can build a retention policy based on this bundle of benefits to attract and retain individuals (Morrow & Wirth, 1989). This research primarily focuses on the first three designations of software engineers working in India’s leading tier 1 IT firms.
LITERATURE REVIEW
India is the most sought-after destination for firms outsourcing their IT services (Presbitero et al., 2016) and the IT industry needs a shift in focus from recruitment to retention (Kumar & Arora, 2012). Many studies acknowledge that Human Resource Management (HRM) practices that fit the value systems of employees, like competitive remuneration, training and development, opportunities for career development, financial participation like profit sharing (Richter & Schrader, 2016), employee ownership plans (Carberry, 2012), and work-life balance policies, increase employees’ PO fit, thereby increasing the firm’s retention rate, and enhancing employer branding (Cascio, 2014). Thite (2010) explains that organizational factors are behind the turnover in the Indian IT sector, and PO fit assessment is vital for employee retention. The strategies to enhance PO fit and thereby increase staff retention used by firms include offering voice mechanisms (Spencer, 1986), adopting ‘commitment’ HRM policies (Arthur, 1994), like meaningful work, fair hiring, training, performance appraisal (Cho & Lewis, 2012) and providing intrinsic motivation through career advancement and relationship building (Bertelli, 2007; Kim, 2005; Astakhova,2016; Garg & Rastogi,2006; Moynihan & Landuyt, 2008). The majority of research on this topic propounds that PO fit is an important predictor of employee retention, however, to the best of our knowledge, no work has explored how PO fit can be used to develop a retention mix of benefits differing by designation in IT organizations. This research gap is what this article seeks to address: how differences in employee designations in the IT sector affect their PO fit and their preferred mix of offered retention benefits (Backhaus, 2016; Pasewark & Viator, 2006).
THEORETICAL FRAMEWORK & HYPOTHESIS DEVELOPMENT
The concept of PO is derived from Person-Environment fit (Shin, 2004) and based on the theory of work adjustment (Bretz & Judge, 1994). This theory posits that individuals who fit well within organizations have positive work-related outcomes (Spurk et al., 2019; Menezes, 2015), such as intent to remain with their firm (Ostroff & Bowen, 2016) which can be explained by the ‘work environment congruence’ and ‘value congruence’ approaches (Westerman & Cyr, 2004) of PO fit. Additionally, PO fit is an important predictor of job satisfaction and organizational commitment (Van Vianen et al., 2007; Grima et al., 2021), and higher physical and mental wellbeing (Carless, 2005), contributing to reduced staff turnover. PO fit has been extensively used to recruit for high-turnover jobs (McCulloch & Turban, 2007; Williams & Dreher, 1992). Weathington & Tetrick (2000) posit that organizational factors affect the PO fit of the employees, thereby affecting their intent to stay, and therefore the firm’s employee retention (Black & Lynch, 1996). In this study, we carry out an investigation of the perception of organizational factors using two-way ANOVA analysis to understand its variation in different designations and organizations. Figure 1 depicts the research framework
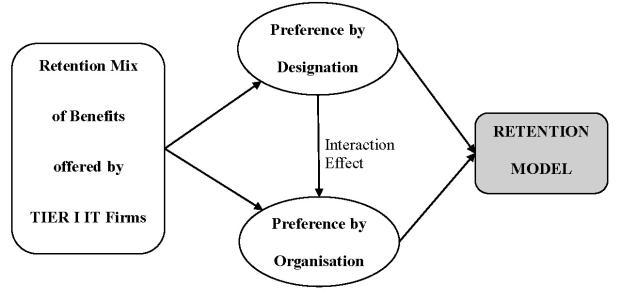
Figure 1. The research framework.
The organizational factors (mix of benefits) offered to employees currently employed by tier 1 Indian IT firms were identified through an extensive literature review, interviews with employees working in the IT firms and brainstorming with subject experts, displayed in table 1. A total of six categories were created by academic experts performing semantic analysis independently (Poba-Nzaou et al., 2016; Vorhauser-Smith, 2012) and then comparing and labeling. Intercoder reliability was determined using the Cohen Kappa statistic.
Table 1. Categories of retention mix of benefits.
|
Benefit |
Includes |
Sources |
|
Employee benefits |
Welfare measures like fringe benefits, higher education support, recreational facilities |
Batt & Valcour, 2003; Cascio, 2014; |
|
Family-friendly practices |
Support for mental wellbeing like flexible timings, work from home option, choice of location |
|
|
Work-life balance practices |
Supervisor support, peer support, and mentoring |
|
|
Company identification |
Practices for provisioning of information like communication channels, acceptance of ideas |
|
|
Self-enlightenment |
Opportunities for career advancement, nature and type of work |
|
|
Other factors |
Remuneration, training & development, recognition and job security |
DEVELOPMENT OF HYPOTHESIS
A core premise of this article is that although organizations offer similar benefits to all their designations, a different mix should be offered to each based on the differences in their level of experience and opportunities (Nishii et al., 2008). The RBV supports this proposition, customizing retention strategies for a particular designation (Jones et al., 2009; Presbitero et al., 2016; Watson et al., 2004). Intent to remain with a firm varies by organization (Fletcher et al., 2016; Yamamoto, 2008) and designation, which defines the type of job the person conducts (Ishiyama, 2011; Yamamoto, 2013). Therefore, the intent to stay with a firm varies by designation and organization. This article tests eight hypotheses, laid out below.
Firms adopt strategic HRM practices like remuneration to retain valuable employees (Chadee & Raman, 2012; Scullion et al., 2010). Firms offer attractive remuneration packages in the specialty jobs market where there is a dearth of skilled professionals, adding incentives and perks to retain employees (Ferguson & Brohaugh, 2009). Satisfaction with remuneration is significant in managing employee’s decision to quit (Motowidlo, 1983; Hoffman & Woehr 2006). Therefore, we can hypothesize that an employee’s satisfaction with their remuneration is a retention factor that varies by designation and organization, also referred to as H1.
IT sector employees face the challenge of obsolescence of their skill set in relatively shorter periods than other industries (Presbitero et al., 2016). Training and development are essential to upgrading the skills of IT employees and have been seen to improve employee retention (Armstrong-Stassen & Ursel, 2009), specifically in job learning practices in the IT sector (Egan et al., 2004). Organizations which invest in Human Resource Development (HRD) initiatives to develop employee potential (Cascio, 2014) and provide a continuous learning environment through innovative tools improve employee retention (O’Leonard, 2013; Schmidt & Bjork; 1992). Therefore, we can hypothesize that an employee’s satisfaction with training and development opportunities is a retention factor that varies by designation and organization, also referred to as H2 (Astakhova & Porter, 2015).
‘Family friendliness’ refers to firms adopting measures to help employees with their family responsibilities (Yamamoto, 2011; Lambert & Lambert,2012). It includes work-life balance and family-friendly practices. Work-life balance practices include supervisor support (Paul & Anantharaman, 2003) through mentoring (Cascio & Aguinis, 2011) and are seen to lower withdrawal cognition by positively affecting employee attitudes (Batt & Valcour, 2003). When individuals believe that supervisors and management are protective of and generous towards their workers, they experience value congruence with the firm (Presbitero et al., 2016). Mentoring, another work-life balance practice (Lawrence, 2011), has proven to be a useful tool to retain young employees in IT industries (Long et al., 2012; Tsuda, 1993). Peer support is essential in a continuous learning environment such as the IT sector (Cascio, 2014). Therefore, we can hypothesize that the perception of work-life balance practices is a retention factor that varies by designation and organization, also referred to as H3.
To promote employees’ work-life balance, organizations indulge in ‘family-friendly practices,’ such as flexibility of place of work (Rau & Hyland, 2002), as it positively impacts employees’ job satisfaction, morale and engagement (Atkinson & Hall, 2011). Other practices involve the flexi-timings option, working part-time, long breaks for major life events, sabbatical, work from home option, etc. Such options have been seen to highly reduce attrition (TNN, 2016). Therefore, we can hypothesize that satisfaction with family-friendly practices is a retention factor that varies by designation and organization, also referred to as H4.
In the Indian IT industry, more than 80 percent of workers are continually seeking better job opportunities (Guchait & Cho, 2010; Griffin & Moorhead, 1981), as it raises their morale, self-esteem and trust in the firm. Therefore, one needs to understand the triggers of turnover to ensure the retention of employees (Presbitero et al., 2016). When a job becomes monotonous, especially in the IT industry, employee absenteeism and dissatisfaction increase (Batt et al., 2005; Roy, 2010), making retention a challenging task. Firms attempt to enlighten employees through allocating tasks that match their knowledge, skills, abilities, and interests (Samuel & Chipunza, 2009). Therefore, we can hypothesize that ‘self-enlightenment’ is a retention factor that varies by designation and organization, also referred to as H5.
Firms implement various recognition and reward measures which act as a positive reinforcement (Presbitero et al., 2016) that reduces employees’ intent to quit (Long et al., 2012). On the other hand, multiple periodic appraisals generate a sense of insecurity among employees in the Indian IT sector (Ferguson & Brohaugh, 2009) and affect the retention of employees (Van Vianen, et al., 2007). Based on this, we can hypothesize that employees’ perception of recognition by the firm and job security are retention factors that vary by designation and organization, also referred to as H6.
Fringe benefits provide instrumental value, serving as end benefits to employees (Van Vianen, et al., 2007). These include family health insurance coverage, retirement savings, employee stock ownership plans, paying dividends, and allowances (Yamamoto, 2011), besides offering sabbaticals and recreational facilities (Akhtar et al., 2015; Kossivi et al., 2016). By engendering improved job attitudes and organizational attachment, employee benefits increase employees to stay, serving as a major retention factor for firms (Fairris, 2004; Wagar & Rondeau, 2006). Based on this, we can hypothesize that employees’ satisfaction with ‘employee benefits’ is a retention factor that varies by designation and organization, also referred to as H7.
Employer branding influences employees’ choice of firms (Bellou et al., 2013) while also boosting their work attitudes through image identification (Gberevbie, 2010; Karatepe, 2013; Silbert, 2005). Additionally, influential industry leaders in any given economic environment belong to firms with positive employer brands (Cascio, 2014). Firms, therefore, enhance their image by adopting favorable HRM policies such as the provision of effective communication channels (Guchait & Cho, 2010), especially among millennials (Cascio, 2014), who value informal and continuous feedback. Additionally, open-door policies, addressing grievances (Baltes et al., 1999; Dibble, 1999), bulletins on the Intranet and blogs also build the company image (De Vos & Meganck, 2009; Heeks, 2015). Employee empowerment and autonomy are two major techniques essential for company identification and raising employees’ self-esteem (Laura, 2013; Whiting & Williams, 2013). Based on this, we can hypothesize that the employees’ perception of their ‘company identification’ is a retention factor that varies by designation and organization, also referred to as H8.
RESEARCH METHODOLOGY
This study employed a survey method based on the Person-Environment fit by Shin (2004) and the theory of work adjustment by Bretz & Judge (1994). The survey was used to gauge the preferred mix of benefits held by respondents working at the first three level designations (starting from the entry point into the engineering cadre of the firm) in tier 1 Indian IT firms. The three levels of designations are widely termed to be System Engineer/Software Engineer, Senior System Engineer/IT Analyst and Project Lead/Assistant Consultant. Answers were given on a Yes/No dichotomous scale (Creswell & Poth, 2015; McElroy, 2014). Using Google Forms and deploying non-probability purposive and snowballing sampling, 581 valid responses were received during three months of data collection from December, 2021 to March, 2022. Using a sample size calculator (Creative Research Systems, 2012; Ostroff et al., 2005) we determined that the 581 responses is above the required sample of 384 to ensure a 95 percent confidence level and five percent confidence interval. After collecting the data and inputting it into software (Statistical Package for the Social Sciences, version 23), the two-way ANOVA was applied to carry out our analysis.
Since the questionnaire was administered electronically and was not targeted to a specific location, it cannot be said with confidence that the survey covered all the locations of the two firms researched in India. The firms also have offices outside India, creating cross-cultural factors that affect retention and work outcomes. These factors were not incorporated into this study. There may have been a self-reporting bias for respondents due to employee’s reluctance to spare time and express their opinions in the survey (Roberts & Illardi, 2003; Knippenberg, 2000; Grima et al., 2020).
RESULTS
H1 was split into the three parts below to apply the two-way ANOVA.
Designation
H10: Perception of Remuneration for each designation is the same.
H11: Perception of Remuneration for each designation is different.
Organization
H10: Perception of Remuneration for each organization is the same.
H11: Perception of Remuneration for each organization is different.
Interaction
H10: Perception of Remuneration for all interactions is the same.
H11: Perception of Remuneration for all interactions is different.
Table 2. Results of two-way ANOVA for Remuneration as a retention factor.
|
Tests of Between-Subjects Effects |
|||||
|
Dependent Variable: Remuneration |
|||||
|
Source |
Type III Sum of Squares |
df |
Mean Square |
F |
Sig. |
|
Corrected Model |
74.857a |
5 |
14.971 |
9.033 |
0.000 |
|
Intercept |
3,906.717 |
1 |
3,906.717 |
2,357.128 |
0.000 |
|
Designation |
73.234 |
2 |
36.617 |
22.093 |
0.000 |
|
Organization |
0.605 |
1 |
0.605 |
0.365 |
0.546 |
|
Designation * Organization |
2.230 |
2 |
1.115 |
0.673 |
0.511 |
|
Error |
953.008 |
575 |
1.657 |
|
|
|
Total |
4,994.000 |
581 |
|
|
|
|
Corrected Total |
1,027.866 |
580 |
|
|
|
|
a. R Squared = .073 (Adjusted R Squared = .065) |
|||||
Table 3. Descriptive statistics for designation and perception of remuneration.
|
1. Designation |
||||
|
Dependent Variable: Remuneration |
||||
|
Designation |
Mean |
Std. Error |
95% Confidence Interval |
|
|
Lower Bound |
Upper Bound |
|||
|
Level 1 |
2.102 |
.094 |
1.916 |
2.288 |
|
Level 2 |
2.870 |
.092 |
2.689 |
3.052 |
|
Level 3 |
2.861 |
.093 |
2.679 |
3.043 |
Observing the significance values, all null hypotheses except for ‘designation’ can be accepted, implying that the Perception of Remuneration for each designation is not the same. When comparing the mean values of different designations, Remuneration is the most attractive as a retention factor for level 2 and level 3 engineers and the least attractive for level 1 engineers in both firms (tables 1, 2 and 3). A summary of the results for all other factors is presented below (and in tables 4 to 40 in the appendix):
• For t training, all null hypotheses except for designation are accepted. This implies that the perception of training as a retention factor differs significantly from the designation. Comparing mean scores, training is the most attractive retention factor for designation level two.
• Perception of supervision as a retention factor differs significantly from the designation, as all null hypotheses except for designation can be accepted. Comparing mean scores, supervision is most attractive as a retention factor for designation levels one and two.
• Perception of relationship with colleagues has a significant impact on retention for different designations. Here again, the null hypotheses for organization and interaction effect are accepted, while for designation, it is rejected. After comparing the mean scores across designations, we find that this is most influential at designation level two.
• Similarly, the perception of career advancement as a retention factor differs significantly among designations. Career advancement is the most attractive for designation level three as a retention factor.
• The designation seems to significantly impact the perception of engineers towards the type of work irrespective of organization. When comparing the mean scores, the most important factor is for level three engineers.
• Perception of recognition varies with the designation. It is most attractive for level one workers and highly attractive for level three workers.
• Job security perception varies by designation, and mean scores suggest that it is most attractive for level one engineers.
• Fringe benefits are significant for different designations, thereby rejecting the null hypothesis for designation. It is most attractive for level one engineers.
• The importance of location as a retention factor varies with both the designation and the organization individually, but the particular combination of the two does not impact its importance to workers. Comparing the mean scores for different designations, it can be seen that location matters the most to level one engineers. At the same time, location is most attractive for engineers working at Infosys.
• Perception of higher education support varies significantly with the designation. It is the most attractive aspect for level one engineers.
• Flexible timings are significant for different designations and are more enticing for level two engineers.
• Perceptions of the ‘work from home option’ vary with the designation, and mean scores suggest that level three engineers are most attracted to it.
• Designations impact the perception of engineers towards mentoring, and it is the most attractive aspect for level three engineers.
• Designation plays a significant role in impacting the engineers’ perceptions of communication platforms. It is the most important factor for level one and level two engineers.
• Since the significance level for organization and interaction effect is greater than 0.05, the null hypothesis is accepted, but rejected for the designation. Comparing the mean scores, acceptance of ideas is an important factor for retention for level three engineers.
• Designation does impact the perception of extra-curricular activities. The mean score values suggest that level one engineers in IT firms find this factor the most attractive.
• The designation of an engineer impacts their perception of company size, image, and retention. Comparing mean scores, this factor is most important for level three engineers, followed by level one engineers.
Summarizing the above results, in all the retention factors except location, organization does not play an important role, while designation impacts employee’s perception in all the factors.
DISCUSSION, MANAGERIAL IMPLICATIONS AND CONCLUSION
This study focuses primarily on the theory of work adjustment. It posits that when an organization attempts to enhance the PO fit of an employee, due to the intrinsic motivation, positive attitudes and positive work-related outcomes at play, the employee’s intent to remain with the firm increases. Because of this, the study identified retention mixes of benefits offered by IT firms and how the perception of preference by different designations varies in them. This study follows the ‘Bundle of HRM practices’ approach (Guchait & Cho, 2010; Morita, 2006; Snell & Dean, 1992) for each designation, as the combination of these practices, if applied strategically, is most effective at managing employee performance and turnover (Byle & Holtgraves, 2008). The study findings confirm the proposition of RBV: that retention strategies need to be customized for each designation in the firm, as intent to remain also varies by job level (Jones et al., 2009; Presbitero et al., 2016; Watson et al., 2004; Menezes, 2015).
Findings from this study can help IT organizations to develop retention strategies targeted at different designations. Remuneration, training, supervision, relationships with colleagues, career advancement opportunities, type of work, recognition, job security, fringe benefits, location of posting, higher education support, flexible timings, work from home options, mentoring, communication platforms, acceptance of ideas and company size and image, were used to identify the benefits desired by employees. The findings support the premise that organizational factors affect the PO fit of employees (Weathington & Tetrick, 2000), and that individuals who fit with their organizations have positive work-related outcomes (Spurk et al., 2019) and are content (Ostroff & Bowen, 2016; Sood et al., 2022) which can be explained by the ‘work environment congruence’ and ‘value congruence’ approaches of PO fit (Westerman & Cyr, 2004; McElroy et al., 2014).
Based on the two-way ANOVA applied to the retention mix of benefits for each organization and designation, preferred benefits differ significantly by designation. While the inner circle represents the retention benefits commonly preferred by all designations, the outer circles represent a specific preference for each designation (figure 2). The most attractive factors for retaining level one employees are training and development, recognition and job security, company identification, work-life balance practices, employee benefits, and family-friendly practices (Richter & Schrader, 2016; Tziner & Birati, 1996; Sood, 2022; Yerpudee et al., 2022). The primary reason for this is attraction towards the reputation and size of large organizations. Besides this, at the entry-level, security is of utmost importance, in addition to lucrative compensation and benefits. To move up the career ladder, employees also seek educational and supervisor support to remain motivated (HiringEmployees, 2014). This is consistent with previous literature that HRD initiatives at firms support employee growth through an environment which fosters continuous learning (Bertelli, 2007; Cascio, 2014; Snell & Youndt, 1995).
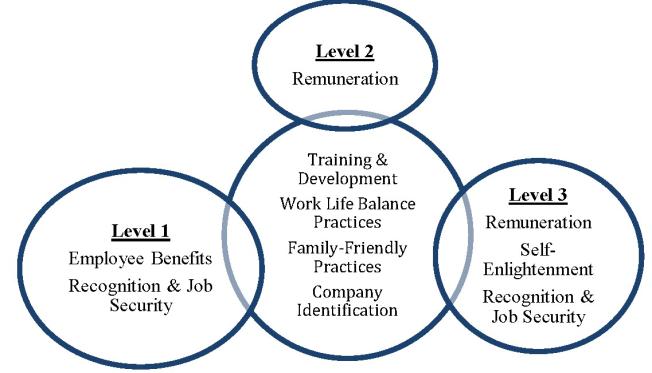
Figure 2. Model depicting preferred retention mix of benefits.
Apart from the common preferences at level two in the IT sector, remuneration appears to be a major inducement for retention (Scott et al., 2012; Varma et al., 2022). They are more interested in better-paying jobs than in enhancing their skills and abilities in their present position. This is similar to the characterization of gig economies where employees continually hop between jobs in search of better pay packages and benefits (Ferguson & Brohaugh, 2009), and also makes the employee feel valuable to the firm (Chadee & Raman, 2012; Murray, 1999). In addition, they seek flexible timing and communication platforms for to address grievances and express ideas and emotions. Such practices promote work-life balance, thereby enhancing job outcomes and reducing staff turnover (Presbitero et al., 2016; TNN, 2016). This also allows employees to voice their opinions through effective communication channels and promotes employer branding and identifying with the company (Guchait & Cho, 2010; Laura, 2013).
At level three in the IT sector, remuneration, company identification, self-enlightenment, recognition and job security, family-friendly practices, and work-life balance practices are the most important factors for staff retention (Cappelli, 2000; Hayhurst et al., 2005). Since job roles and responsibilities are often in managerial and leadership areas, employees seek a mentor to attain a work-life balance and empowerment and platforms for expressing their voice and ideas. Mentoring is seen to positively affect work-life balance (Cascio & Aguinis, 2011) and lowers withdrawal cognition through the positive impact on their attitudes (Batt & Valcour, 2013). They also need flexibility in location and recognition of their efforts. At this level, company size and image matter a lot, and that is also why job-hopping increases at higher levels (Hamori, 2010; Kowske et al., 2010). Although the organization does not affect the preferred mix of benefits, ‘Location’ was significant for TCS since it offers choices of location to employees throughout their careers. TNN (2016) also supports the notion that offering work hour and location flexibility to employees helps reduce staff turnover.
REFERENCES
Akhtar, C. S., Aamir, A., Khurshid, M. A., Abro, M. M. Q., & Hussain, J. (2015). Total Rewards and Retention: Case Study of Higher Education Institutions in Pakistan. Procedia—Social and Behavioral Sciences, 210, 251-259. https://doi.org/10.1016/j.sbspro.2015.11.365
Amos, E. A., & Weathington, B. L. (2008). An analysis of the relation between employee-organization value congruence and employee attitudes. The Journal of Psychology: Interdisciplinary and Applied, 142, 615–631. https://doi.org/10.3200/JRLP.142.6.615-632
Armstrong-Stassen, M., & Ursel, N. D. (2009). Perceived organizational support, career satisfaction, and the retention of older workers. Journal of Occupational and Organizational Psychology, 82(1), 201-220. https://doi.org/10.1348/096317908X288838
Arthur, D. (2001). The Employee Recruitment and Retention Handbook. AMACOM.
Arthur, J. B. (1994). Effects of Human Resource Systems on Manufacturing Performance and Turnover. The Academy of Management Journal, 37(3), 670–687. https://doi.org/10.2307/256705
Astakhova, M. N. (2016). Explaining the effects of perceived person-supervisor fit and person-organization fit on organizational commitment in the U.S. and Japan. Journal of Business Research, 69(2), 956–963. https://doi.org/10.1016/j.jbusres.2015.08.039
Astakhova, M. N., & Porter, G. (2015). Understanding the work passion–performance relationship: The mediating role of organizational identification and moderating role of fit at work. Human Relations, 68(8), 1315–1346. https://doi.org/10.1177/0018726714555204
Atkinson, C., & Hall, L. (2011). Flexible working and happiness in the NHS. Employee Relations, 33(2), 88-105. https://doi.org/10.1108/01425451111096659
Backhaus, K. (2016). Employer Branding Revisited. Organization Management Journal, 13(4), 193–201. https://doi.org/10.1080/15416518.2016.1245128
Baltes, B. B., Briggs, T. E., Huff, J. W., Wright, J. A., & Neuman, G. A. (1999). Flexible and compressed workweek schedules: A meta-analysis of their effects on work-related criteria. Journal of Applied Psychology, 84(4), 496–513. https://doi.org/10.1037/0021-9010.84.4.496
Batt, R., & Valcour, P. M. (2003). Human resources practices as predictors of work-family outcomes and employee turnover. Industrial Relations: A Journal of Economy & Society, 42(2), 189–220. https://doi.org/10.1111/1468-232X.00287
Batt, R., Doellgast, V., Kwon, H., Nopany, M., Nopany, P., & da Costa, A. (2005). The Indian Call Centre Industry: National Benchmarking Report Strategy, HR Practices, & Performance [Working paper]. CAHRS, Cornell University. https://ecommons.cornell.edu/handle/1813/77401
Bellou, V., Chaniotakis, I., Kehagias, I., & Rigopoulou, I. (2015). Employer Brand of Choice: An employee perspective. Journal of Business Economics and Management, 16(6), 1201-1215. https://doi.org/10.3846/16111699.2013.848227
Bertelli, A. M. (2007). Determinants of Bureaucratic Turnover Intention: Evidence from the Department of the Treasury. Journal of Public Administration Research and Theory, 17(2), 235–258. https://doi.org/10.1093/jopart/mul003
Black, S. E., & Lynch, L. M. (1996). Human-Capital Investments and Productivity. The American Economic Review, 86(2), 263–267. https://www.jstor.org/stable/2118134
Bretz, R. D., & Judge, T. A. (1994). Person-organization fit and the Theory of Work Adjustment: Implications for satisfaction, tenure, and career success. Journal of Vocational Behavior, 44(1), 32–54. https://doi.org/10.1006/jvbe.1994.1003
Byle, K. A., & Holtgraves, T. M. (2008). Integrity Testing, Personality, and Design: Interpreting the Personnel Reaction Blank. Journal of Business and Psychology, 22(4), 287–295. https://doi.org/10.1007/s10869-008-9059-z
Cappelli, P. (2000, January). A Market-Driven Approach to Retaining Talent. Harvard Business Review. https://hbr.org/2000/01/a-market-driven-approach-to-retaining-talent.
Carberry, E. J. (2012). Making sense of organizational environments: The adoption of employee stock options in the Indian technology sector. The International Journal of Human Resource Management, 23(8), 1519–1546. https://doi.org/10.1080/09585192.2012.661988
Carless, S. A. (2005). Person–job fit versus person–organization fit as predictors of organizational attraction and job acceptance intentions: A longitudinal study. Journal of Occupational and Organizational Psychology, 78(3), 411–429. https://doi.org/10.1348/096317905X25995
Cascio, W. F. (2014). Leveraging employer branding, performance management and human resource development to enhance employee retention. Human Resource Development International, 17(2), 121–128. https://doi.org/10.1080/13678868.2014.886443
Cascio, W. F., & Aguinis, H. (2011). Applied Psychology in Human Resource Management. Prentice-Hall.
Chadee, D., & Raman, R. (2012). External knowledge and performance of offshore IT service providers in India: The mediating role of talent management. Asia Pacific Journal of Human Resources, 50(4), 459–482. https://doi.org/10.1111/j.1744-7941.2012.00039.x
Cho, Y. J., & Lewis, G. B. (2012). Turnover Intention and Turnover Behavior: Implications for Retaining Federal Employees. Review of Public Personnel Administration, 32(1), 4–23. https://doi.org/10.1177/0734371X11408701
Creative Research Systems. (2012). Sample Size Calculator. https://surveysystem.com/sscalc.htm
Creswell, J. W., & Poth, C. N. (2015). Five Different Qualitative Studies. In J. W. Creswell & C. N. Poth (Eds.), Qualitative Inquiry and Research Design: Choosing Among Five Approaches (pp. 174-192). Sage Publications.
De Vos, A., & Meganck, A. (2009). What HR managers do versus what employees value: Exploring both parties’ views on retention management from a psychological contract perspective. Personnel Review, 38(1), 45-60. https://doi.org/10.1108/00483480910920705
Dibble, S. (1999). Keeping Your Valuable Employees: Retention Strategies for Your Organization. John Wiley and Sons.
Egan, T. M., Yang, B., & Bartlett, K. R. (2004). The effects of organizational learning culture and job satisfaction on motivation to transfer learning and turnover intention. Human Resource Development Quarterly, 15(3), 279–301. https://doi.org/10.1002/hrdq.1104
Elkjaer, D., & Filmer, S. (2015). Trends and Drivers of Workforce Turnover: The Results From Mercer’s 2014 Turnover Survey, and Dealing With Unwanted Attrition. Mercer. https://mercer.com/content/dam/mercer/attachments/global/webcasts/trends-and-drivers-of-workforce-turnover-results-from-mercers-2014-turnover-survey.pdf
Fairris, D. (2004). Internal Labor Markets and Worker Quits. Industrial Relations: A Journal of Economy and Society, 43(3), 573–594. https://doi.org/10.1111/j.0019-8676.2004.00350.x
Ferguson, R. D., & Brohaugh, B. (2009). The Talent Wars. Journal of Consumer Marketing, 26, 358-362. https://doi.org/10.1108/07363760910976619
Fletcher, L., Alfes, K., & Robinson, D. (2018). The relationship between perceived training and development and employee retention: The mediating role of work attitudes. The International Journal of Human Resource Management, 29(18), 2701–2728. https://doi.org/10.1080/09585192.2016.1262888
Ganco, M., Ziedonis, R. H., & Agarwal, R. (2015). More Stars Stay, but the Brightest Ones Still Leave: Job Hopping in the Shadow of Patent Enforcement. Strategic Management Journal, 36(5), 659–685. https://www.jstor.org/stable/43897796
Garg, P., & Rastogi, R. (2006). New model of job design: motivating employees' performance. Journal of Management Development, 25(6), 572-587. https://doi.org/10.1108/02621710610670137
Gberevbie, D. E. (2008). Employee Retention Strategies and Organizational Performance. Ife Psychologia, 16(2), 148-173.
Griffin, R. W., Welsh, A., & Moorhead, G. (1981). Perceived Task Characteristics and Employee Performance: A Literature Review. The Academy of Management Review, 6(4), 655–664. https://doi.org/10.2307/257645[A11]
Grima, S., Baldacchino, P. J., Abela, J. M., & Spiteri, J. V. (2020). The implications of derisking: the case of Malta, a small EU state. Journal of Risk and Financial Management, 13(9), 216.
Grima, S., Kizilkaya, M., Sood, K., & ErdemDelice, M. (2021). The perceived effectiveness of blockchain for digital operational risk resilience in the European Union insurance market sector. Journal of Risk and Financial Management, 14(8), 363.
Guchait, P., & Cho, S. (2010). The impact of human resource management practices on intention to leave of employees in the service industry in India: The mediating role of organizational commitment. The International Journal of Human Resource Management, 21(8), 1228–1247. https://doi.org/10.1080/09585192.2010.483845
Hamori, M. (2010, July). Managing Yourself: Job-Hopping to the Top and Other Career Fallacies. Harvard Business Review. https://hbr.org/2010/07/managing-yourself-job-hopping-to-the-top-and-other-career-fallacies
Hancock, J. I., Allen, D. G., Bosco, F. A., McDaniel, K. R., & Pierce, C. A. (2013). Meta-Analytic Review of Employee Turnover as a Predictor of Firm Performance. Journal of Management, 39(3), 573–603. https://doi.org/10.1177/0149206311424943
Hayhurst, A., Saylor, C., & Stuenkel, D. (2005). Work environmental factors and retention of nurses. Journal of Nursing Care Quality, 20(3), 283–288. https://doi.org/10.1097/00001786-200507000-00015
Heeks, R. (2015, April 28). Indian IT/Software Statistics: 1980-2015 time-series data. https://ict4blog.wordpress.com/2015/04/28/indian-itsoftware-sector-statistics-1980-2015-time-series-data/
Hoffman, B. J., & Woehr, D. J. (2006). A quantitative review of the relationship between person–organization fit and behavioral outcomes. Journal of Vocational Behavior, 68(3), 389–399. https://doi.org/10.1016/j.jvb.2005.08.003[A15]
Holland, P., Sheehan, C., & De Cieri, H. (2007). Attracting and retaining talent: exploring human resources development trends in Australia. Human Resource Development International, 10(3), 247–262. http://dx.doi.org/10.1080/13678860701515158
Ishiyama, N. (2011). The Role of Specialized Area Commitment and Cross-Boundary Capability Development for Specialists in the Organization. Innovation Management, 8, 17–36.
Jones, D. A., Willness, C., & Macneil, S. (2009). Corporate social responsibility and recruitment: Testing person-organization fit and signaling mechanisms. Academy of Management Proceedings, 1–6. https://doi.org/10.5465/ambpp.2009.44265576
Karatepe, O. M. (2013). High-performance work practices and hotel employee performance: The mediation of work engagement. International Journal of Hospitality Management, 32, 132–140. https://doi.org/10.1016/j.ijhm.2012.05.003
Kim, S. (2005). Factors Affecting State Government Information Technology Employee Turnover Intentions. The American Review of Public Administration, 35(2), 137–156. https://doi.org/10.1177/0275074004273150
Kossivi, B., Xu, M., & Kalgora, B. (2016). Study on Determining Factors of Employee Retention. Open Journal of Social Sciences, 4(5), 261-268. https://doi.org/10.4236/jss.2016.45029
Kowske, B. J., Rasch, R., & Wiley, J. (2010). Millennials’ (lack of) attitude problem: An empirical examination of generational effects on work attitudes. Journal of Business and Psychology, 25(2), 265–279. https://doi.org/10.1007/s10869-010-9171-8
Kristof, A. L. (1996). Person-organization fit: An integrative review of its conceptualizations, measurement, and implications. Personnel Psychology, 49(1), 1–49. https://doi.org/10.1111/j.1744-6570.1996.tb01790.x
Kumar, R., & Arora, R. (2012). Determinants of Talent Retention in BPO Industry. Indian Journal of Industrial Relations, 48(2), 259–273.
Lambert, V., & Lambert, C. (2012). Qualitative descriptive research: An acceptable design. Pacific Rim International Journal of Nursing Research, 16(4), 255-256. https://he02.tci-thaijo.org/index.php/PRIJNR/article/download/5805/5064
Laura, H. (2013, March 29). Google’s Secrets Of Innovation: Empowering Its Employees. Forbes. https://www.forbes.com/sites/laurahe/2013/03/29/googles-secrets-of-innovation-empowering-its-employees/#58910f2057e7
Lawrence, D. (2011, March 16). Mentoring – A Strategic Approach To Retention And Recruitment. Insider. http://www.businessinsider.com/mentoring--a-strategic-approach-to-retention-and-recruitment-2011-3?IR=T
Long, J. S., McKenzie-Robblee, S., Schaefer, L., Steeves, P., Wnuk, S., Pinnegar, E., & Clandinin, D. J. (2012). Literature Review on Induction and Mentoring Related to Early Career Teacher Attrition and Retention. Mentoring & Tutoring: Partnership in Learning, 20(1), 7–26. https://doi.org/10.1080/13611267.2012.645598
Malhotra, N. K. (2004). Marketing Research: An Applied Orientation. Pearson Education.
McCulloch, M. C., & Turban, D. B. (2007). Using Person–Organization Fit to Select Employees for High-Turnover Jobs. International Journal of Selection and Assessment, 15(1), 63–71. https://doi.org/10.1111/j.1468-2389.2007.00368.x
McElroy, S. E., Rice, K. G., Davis, D. E., Hook, J. N., Hill, P. C., Worthington, E. L., Jr., & Van Tongeren, D. R. (2014). Intellectual humility: Scale development and theoretical elaborations in the context of religious leadership. Journal of Psychology and Theology, 42(1), 19–30. https://doi.org/10.1177/009164711404200103
Menezes, B. (2015, February 11). Indian IT services exports seen growing 12-14% in year ahead. Mint. https://www.livemint.com/Industry/bCLOgyaLGiIi6TuhmN0S7J/Indian-IT-services-exports-seen-growing-1214-in-year-ahead.html
Morita, S. (2006). The Influences of Preferences for Professionalism on Vocational Decisions among Students Proceeding to Medical School. Japan Society of Developmental Psychology, 252-262.
Morrow, P. C., & Wirth, R. E. (1989). Work commitment among salaried professionals. Journal of Vocational Behavior, 34(1), 40–56. https://doi.org/10.1016/0001-8791(89)90063-8
Motowidlo, S. J. (1983). Predicting sales turnover from pay satisfaction and expectation. Journal of Applied Psychology, 68(3), 484–489. https://doi.org/10.1037/0021-9010.68.3.484Moynihan, D. P., & Landuyt, N. (2008). Explaining Turnover Intention in State Government: Examining the Roles of Gender, Life Cycle, and Loyalty. Review of Public Personnel Administration, 28(2), 120–143. https://doi.org/10.1177/0734371X08315771
Murray, J. P. (1999). Successfully Hiring and Retaining it Personnel. Information Systems Management, 16(2), 18–24. https://doi.org/10.1201/1078/43188.16.2.19990301/31172.4
Nishii, L. H., Lepak, D. P., & Schneider, B. (2008). Employee attributions of the "why" of HR practices: Their effects on employee attitudes and behaviors, and customer satisfaction. Personnel Psychology, 61(3), 503–545. https://doi.org/10.1111/j.1744-6570.2008.00121.x
O’Leonard, K. (2013). The Corporate Learning Factbook. Deloitte Development.
Ostroff, C., & Bowen, D. E. (2016). Reflections on the 2014 decade award: Is there strength in the construct of HR system strength? The Academy of Management Review, 41(2), 196–214. https://doi.org/10.5465/amr.2015.0323
Ostroff, C., Shin, Y., & Kinicki, A. J. (2005). Multiple perspectives of congruence: Relationships between value congruence and employee attitudes. Journal of Organizational Behavior, 26(6), 591–623. https://doi.org/10.1002/job.333
Pasewark, W. R., & Viator, R. E. (2006). Sources of Work‐Family Conflict in the Accounting Profession. Behavioral Research in Accounting, 18(1), 147–165. https://doi.org/10.2308/bria.2006.18.1.147
Paul, A. K., & Anantharaman, R. N. (2003). Impact of people management practices on organizational performance: Analysis of a causal model. The International Journal of Human Resource Management, 14(7), 1246–1266. https://doi.org/10.1080/0958519032000145648
Perez, M. (2008). Turnover Intent [Unpublished diploma dissertation]. University of Zurich. https://docplayer.net/20983210-Turnover-intent-diploma-thesis.html
Poba-Nzaou, P., Lemieux, N., Beaupré, D., & Uwizeyemungu, S. (2016). Critical challenges associated with the adoption of social media: A Delphi of a panel of Canadian human resources managers. Journal of Business Research, 69(10), 4011–4019. https://doi.org/10.1016/j.jbusres.2016.06.006
Presbitero, A., Roxas, B., & Chadee, D. (2016). Looking beyond HRM practices in enhancing employee retention in BPOs: Focus on employee–organization value fit. The International Journal of Human Resource Management, 27(6), 635–652. https://doi.org/10.1080/09585192.2015.1035306
Rau, B. L., & Hyland, M. M. (2002). Role conflict and flexible work arrangements: The effects on applicant attraction. Personnel Psychology, 55(1), 111–136. https://doi.org/10.1111/j.1744-6570.2002.tb00105.x
Richter, A., & Schrader, S. (2016). Financial Participation and Recruitment and Retention: Causes and Consequences. International Journal of Human Resource Management, 28(11), 1563–1590. https://doi.org/10.1080/09585192.2015.1128456
Roberts, M., & Illardi, S. (2003). Handbook of Research Methods in Clinical Psychology. Blackwell.
Roy, S. (2010, November 2). IT majors reboot employee retention strategies. Financial Express. http://www.financialexpress.com/news/it-majors-reboot-employee-retention-strategies/705699
Sakazume, H. (2002). Impacts of Family-friendly Practices on Employee Attitude and Organizational Performance. Japanese Journal of Labour Studies, 503, 29–42.
Samuel, M. O., & Chipunza, C. (2009). Employee retention and turnover: Using motivational variables as a panacea. African Journal of Business Management, 3, 410-415.
Schmidt, R. A., & Bjork, R. A. (1992). New Conceptualizations of Practice: Common Principles in Three Paradigms Suggest New Concepts for Training. Psychological Science, 3(4), 207–218. https://doi.org/10.1111/j.1467-9280.1992.tb00029.x
Scott, D., McMullen, T., & Royal, M. (2012). Retention of Key Talent and Role of Rewards. Hay Group.
Scullion, H., Collings, D. G., & Caligiuri, P. (2010). Global talent management. Journal of World Business, 45(2), 105–108. https://doi.org/10.1016/j.jwb.2009.09.011
Sheridan, J. E. (1992). Organizational Culture and Employee Retention. The Academy of Management Journal, 35(5), 1036–1056. https://doi.org/10.2307/256539
Shin, Y. (2004). A Person-Environment Fit Model for Virtual Organizations. Journal of Management, 30(5), 725–743. https://doi.org/10.1016/j.jm.2004.03.002
Silbert, L. (2005). The Effect of Tangible Rewards on Perceived Organizational Support [Unpublished master’s dissertation]. University of Waterloo.
Snell, S. A., & Dean, J. W. (1992). Integrated Manufacturing and Human Resource Management: A Human Capital Perspective. The Academy of Management Journal, 35(3), 467–504. https://doi.org/10.2307/256484
Snell, S. A., & Youndt, M. A. (1995). Human Resource Management and Firm Performance: Testing a Contingency Model of Executive Controls. Journal of Management, 21(4), 711–737. https://doi.org/10.1177/014920639502100407
Sood, K., Balamurugan, B., Grima, S., & Marano, P. (Eds.). (2022). Big Data Analytics in the Insurance Market. Emerald Group Publishing.
Sood, K., Kaur, B., & Grima, S. (2022). Revamping Indian Non-Life Insurance Industry with a Trusted Network: Blockchain Technology. In Big Data: A Game Changer for Insurance Industry (pp. 213-228). Emerald Publishing Limited.
Spencer, D. G. (1986). Employee Voice and Employee Retention. The Academy of Management Journal, 29(3), 488–502. https://doi.org/10.2307/256220
Spurk, D., Hirschi, A., & Dries, N. (2019). Antecedents and outcomes of objective versus subjective career success: Competing perspectives and future directions. Journal of Management, 45(1), 35–69. https://doi.org/10.1177/0149206318786563
Steers, R., & Mowday, R. (1981). Employee Turnover and Post-Decision Accommodation Process. In L. Cummings & B. Staw (Eds.), Research in Organizational Behavior (pp. 237-249). Jai Press.
Thite, M. (2010). All that Glitters is not Gold: Employee Retention in Offshored Indian Information Technology Enabled Services. Journal of Organizational Computing and Electronic Commerce, 20(1), 7–22. https://doi.org/10.1080/10919390903482390
TNN. (2016, September). Cognizant offering its employees the flexibility to work from home 2 days in a week. The Economic Times. http://economictimes.indiatimes.com/tech/cognizant-offering-its-employees-the-flexibility-to-work-from-home-2-days-in-a-week/articleshow/54341444.cms
Tsuda, M. (1993). Personnel and Labour Management. Minerva-shobo.
Tziner, A., & Birati, A. (1996). Assessing employee turnover costs: A revised approach. Human Resource Management Review, 6(2), 113–122. https://doi.org/10.1016/S1053-4822(96)90015-7
Van Knippenberg, D. (2000). Work Motivation and Performance: A Social Identity Perspective. Applied Psychology, 49(3), 357–371. https://doi.org/10.1111/1464-0597.00020
Van Vianen, A. E. M., De Pater, I. E., & Van Dijk, F. (2007) .Work value fit and turnover intention: same-source or different-source fit. Journal of Managerial Psychology, 22(2), 188-202. https://doi.org/10.1108/02683940710726438
Varma, P., Nijjer, S., Sood, K., Grima, S., & Rupeika-Apoga, R. (2022). Thematic Analysis of Financial Technology (Fintech) Influence on the Banking Industry. Risks, 10(10), 186.
Vorhauser-Smith, S. (2012, July 2). How to stop employee turnover in India. Forbes. https://www.forbes.com/sites/sylviavorhausersmith/2012/07/02/how-to-stop-employee-turnover-in-india/
Wagar, T., & Rondeau, K. (2006). Retaining Employees in Small and Medium-Sized Firms: Examining the Link with Human Resource Management. Journal of Applied Management and Entrepreneurship, 11(2), 3–16.
Watson, G. W., Papamarcos, S. D., Teague, B. T., & Bean, C. (2004). Exploring the Dynamics of Business Values: A Self-Affirmation Perspective. Journal of Business Ethics, 49(4), 337–346.
Weathington, B. L., & Tetrick, L. E. (2000). Compensation or right: An analysis of employee “fringe” benefit perception. Employee Responsibilities and Rights Journal, 12(3), 141–162. https://doi.org/10.1023/A:1011153710102
Westerman, J. W., & Cyr, L. A. (2004). An Integrative Analysis of Person–Organization Fit Theories. International Journal of Selection and Assessment, 12(3), 252–261. https://doi.org/10.1111/j.0965-075X.2004.279_1.x
Whiting, A., & Williams, D. (2013). Why People Use Social Media: A Uses and Gratifications Approach. Qualitative Market Research, 16(4), 362-369.
Williams, M. L., & Dreher, G. F. (1992). Compensation System Attributes and Applicant Pool Characteristics. The Academy of Management Journal, 35(3), 571–595. https://doi.org/10.2307/256487
Yamamoto, H. (2008). Study of Job Change and Career: From the Viewpoint of Inter-Organizational Career Development. Soseisha.
Yamamoto, H. (2011). The relationship between employee benefit management and employee retention. The International Journal of Human Resource Management, 22(17), 3550–3564. https://doi.org/10.1080/09585192.2011.560871
Yamamoto, H. (2013). The relationship between employees’ perceptions of human resource management and their retention: From the viewpoint of attitudes toward job-specialties. The International Journal of Human Resource Management, 24(4), 747–767. https://doi.org/10.1080/09585192.2012.697478=
Yerpudee, S., Sood, K., & Grima, S. (2022). Blockchain-Augmented Digital Supply Chain Management: A Way to Sustainable Business. Journal of Risk and Financial Management, 16(1), 7.
Yiu, L., & Saner, R. (2008). Indian Employee Turnover Study Research Report. Confederation of Indian Industry. http://www.csend.org/images/articles/files/Saner-YiuResearchPaper_TurnoverinIndia27.01.08Final.pdf
APPENDIX
Table 4. Results of two-way ANOVA for pay as retention factor.
|
Tests of Between-Subjects Effects |
|||||
|
Dependent Variable: Pay |
|||||
|
Source |
Type III Sum of Squares |
df |
Mean Square |
F |
Sig. |
|
Corrected Model |
74.857a |
5 |
14.971 |
9.033 |
.000 |
|
Intercept |
3906.717 |
1 |
3906.717 |
2357.128 |
.000 |
|
Designation |
73.234 |
2 |
36.617 |
22.093 |
.000 |
|
Organization |
.605 |
1 |
.605 |
.365 |
.546 |
|
Designation * Organization |
2.230 |
2 |
1.115 |
.673 |
.511 |
|
Error |
953.008 |
575 |
1.657 |
|
|
|
Total |
4994.000 |
581 |
|
|
|
|
Corrected Total |
1027.866 |
580 |
|
|
|
|
a. R Squared = .073 (Adjusted R Squared = .065) |
|||||
Table 5. Descriptive statistics for designation and perception of pay.
|
1. Designation |
||||
|
Dependent Variable: Pay |
||||
|
Designation |
Mean |
Std. Error |
95% Confidence Interval |
|
|
Lower Bound |
Upper Bound |
|||
|
Level 1 |
2.102 |
.094 |
1.916 |
2.288 |
|
Level 2 |
2.870 |
.092 |
2.689 |
3.052 |
|
Level 3 |
2.861 |
.093 |
2.679 |
3.043 |
Table 6. Results of two-way ANOVA for training.
|
Tests of Between-Subjects Effects |
|||||
|
Dependent Variable: Training |
|||||
|
Source |
Type III Sum of Squares |
df |
Mean Square |
F |
Sig. |
|
Corrected Model |
91.976a |
5 |
18.395 |
11.080 |
.000 |
|
Intercept |
4224.875 |
1 |
4224.875 |
2544.851 |
.000 |
|
Designation |
86.601 |
2 |
43.300 |
26.082 |
.000 |
|
Organization |
3.613 |
1 |
3.613 |
2.177 |
.141 |
|
Designation * Organization |
.003 |
2 |
.002 |
.001 |
.999 |
|
Error |
954.596 |
575 |
1.660 |
|
|
|
Total |
5327.000 |
581 |
|
|
|
|
Corrected Total |
1046.571 |
580 |
|
|
|
|
a. R Squared = .088 (Adjusted R Squared = .080) |
|||||
Table 7. Descriptive statistics for designation and perception of training.
|
1. Designation |
||||
|
Dependent Variable: Training |
||||
|
Designation |
Mean |
Std. Error |
95% Confidence Interval |
|
|
Lower Bound |
Upper Bound |
|||
|
Level 1 |
2.201 |
.095 |
2.015 |
2.387 |
|
Level 2 |
3.147 |
.092 |
2.965 |
3.329 |
|
Level 3 |
2.798 |
.093 |
2.616 |
2.980 |
Table 8. Results of two-way ANOVA for supervision.
|
Tests of Between-Subjects Effects |
|||||
|
Dependent Variable: Supervision |
|||||
|
Source |
Type III Sum of Squares |
Df |
Mean Square |
F |
Sig. |
|
Corrected Model |
132.599a |
5 |
26.520 |
16.356 |
.000 |
|
Intercept |
4406.904 |
1 |
4406.904 |
2717.938 |
.000 |
|
Designation |
129.642 |
2 |
64.821 |
39.978 |
.000 |
|
Organization |
1.259 |
1 |
1.259 |
.776 |
.379 |
|
Designation * Organization |
.424 |
2 |
.212 |
.131 |
.878 |
|
Error |
932.313 |
575 |
1.621 |
|
|
|
Total |
5543.000 |
581 |
|
|
|
|
Corrected Total |
1064.912 |
580 |
|
|
|
Table 9. Descriptive statistics for designation and perception of supervision.
|
1. Designation |
||||
|
Dependent Variable: Supervision |
||||
|
Designation |
Mean |
Std. Error |
95% Confidence Interval |
|
|
Lower Bound |
Upper Bound |
|||
|
Level 1 |
2.886 |
.093 |
2.599 |
2.959 |
|
Level 2 |
3.355 |
.091 |
3.175 |
3.534 |
|
Level 3 |
2.179 |
.092 |
2.002 |
2.369 |
Table 10. Results of two-way ANOVA for relationship with colleagues as retention factor.
|
Tests of Between-Subjects Effects |
|||||
|
Dependent Variable: Relationship with colleagues |
|||||
|
Source |
Type III Sum of Squares |
df |
Mean Square |
F |
Sig. |
|
Corrected Model |
168.343a |
5 |
33.669 |
20.444 |
.000 |
|
Intercept |
4284.755 |
1 |
4284.755 |
2601.810 |
.000 |
|
Designation |
167.530 |
2 |
83.765 |
50.864 |
.000 |
|
Organization |
.433 |
1 |
.433 |
.263 |
.608 |
|
Designation * Organization |
1.365 |
2 |
.682 |
.414 |
.661 |
|
Error |
946.931 |
575 |
1.647 |
|
|
|
Total |
5483.000 |
581 |
|
|
|
|
Corrected Total |
1115.274 |
580 |
|
|
|
|
a. R Squared = .151 (Adjusted R Squared = .144) |
|||||
Table 11. Descriptive statistics for designation and perception of relationship with colleagues.
|
1. Designation |
||||
|
Dependent Variable: Relationship with colleagues |
||||
|
Designation |
Mean |
Std. Error |
95% Confidence Interval |
|
|
Lower Bound |
Upper Bound |
|||
|
Level 1 |
2.048 |
.094 |
1.863 |
2.233 |
|
Level 2 |
3.375 |
.092 |
3.194 |
3.556 |
|
Level 3 |
2.780 |
.092 |
2.599 |
2.961 |
Table 12. Results of two-way ANOVA for career advancement opportunity as retention factor.
|
Tests of Between-Subjects Effects |
|||||
|
Dependent Variable: Career advancement |
|||||
|
Source |
Type III Sum of Squares |
df |
Mean Square |
F |
Sig. |
|
Corrected Model |
107.288a |
5 |
21.458 |
12.497 |
.000 |
|
Intercept |
4508.497 |
1 |
4508.497 |
2625.831 |
.000 |
|
Designation |
105.440 |
2 |
52.720 |
30.705 |
.000 |
|
Organization |
.030 |
1 |
.030 |
.017 |
.895 |
|
Designation * Organization |
.005 |
2 |
.002 |
.001 |
.999 |
|
Error |
987.263 |
575 |
1.717 |
|
|
|
Total |
5690.000 |
581 |
|
|
|
|
Corrected Total |
1094.551 |
580 |
|
|
|
|
a. R Squared = .098 (Adjusted R Squared = .090) |
|||||
Table 13. Descriptive statistics for designation and perception of career advancement opportunity.
|
1. Designation |
||||
|
Dependent Variable: Career advancement |
||||
|
Designation |
Mean |
Std. Error |
95% Confidence Interval |
|
|
Lower Bound |
Upper Bound |
|||
|
Level 1 |
2.276 |
.096 |
2.087 |
2.465 |
|
Level 2 |
2.810 |
.094 |
2.625 |
2.995 |
|
Level 3 |
3.330 |
.094 |
3.145 |
3.515 |
Table 14. Results of two-way ANOVA for nature and type of work as retention factor.
|
Tests of Between-Subjects Effects |
|||||
|
Dependent Variable: Nature of work |
|||||
|
Source |
Type III Sum of Squares |
df |
Mean Square |
F |
Sig. |
|
Corrected Model |
131.679a |
5 |
26.336 |
16.738 |
.000 |
|
Intercept |
4497.779 |
1 |
4497.779 |
2858.556 |
.000 |
|
Designation |
129.996 |
2 |
64.998 |
41.309 |
.000 |
|
Organization |
.894 |
1 |
.894 |
.568 |
.451 |
|
Designation * Organization |
1.015 |
2 |
.507 |
.322 |
.725 |
|
Error |
904.731 |
575 |
1.573 |
|
|
|
Total |
5615.000 |
581 |
|
|
|
|
Corrected Total |
1036.410 |
580 |
|
|
|
|
a. R Squared = .127 (Adjusted R Squared = .119) |
|||||
Table 15. Descriptive statistics for designation and perception of nature and type of work.
|
1. Designation |
||||
|
Dependent Variable: Nature of work |
||||
|
Designation |
Mean |
Std. Error |
95% Confidence Interval |
|
|
Lower Bound |
Upper Bound |
|||
|
Level 1 |
2.167 |
.092 |
1.986 |
2.347 |
|
Level 2 |
2.916 |
.090 |
2.739 |
3.093 |
|
Level 3 |
3.322 |
.090 |
3.146 |
3.499 |
Table 16. Results of two-way ANOVA for recognition as retention factor.
|
Tests of Between-Subjects Effects |
|||||
|
Dependent Variable: Recognition |
|||||
|
Source |
Type III Sum of Squares |
Df |
Mean Square |
F |
Sig. |
|
Corrected Model |
120.873a |
5 |
24.175 |
14.007 |
.000 |
|
Intercept |
4629.501 |
1 |
4629.501 |
2682.357 |
.000 |
|
Designation |
119.880 |
2 |
59.940 |
34.729 |
.000 |
|
Organization |
.025 |
1 |
.025 |
.014 |
.905 |
|
Designation * Organization |
.274 |
2 |
.137 |
.079 |
.924 |
|
Error |
992.397 |
575 |
1.726 |
|
|
|
Total |
5839.000 |
581 |
|
|
|
|
Corrected Total |
1113.270 |
580 |
|
|
|
|
a. R Squared = .109 (Adjusted R Squared = .101) |
|||||
Table 17. Descriptive statistics for designation and perception of recognition.
|
1. Designation |
||||
|
Dependent Variable: Recognition |
||||
|
Designation |
Mean |
Std. Error |
95% Confidence Interval |
|
|
Lower Bound |
Upper Bound |
|||
|
Level 1 |
3.361 |
.096 |
3.176 |
3.546 |
|
Level 2 |
2.244 |
.094 |
2.054 |
2.433 |
|
Level 3 |
2.923 |
.094 |
2.737 |
3.108 |
Table 18. Results of two-way ANOVA for job security as retention factor.
|
Tests of Between-Subjects Effects |
|||||
|
Dependent Variable: Job Security |
|||||
|
Source |
Type III Sum of Squares |
Df |
Mean Square |
F |
Sig. |
|
Corrected Model |
121.874a |
5 |
24.375 |
15.615 |
.000 |
|
Intercept |
4561.650 |
1 |
4561.650 |
2922.284 |
.000 |
|
Designation |
120.305 |
2 |
60.153 |
38.535 |
.000 |
|
Organization |
1.144 |
1 |
1.144 |
.733 |
.392 |
|
Designation * Organization |
1.938 |
2 |
.969 |
.621 |
.538 |
|
Error |
897.568 |
575 |
1.561 |
|
|
|
Total |
5660.000 |
581 |
|
|
|
|
Corrected Total |
1019.442 |
580 |
|
|
|
|
a. R Squared = .120 (Adjusted R Squared = .112) |
|||||
Table 19. Descriptive statistics for designation and perception of job security.
|
1. Designation |
||||
|
Dependent Variable: Job Security |
||||
|
Designation |
Mean |
Std. Error |
95% Confidence Interval |
|
|
Lower Bound |
Upper Bound |
|||
|
Level 1 |
3.356 |
.092 |
3.180 |
3.532 |
|
Level 2 |
2.233 |
.090 |
2.053 |
2.413 |
|
Level 3 |
2.875 |
.090 |
2.699 |
3.052 |
Table 20. Results of two-way ANOVA for fringe benefits as retention factor.
|
Tests of Between-Subjects Effects |
|||||
|
Dependent Variable: Fringe Benefits |
|||||
|
Source |
Type III Sum of Squares |
Df |
Mean Square |
F |
Sig. |
|
Corrected Model |
67.277a |
5 |
13.455 |
8.876 |
.000 |
|
Intercept |
4771.155 |
1 |
4771.155 |
3147.298 |
.000 |
|
Designation |
57.874 |
2 |
28.937 |
19.088 |
.000 |
|
Organization |
.227 |
1 |
.227 |
.150 |
.699 |
|
Designation * Organization |
3.911 |
2 |
1.956 |
1.290 |
.276 |
|
Error |
871.673 |
575 |
1.516 |
|
|
|
Total |
5791.000 |
581 |
|
|
|
|
Corrected Total |
938.950 |
580 |
|
|
|
|
a. R Squared = .072 (Adjusted R Squared = .064) |
|||||
Table 21. Descriptive statistics for designation and perception of fringe benefits.
|
1. Designation |
||||
|
Dependent Variable: Fringe Benefits |
||||
|
Designation |
Mean |
Std. Error |
95% Confidence Interval |
|
|
Lower Bound |
Upper Bound |
|||
|
Level 1 |
3.231 |
.090 |
3.058 |
3.405 |
|
Level 2 |
2.461 |
.088 |
2.283 |
2.638 |
|
Level 3 |
2.965 |
.089 |
2.791 |
3.138 |
Table 22. Results of two-way ANOVA for location as retention factor.
|
Tests of Between-Subjects Effects |
|||||
|
Dependent Variable: Location |
|||||
|
Source |
Type III Sum of Squares |
df |
Mean Square |
F |
Sig. |
|
Corrected Model |
76.131a |
5 |
15.226 |
10.175 |
.000 |
|
Intercept |
4708.789 |
1 |
4708.789 |
3146.693 |
.000 |
|
Designation |
75.878 |
2 |
37.939 |
25.353 |
.000 |
|
Organization |
.097 |
1 |
.097 |
.065 |
.019 |
|
Designation * Organization |
1.286 |
2 |
.643 |
.430 |
.651 |
|
Error |
860.444 |
575 |
1.496 |
|
|
|
Total |
5731.000 |
581 |
|
|
|
|
Corrected Total |
936.575 |
580 |
|
|
|
|
a. R Squared = .081 (Adjusted R Squared = .073) |
|||||
Table 23.Descriptive statistics for designation and perception of location.
|
1. Designation |
||||
|
Dependent Variable: Location |
||||
|
Designation |
Mean |
Std. Error |
95% Confidence Interval |
|
|
Lower Bound |
Upper Bound |
|||
|
Level 1 |
3.286 |
.090 |
3.113 |
3.458 |
|
Level 2 |
2.395 |
.088 |
2.219 |
2.571 |
|
Level 3 |
2.919 |
.088 |
2.747 |
3.092 |
Table 24.Descriptive statistics for organization and perception of location.
|
2. Organization |
||||
|
Dependent Variable: Location |
||||
|
Organization |
Mean |
Std. Error |
95% Confidence Interval |
|
|
Lower Bound |
Upper Bound |
|||
|
Infosys |
2.854 |
.068 |
2.720 |
2.988 |
|
TCS |
2.280 |
.076 |
2.230 |
2.829 |
Table 25.Results of two-way ANOVA for higher education support as retention factor.
|
Tests of Between-Subjects Effects |
|||||
|
Dependent Variable: Higher education support |
|||||
|
Source |
Type III Sum of Squares |
df |
Mean Square |
F |
Sig. |
|
Corrected Model |
115.663a |
5 |
23.133 |
13.784 |
.000 |
|
Intercept |
4796.951 |
1 |
4796.951 |
2858.465 |
.000 |
|
Designation |
113.918 |
2 |
56.959 |
33.941 |
.000 |
|
Organization |
.009 |
1 |
.009 |
.005 |
.941 |
|
Designation * Organization |
.812 |
2 |
.406 |
.242 |
.785 |
|
Error |
964.940 |
575 |
1.678 |
|
|
|
Total |
5979.000 |
581 |
|
|
|
|
Corrected Total |
1080.602 |
580 |
|
|
|
|
a. R Squared = .107 (Adjusted R Squared = .099) |
|||||
Table 26.Descriptive statistics for designation and perception of higher education support.
|
1. Designation |
||||
|
Dependent Variable: Higher education support |
||||
|
Designation |
Mean |
Std. Error |
95% Confidence Interval |
|
|
Lower Bound |
Upper Bound |
|||
|
Level 1 |
3.408 |
.093 |
3.225 |
3.591 |
|
Level 2 |
2.316 |
.095 |
2.130 |
2.503 |
|
Level 3 |
2.956 |
.093 |
2.773 |
3.139 |
Table 27.Results of two-way ANOVA for flexible timings as retention factor.
|
Tests of Between-Subjects Effects |
|||||
|
Dependent Variable: Flexible working hours |
|||||
|
Source |
Type III Sum of Squares |
df |
Mean Square |
F |
Sig. |
|
Corrected Model |
104.354a |
5 |
20.871 |
13.620 |
.000 |
|
Intercept |
4566.189 |
1 |
4566.189 |
2979.862 |
.000 |
|
Designation |
100.978 |
2 |
50.489 |
32.949 |
.000 |
|
Organization |
.830 |
1 |
.830 |
.541 |
.462 |
|
Designation * Organization |
.697 |
2 |
.348 |
.227 |
.797 |
|
Error |
881.101 |
575 |
1.532 |
|
|
|
Total |
5659.962 |
581 |
|
|
|
|
Corrected Total |
985.455 |
580 |
|
|
|
|
a. R Squared = .106 (Adjusted R Squared = .098) |
|||||
Table 28.Descriptive statistics for designation and perception of flexible timings.
|
1. Designation |
||||
|
Dependent Variable: Flexible working hours |
||||
|
Designation |
Mean |
Std. Error |
95% Confidence Interval |
|
|
Lower Bound |
Upper Bound |
|||
|
Level 1 |
2.267 |
.091 |
2.089 |
2.446 |
|
Level 2 |
3.289 |
.089 |
3.114 |
3.463 |
|
Level 3 |
2.913 |
.089 |
2.738 |
3.088 |
Table 29.Results of two-way ANOVA for work from home option as retention factor.
|
Tests of Between-Subjects Effects |
|||||
|
Dependent Variable: Work from home option |
|||||
|
Source |
Type III Sum of Squares |
df |
Mean Square |
F |
Sig. |
|
Corrected Model |
129.976a |
5 |
25.995 |
17.407 |
.000 |
|
Intercept |
4522.266 |
1 |
4522.266 |
3028.258 |
.000 |
|
Designation |
120.793 |
2 |
60.397 |
40.444 |
.000 |
|
Organization |
.497 |
1 |
.497 |
.333 |
.564 |
|
Designation * Organization |
3.638 |
2 |
1.819 |
1.218 |
.297 |
|
Error |
858.680 |
575 |
1.493 |
|
|
|
Total |
5600.981 |
581 |
|
|
|
|
Corrected Total |
988.655 |
580 |
|
|
|
|
a. R Squared = .131 (Adjusted R Squared = .124) |
|||||
Table 30.Descriptive statistics for designation and perception of work from home option.
|
1. Designation |
||||
|
Dependent Variable: Work from home option |
||||
|
Designation |
Mean |
Std. Error |
95% Confidence Interval |
|
|
Lower Bound |
Upper Bound |
|||
|
Level 1 |
2.175 |
.090 |
1.999 |
2.351 |
|
Level 2 |
3.262 |
.088 |
3.090 |
3.435 |
|
Level 3 |
2.991 |
.088 |
2.818 |
3.163 |
Table 31.Results of two-way ANOVA for mentoring as retention factor.
|
Tests of Between-Subjects Effects |
|||||
|
Dependent Variable: Mentoring in firm |
|||||
|
Source |
Type III Sum of Squares |
Df |
Mean Square |
F |
Sig. |
|
Corrected Model |
127.822a |
5 |
25.564 |
17.448 |
.000 |
|
Intercept |
4337.169 |
1 |
4337.169 |
2960.130 |
.000 |
|
Designation |
124.337 |
2 |
62.169 |
42.430 |
.000 |
|
Organization |
3.114 |
1 |
3.114 |
2.125 |
.145 |
|
Designation * Organization |
2.870 |
2 |
1.435 |
.979 |
.376 |
|
Error |
842.488 |
575 |
1.465 |
|
|
|
Total |
5371.000 |
581 |
|
|
|
|
Corrected Total |
970.310 |
580 |
|
|
|
|
a. R Squared = .132 (Adjusted R Squared = .124) |
|||||
Table 32. Descriptive statistics for designation and perception of mentoring.
|
1. Designation |
||||
|
Dependent Variable: Mentoring in firm |
||||
|
Designation |
Mean |
Std. Error |
95% Confidence Interval |
|
|
Lower Bound |
Upper Bound |
|||
|
Level 1 |
2.119 |
.089 |
1.944 |
2.293 |
|
Level 2 |
2.897 |
.087 |
2.726 |
3.067 |
|
Level 3 |
3.238 |
.087 |
3.068 |
3.409 |
Table 33. Results of two-way ANOVA for communication problems as retention factor.
|
Tests of Between-Subjects Effects |
|||||
|
Dependent Variable: Communication platforms |
|||||
|
Source |
Type III Sum of Squares |
df |
Mean Square |
F |
Sig. |
|
Corrected Model |
98.920a |
5 |
19.784 |
12.147 |
.000 |
|
Intercept |
4566.507 |
1 |
4566.507 |
2803.732 |
.000 |
|
Designation |
95.452 |
2 |
47.726 |
29.303 |
.000 |
|
Organization |
1.735 |
1 |
1.735 |
1.065 |
.302 |
|
Designation * Organization |
.732 |
2 |
.366 |
.225 |
.799 |
|
Error |
936.517 |
575 |
1.629 |
|
|
|
Total |
5675.981 |
581 |
|
|
|
|
Corrected Total |
1035.437 |
580 |
|
|
|
|
a. R Squared = .096 (Adjusted R Squared = .088) |
|||||
Table 34. Descriptive statistics for Designation and perception of communication problems.
|
1. Designation |
||||
|
Dependent Variable: Communication platforms |
||||
|
Designation |
Mean |
Std. Error |
95% Confidence Interval |
|
|
Lower Bound |
Upper Bound |
|||
|
Level 1 |
2.897 |
.092 |
2.717 |
3.077 |
|
Level 2 |
3.284 |
.092 |
3.104 |
3.464 |
|
Level 3 |
2.288 |
0.094 |
2.104 |
2.472 |
Table 35. Results of two-way ANOVA for acceptance of ideas as retention factor.
|
Tests of Between-Subjects Effects |
|||||
|
Dependent Variable: Acceptance of ideas |
|||||
|
Source |
Type III Sum of Squares |
df |
Mean Square |
F |
Sig. |
|
Corrected Model |
149.642a |
5 |
29.928 |
18.016 |
.000 |
|
Intercept |
4461.837 |
1 |
4461.837 |
2685.890 |
.000 |
|
Designation |
142.669 |
2 |
71.335 |
42.941 |
.000 |
|
Organization |
.357 |
1 |
.357 |
.215 |
.643 |
|
Designation * Organization |
3.314 |
2 |
1.657 |
.997 |
.369 |
|
Error |
955.198 |
575 |
1.661 |
|
|
|
Total |
5661.000 |
581 |
|
|
|
|
Corrected Total |
1104.840 |
580 |
|
|
|
|
a. R Squared = .135 (Adjusted R Squared = .128) |
|||||
Table 36. Descriptive statistics for designation and perception of acceptance of ideas.
|
1. Designation |
||||
|
Dependent Variable: Acceptance of ideas |
||||
|
Designation |
Mean |
Std. Error |
95% Confidence Interval |
|
|
Lower Bound |
Upper Bound |
|||
|
Level 1 |
2.120 |
.095 |
1.935 |
2.306 |
|
Level 2 |
2.327 |
.093 |
2.145 |
2.509 |
|
Level 3 |
2.924 |
.093 |
2.742 |
3.106 |
Table 37. Results of two-way ANOVA for extra-curricular activities as a retention factor.
|
Tests of Between-Subjects Effects |
|||||
|
Dependent Variable: Extra-curricular activities |
|||||
|
Source |
Type III Sum of Squares |
df |
Mean Square |
F |
Sig. |
|
Corrected Model |
101.482a |
5 |
20.296 |
13.496 |
.000 |
|
Intercept |
4483.046 |
1 |
4483.046 |
2980.903 |
.000 |
|
Designation |
100.423 |
2 |
50.211 |
33.387 |
.000 |
|
Organization |
.587 |
1 |
.587 |
.390 |
.532 |
|
Designation * Organization |
.884 |
2 |
.442 |
.294 |
.745 |
|
Error |
864.755 |
575 |
1.504 |
|
|
|
Total |
5528.000 |
581 |
|
|
|
|
Corrected Total |
966.238 |
580 |
|
|
|
|
a. R Squared = .105 (Adjusted R Squared = .097) |
|||||
Table 38. Descriptive statistics for designation and perception of extra-curricular activities.
|
1. Designation |
||||
|
Dependent Variable: Extra-curricular activities |
||||
|
Designation |
Mean |
Std. Error |
95% Confidence Interval |
|
|
Lower Bound |
Upper Bound |
|||
|
Level 1 |
3.211 |
.088 |
3.038 |
3.383 |
|
Level 2 |
2.219 |
.090 |
2.042 |
2.396 |
|
Level 3 |
2.962 |
.088 |
2.789 |
3.135 |
Table 39. Results of two-way ANOVA for company size and image as retention factor.
|
Tests of Between-Subjects Effects |
|||||
|
Dependent Variable: Company Size Image |
|||||
|
Source |
Type III Sum of Squares |
df |
Mean Square |
F |
Sig. |
|
Corrected Model |
106.287a |
5 |
21.257 |
12.646 |
.000 |
|
Intercept |
4485.537 |
1 |
4485.537 |
2668.435 |
.000 |
|
Designation |
103.421 |
2 |
51.710 |
30.762 |
.000 |
|
Organization |
1.152 |
1 |
1.152 |
.685 |
.408 |
|
Designation * Organization |
.246 |
2 |
.123 |
.073 |
.929 |
|
Error |
966.553 |
575 |
1.681 |
|
|
|
Total |
5629.000 |
581 |
|
|
|
|
Corrected Total |
1072.840 |
580 |
|
|
|
|
a. R Squared = .099 (Adjusted R Squared = .091) |
|||||
Table 40. Descriptive statistics for designation and perception of company size and image.
|
1. Designation |
||||
|
Dependent Variable: Company Size Image |
||||
|
Designation |
Mean |
Std. Error |
95% Confidence Interval |
|
|
Lower Bound |
Upper Bound |
|||
|
Level 1 |
2.841 |
.093 |
2.658 |
3.024 |
|
Level 2 |
3.297 |
.093 |
3.115 |
3.480 |
|
Level 3 |
2.255 |
.095 |
2.068 |
2.442 |