ABSTRACT
The study of the test of measurement invariance across groups: autonomy, career satisfaction and job satisfaction scales in teleworking context in Thailand aimed to scrutinized and investigated the measurement invariance across two groups of employees regarding autonomy, career satisfaction and job satisfaction. The study utilized a multigroup confirmatory factor analysis technique based on review of related literature. The samples were selected from teleworking professionals both private and public sectors in Thailand. Research tools were questionnaire with rating scale and convenience sampling was applied. The results indicated that even in the strictest model which measurement structure, factor loadings, intercepts and residuals were all constrained to be the same, these measurements were still invariant regardless of groups. According to the implied result, even in a modern teleworking context at present, an element of autonomy and satisfaction were still measurable. Therefore, an organization, regardless of the type, private or public, could still measure a level of autonomy, career satisfaction and job satisfaction by using these traditional rating scale. Future research should possibly extent the result of this study by further analyze on the multi-group structural equation model to test an invariance causal relationship and indirect effect among group by utilizing these measurements and focus on a broader type of employee to generalize the result into a broader context.
Autonomy, Career satisfaction, Job satisfaction, Measurement invariance
INTRODUCTION
At present, even in an age of digital transformation, a high-caliber human capital requires mass investment by an organization both time and financial resource. A development of human capital has surely become an essential factor promoting organization professional targets and goal. In order to meet a high expectation from third party entities, an organization is required to invest on individual employee and train them to reskill or upskill in many aspects regarding work so as to make certain that they often meet expectations. The problem is that what if all those costly and expensive investment has gone in vain by a resignation of those good work forces. In accordance with a digital transformation and the coming of advance internet and mobile technologies, workers and workplaces are currently disrupted but in a positive way. There are many fields of works the can work anywhere outside the typical workplace. A modern-day working environment has been changing from functional-based work to a project-based or collaborative task. Therefore, employees do not need to stay at the office to work anymore. In such situation, autonomy is considered as a factor relating to teleworking work environment. Autonomy at work can promote a freedom to each employee to design their own work role or even a work schedule. To be free is considered as the most basic need of every human. Therefore, the coming of this new work practice can possibly promote satisfaction at their work. The more employee feels satisfy in their role and job, the less probability that these workforces will leave an organization (Gajendran & Harrison, 2007). Hence, this phenomenon pays off an organization investment in human capital and retains high performance workforces to stay within an organization even longer. Moreover, by promoting autonomy in modern day teleworking context, this can mitigate a risk of intention to turnover due to a dissatisfaction at work.
Teleworking is the new mean of work practice in the modern working world owing to the coming of digital transformation era. Presently, there are many jobs in various industries that apply this concept to their work practice. For instance, in real estate industry, realty sales professionals and agents are now on mobile work and these employees mostly stay outside their typical workplace to engage prospect client and consult their managers via teleconference. Medical representatives in health care industry always travel to various hospital to engage their target clients in various hospitals and contact their coworkers on mobile messaging application. Financial auditors and management consultants in business professional service industry are always at their client offices to provide professional service and send their work product to their managers at the office by email. Government representatives and some military officers in public sector often travel to various place to provide a government service in various region country wide and report the work progress to their managers by online conference application. According to many examples provide aforementioned, this new work practice is vastly applied in many industries among the country and considered as a new normal work practice.
There are many academical researches that focus on measurement scales relating to autonomy, career satisfaction and job satisfaction. Yet, there are a few studies that mostly emphasize on the measurement of these factors among different private organization and public sector group in a modern teleworking environment. In accordance with those reasons mentioned before, this study aims to answer the question: Do measurement scales of autonomy, career satisfaction and job satisfaction measure a level of autonomy, career satisfaction and job satisfactory differently among private organization employee and public sector employee in a teleworking environment? Therefore, the objective of the study is to test the measurement invariance of autonomy, career satisfaction and job satisfaction scales among private and public group of employees in a teleworking context.
LITERATURE REVIEW AND HYPOTHESES DEVELOPMENT
The test of measurement invariance among groups
The test of measurement invariance among groups are the specific test of identical psychometric properties under different context among group. For instance, a use of the same scale measuring certain properties under different group or contexts namely culture, gender, position or control and experiment group (Johnson & Braddy, 2008). In social science research, test of measurement invariance is suitable for answering many research questions now that this test could investigate measurement invariance of various components across different groups such as sociotropy and autonomy factors across gender (Hong, Malik, and Lee, 2003), autonomy support scale across cultures (Hagger et al., 2007), work place mentoring across countries (Hu, Pellegrini, and Scandura, 2010) and job satisfaction factor among jobs (Etchegaray & Sexton, 2010).
Presently, several social scientists have recognized an important of measurement invariance analysis as this can lead to a question that can each response in rating scale be interpreted the same way when this scale is applied to different contexts of samples? Therefore, the test of measurement invariance can be utilized to test if the same measurement scale can be used in different contexts invariantly.
According to Milfont and Fischer (2010), the test of measurement invariance can be accomplished by using multi-group confirmatory factor analysis. This analysis consists of 4 steps and, upon each step, constrains are added to the model for testing an invariance. As per figure 1, the four steps include as follow. First, configural invariance model examining that both groups are structurally the same. If this model is fitted then move to next step. Second, metric invariance model is analyzed. In this model, measurement structure and factor loadings will be equally constrained among group. If this model is still invariant. Then a scalar invariance will be analyzed. In this model, measurement structure, factor loadings and intercepts will be equally constrained among group. If this model is still invariant. Then a strict invariance will be analyzed. In this model, measurement structure, factor loadings, intercepts and residuals will be equally constrained among group. And finally, a latent means invariance will be put into an analysis. Invariance of latent factor means is tested by constraining the means to be the same among groups.
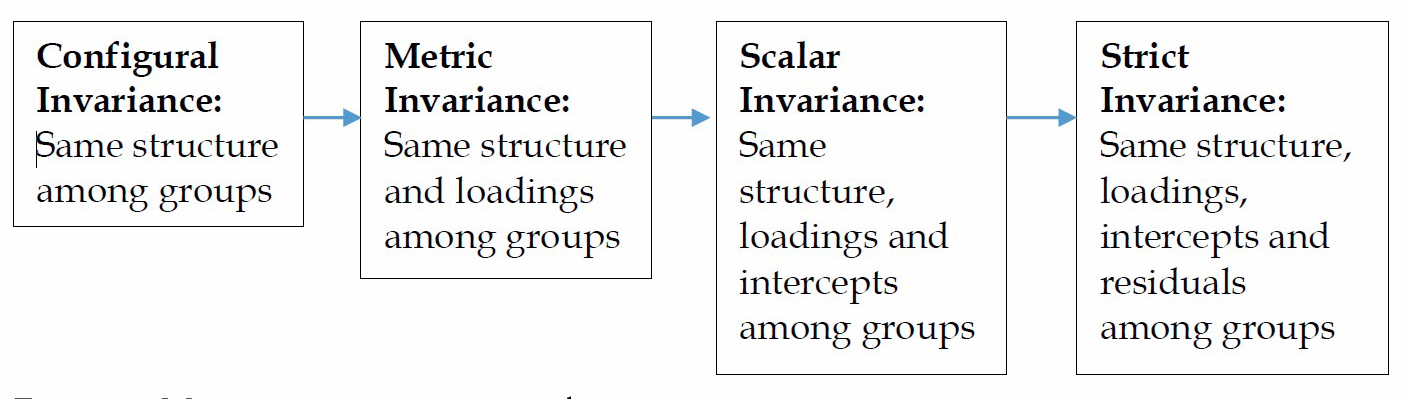
Figure 1. Measurement invariance analysis process.
To check whether each step is invariance, Chen (2007) has suggested that in order to determine model invariance in each step, delta RMSEA or delta CFI should be put into a consideration. If delta CFI is not different more than 0.010 and delta RMSEA is not different more than 0.015 compared to previous constrained model, a measurement invariance can be expected.
Autonomy
According to self-determination theory (Ryan & Deci, 2000), autonomy is a form of freedom at work that can help promote employee to make decision, design way of work and practice on their own. This can also be linked to a hierarchy of need as need for autonomy, need of competence and need for relatedness are the component of cognitive evaluation theory. There are several recent published academic manuscripts studying on effect of autonomy in job satisfaction as this factor yields several positive results on any organization (Narayanan, Menon, and Plaisent, 2017). Autonomy can help increase in work efficiency since employee can perceive a reliability from their management. This perception leads to an intrinsic motivation and results in a positive performance at work (Narayanan et al., 2017).
Career satisfaction and job satisfaction
Generally, job satisfaction was portrayed as psychological and physical satisfaction of workers at work. This factor is quite self-explanatory. In other studies, this was described as a recognition of a work value in an individuals’ mind resulting in a pleasurable and satisfactory emotional state. Job satisfaction is an important construct in many work practices as it is positively correlated to each employee well-being mentally and physically (Inauen, Jenny, and Bauer, 2015). Furthermore, career satisfaction has a broader definition as it is an overall satisfaction that related to their professional entitlement. For instance, if an employee works as a representative, he can feel satisfied to what he has done as a representative not just a job itself but the overall assignment relating to this title. Previous studies also indicated that career satisfaction was predicted by work-personal life enrichment (Rastogi, Karatepe, and Mehmetoglu, 2019). According to the review of related literature stated above, it can be seen that autonomy, career satisfaction and job satisfaction is correlated. Thereby, it could be hypothesized that measurement instrument for autonomy, career satisfaction and job satisfaction are invariant among private organization employees and public sector employees in teleworking context.
METHODOLOGY
This research is considered as a social science survey with a quantitative methodology. Population of the study is an employee that assigned to work outside office, including salesperson and other teleworking jobs. Then samples were divided into 2 groups of workplace, private organization and public sector. A convenience sampling method was utilized. Self-administered 500 survey questionnaires were distributed and this was classified into 3 parts, autonomy, career satisfaction, job satisfaction and demographic information. After cleaning noisy data, detecting outlier, imputating missing value and eliminating duplicated information, only 420 samples were qualified for the statistical analysis consisting of 208 samples of private organization employees and 212 public sector employees. Due to the nature of sample, both online soft copy and offline hard copy questionnaires were distributed by the researcher. Inclusion criteria and scope for the respondents was that the target sample should be any employees in any level and job title that typically worked outside the office across Thailand regardless of industry type such as sales professionals, medical representatives, real estate agents, government representatives, law enforcement agents, military representatives, financial auditors, management consultants and any other teleworking professionals that were always assigned to work outside their typical workplace. The questionnaires were managed as per actual social context, tradition and local Thai culture. Therefore, all the measurements were translated and back-translated from English to Thai.
For the measurements, Autonomy was 5 items scale by Anja Van Dec Broeck (Van den Broeck et al., 2010) to measure a level of autonomy. Career satisfaction was 5 items scale by Greenhaus (Greenhaus, Parasuraman, and Wormley, 1990) to measure career satisfaction. Job satisfaction was rated with a reduced version of Minnesota Satisfaction Questionnaire (MSQ) (Weiss, Dawis, and England, 1967) to measure overall job satisfaction in work.
For the data analysis, the qualified data of 420 samples were put into an analysis by using multigroup confirmatory factor analysis approach or the test of measurement invariance to test research hypotheses. The main purpose behind the utilization of this statistical technique was that it provides for testing multiple group invariance of latent variables. According to the objective of the study, firstly, basic descriptive and inferential statistics of each scales was calculated to determine overall snap-shot of the data and assumption requirement such as normality and correlation. Secondly, multiple group confirmatory factor analysis will be analyzed to hypothesize the study. The analysis process from data preprocessing to structural multiple group confirmatory factor analysis and data visualization was totally conducted by R, a powerful yet free statistical computer language (R Core Team, 2019).
RESULTS
Regarding a data analysis, the results were separated into 2 sections comprising of descriptive statistics and inferential statistics. Cleansed and screened 420 samples were input into the statistical analysis. For the descriptive part, most of the sample are female (56.9%), holding above bachelor degree (55.2%), working in operational level position (59.5%) and being single (63.8%). Half of the samples are currently working in public sector (50.5%). Mean age of the sample was 37.22 years with standard deviation of 11.27 years, average work experience was 13.84 years with standard deviation of 11.07 years.
According to Table 1, descriptive statistics for scales was described including means and standard deviation. In almost every inferential statistic methodology, normality of variables should be met. Skewness and kurtosis of each variables should not exceed plus or minus 2. Moreover, correlation among factors were all statistically significant with overall medium level of correlation except for career satisfaction and job satisfaction that were highly correlated. Normality could be expected as skewness and kurtosis of each scale was in range of plus or minus 2. Moreover, in accordance with Table 2, student’s t-test with equal variance was calculated and found that only career satisfaction was not significant among private and public workers group. This implied that no matter where the workplace these employees were in, a level of career satisfaction was still the same.
Table 1. Descriptive statistics for scale, skewness, kurtosis and correlation matrix.
|
Scale |
N |
M |
SD |
Skew |
Kur |
ANM |
CRS |
JST |
|
ANM |
420 |
3.31 |
0.94 |
-0.31 |
-0.45 |
1 |
0.45*** |
0.47*** |
|
CRS |
420 |
3.62 |
0.82 |
-0.69 |
1.17 |
0.45*** |
1 |
0.74*** |
|
JST |
420 |
3.59 |
0.86 |
-0.62 |
-0.62 |
0.47*** |
0.74*** |
1 |
Note: *** significant at p < 0.00 and ANM = Autonomy, CRS = Career Satisfaction, JST = Job Satisfaction
Table 2. Test of mean differences.
|
Group |
Private (N=208) |
Public (N=212) |
Student’s t-test |
||
|
scale |
M |
SD |
M |
SD |
|
|
Autonomy |
3.41 |
0.98 |
3.22 |
0.90 |
2.07* |
|
Career Satisfaction |
3.56 |
0.81 |
3.68 |
0.83 |
-1.45 |
|
Job Satisfaction |
3.50 |
0.88 |
3.69 |
0.84 |
-2.35* |
Note: * significant at p < 0.05
So as to check the model fitness with the empirical data. The confirmatory factor analysis of overall model was analysed. This included a structural validation of the model on each latent variable to investigate the relationship among observed variables by using correlation. The several presumptions of both absolute fit and relative fit indices criterion and model fit statistics were described in Table 3. According to measurement model fit indices, the model was considered moderately fit with empirical data as almost all fit indices were satisfied with the criteria except Chi-square test seeing that this index was generally sensitive to large sample size. Therefore, no model modification was required in this analysis.
Table 3. Fit indices criterion and measurement model fit statistic and criterion.
|
Fit indices |
Fit stats |
Criterion |
|
Chi-square |
261.22*** |
Not significant |
|
Relative Chi-square |
3.00 |
Less than 5 |
|
Comparative Fit Index (CFI) |
0.945 |
More than .90 |
|
Tucker-Lewis Index (TLI) |
0.937 |
More than .90 |
|
Root Mean Square Error of Approximation (RMSEA) |
0.069 |
Less than .08 |
|
Standardized Root Mean Square Residual (SRMR) |
0.043 |
Less than .08 |
|
Source: Hair et al. (2013), Bagozzi & Yi (1988), Browne & Cudeck (1993) |
||
Note: *** significant at p < 0.00
In accordance with Table 4, overall model of confirmatory factor analysis estimated and standard coefficients, the reliability coefficient of Cronbach’s Alpha, composite reliability, convergent validity and discriminant validity were showed. All coefficients were statistically significant. Cronbach’s Alpha was used to estimate the reliability of internal consistency among questionnaire rating scale and it was found that all parts of the questionnaire were considered reliable. Composite reliability score was also calculated to check measurement reliability. Both standard minimum threshold for Cronbach’s Alpha and composite reliability was 0.7 or higher to indicate a suitable reliability.
Convergent validity means the extent to which manifest variables of a construct converged or shared a high level of proportion of variance in common (Hair, Black, Babin, and Anderson, 2013). Convergent validity could be analysed via factor loadings and average variance extracted (AVE). Standard minimum cut off for average variance extracted was 0.5 or higher indicating adequacy of convergence.
Discriminant validity refers to the extent to which indicators of a construct is distinctively discriminating from other constructs. The criteria were that the AVE should be greater than Maximum Shared Variance (MSV) and Average Shared Variance (ASV) to ensure adequacy of divergence (Fornell & Larcker, 1981).
It could be found that the scales in the model had a high internal consistency reliability according to Cronbach’s Alpha higher than 0.7 and according to Composite Reliability the model was considered reliable. Furthermore, Average Variance Extracted, Maximum Shared Variance and Average Shared Variance portrayed a model with validity, convergently and divergently.
Table 4. Confirmatory factor analysis, reliability and validity.
|
Construct |
Estimate |
Standard |
SE |
Z |
Alpha |
CR |
AVE |
MSV |
ASV |
|
ANM |
|
|
|
|
0.89 |
0.89 |
0.63 |
0.26 |
0.39 |
|
ANM1 |
1.00 |
0.75 |
|
|
|
|
|
|
|
|
ANM2 |
1.11 |
0.84 |
0.05 |
20.53 |
|
|
|
|
|
|
ANM3 |
1.09 |
0.82 |
0.06 |
17.51 |
|
|
|
|
|
|
ANM4 |
1.06 |
0.76 |
0.07 |
14.00 |
|
|
|
|
|
|
ANM5 |
1.10 |
0.80 |
0.07 |
14.99 |
|
|
|
|
|
|
CRS |
|
|
|
|
0.89 |
0.89 |
0.64 |
0.64 |
0.45 |
|
CRS1 |
1.00 |
0.80 |
|
|
|
|
|
|
|
|
CRS2 |
1.05 |
0.84 |
0.04 |
25.80 |
|
|
|
|
|
|
CRS3 |
1.06 |
0.80 |
0.04 |
16.34 |
|
|
|
|
|
|
CRS4 |
1.00 |
0.78 |
0.06 |
14.71 |
|
|
|
|
|
|
CRS5 |
0.94 |
0.76 |
0.05 |
17.93 |
|
|
|
|
|
|
JST |
|
|
|
|
0.91 |
0.91 |
0.68 |
0.64 |
0.45 |
|
JST1 |
1.00 |
0.80 |
|
|
|
|
|
|
|
|
JST2 |
1.06 |
0.88 |
0.04 |
22.76 |
|
|
|
|
|
|
JST3 |
0.79 |
0.66 |
0.06 |
11.55 |
|
|
|
|
|
|
JST4 |
1.12 |
0.90 |
0.05 |
21.13 |
|
|
|
|
|
|
JST5 |
1.08 |
0.85 |
0.05 |
19.03 |
|
|
|
|
|
The very first step of measurement invariance analysis was to analyze a configural model. This type of model was assumed that both groups had the same measurement structure but factor loadings, intercepts or means, residuals or errors could still be different. If this model was not fitted with empirical data, this could conclude that both groups were not invariance at the first place and further analysis for invariance measurement should not be analyzed.
According to Table 5, the measurements of autonomy, career satisfaction and job satisfaction from both groups were fitted with empirical data. Both private organization employee group and public sector employee group had exactly the same model fit statistics. That were Chi-squared of 261.224 with 87 degree of freedom and CFI was 0.945 and TLI was 0.933. Moreover, a significant RMSEA was 0.069 with 90 percent confidence interval from 0.061 to 0.077 and SRMR was 0.40.
Table 5. Configural measurement invariance model fit indices.
|
Fit indices |
Private |
Public |
|
Chi-square |
261.22*** |
261.22*** |
|
Relative Chi-square |
3.00 |
3.00 |
|
Comparative Fit Index (CFI) |
0.945 |
0.945 |
|
Tucker-Lewis Index (TLI) |
0.933 |
0.933 |
|
Root Mean Square Error of Approximation (RMSEA) |
0.069 |
0.069 |
|
Standardized Root Mean Square Residual (SRMR) |
0.040 |
0.040 |
Note: *** significant at p< 0.00
Refer to Table 6 which portrayed results of configural measurement invariance model, the first step of the analysis, divided by private and public group, standardized factor loadings were all significant and coefficient of determination yield a moderately high value for both groups. By considering composite reliability and average variance extracted from both groups, it could be implied that both groups were considerably reliable and valid convergently and discriminately as those values were exactly the same across groups.
Table 6. Configural measurement invariance model, reliability and validity.
|
Construct |
Standard loadings |
Coefficient of determination |
Composite reliability |
Average variance extracted |
||||
|
Group |
Private |
Public |
Private |
Public |
Private |
Public |
Private |
Public |
|
ANM |
|
|
|
|
0.89 |
0.89 |
0.63 |
0.63 |
|
ANM1 |
0.75 |
0.75 |
0.56 |
0.56 |
|
|
|
|
|
ANM2 |
0.84 |
0.84 |
0.71 |
0.71 |
|
|
|
|
|
ANM3 |
0.82 |
0.82 |
0.68 |
0.68 |
|
|
|
|
|
ANM4 |
0.76 |
0.76 |
0.58 |
0.58 |
|
|
|
|
|
ANM5 |
0.80 |
0.80 |
0.64 |
0.64 |
|
|
|
|
|
CRS |
|
|
|
|
0.89 |
0.89 |
0.64 |
0.64 |
|
CRS1 |
0.80 |
0.80 |
0.64 |
0.64 |
|
|
|
|
|
CRS2 |
0.84 |
0.84 |
0.72 |
0.72 |
|
|
|
|
|
CRS3 |
0.80 |
0.80 |
0.64 |
0.64 |
|
|
|
|
|
CRS4 |
0.78 |
0.78 |
0.61 |
0.61 |
|
|
|
|
|
CRS5 |
0.76 |
0.76 |
0.59 |
0.59 |
|
|
|
|
|
JST |
|
|
|
|
0.91 |
0.91 |
0.68 |
0.68 |
|
JST1 |
0.80 |
0.80 |
0.64 |
0.64 |
|
|
|
|
|
JST2 |
0.88 |
0.88 |
0.77 |
0.77 |
|
|
|
|
|
JST3 |
0.66 |
0.66 |
0.44 |
0.44 |
|
|
|
|
|
JST4 |
0.90 |
0.90 |
0.81 |
0.81 |
|
|
|
|
|
JST5 |
0.85 |
0.85 |
0.72 |
0.72 |
|
|
|
|
Ultimately, in accordance with Table 7 and Figure 2, measurement invariance analysis of chi-square, degree of freedom RMSEA, delta RMSEA, CFI and delta CFI were described. This is the second step, third step and fourth step of the analysis which were metric invariance, scalar invariance and strict invariance. According to the invariance analysis model fit statistics, this could be concluded that the measurement model could equally describe both private organization employee group and public sector organization group seeing that delta RMSEA from each constraining steps was not exceed 0.015 and delta CFI from each constrains steps was not exceed 0.010, according to Chen (2007) and Cheung and Rensvold (Cheung & Rensvold, 2002)
Table 7. Measurement invariance analysis, chi-squared different and fit measures.
|
Invariance model |
χ2 |
Δ χ2 |
df |
Δ df |
RMSEA |
Δ RMSEA |
CFI |
Δ CFI |
|
Configural |
468.25 |
- |
174 |
- |
0.090 |
- |
0.936 |
- |
|
Metric (loadings) |
484.53 |
16.28 |
186 |
12 |
0.087 |
0.003 |
0.935 |
0.001 |
|
Scalar (intercepts) |
515.44 |
30.90 |
198 |
12 |
0.087 |
0.000 |
0.931 |
0.004 |
|
Strict (residuals) |
557.97 |
42.53 |
213 |
15 |
0.088 |
0.001 |
0.925 |
0.006 |
|
Latent means |
577.60 |
19.63 |
216 |
3 |
0.089 |
0.001 |
0.921 |
0.004 |
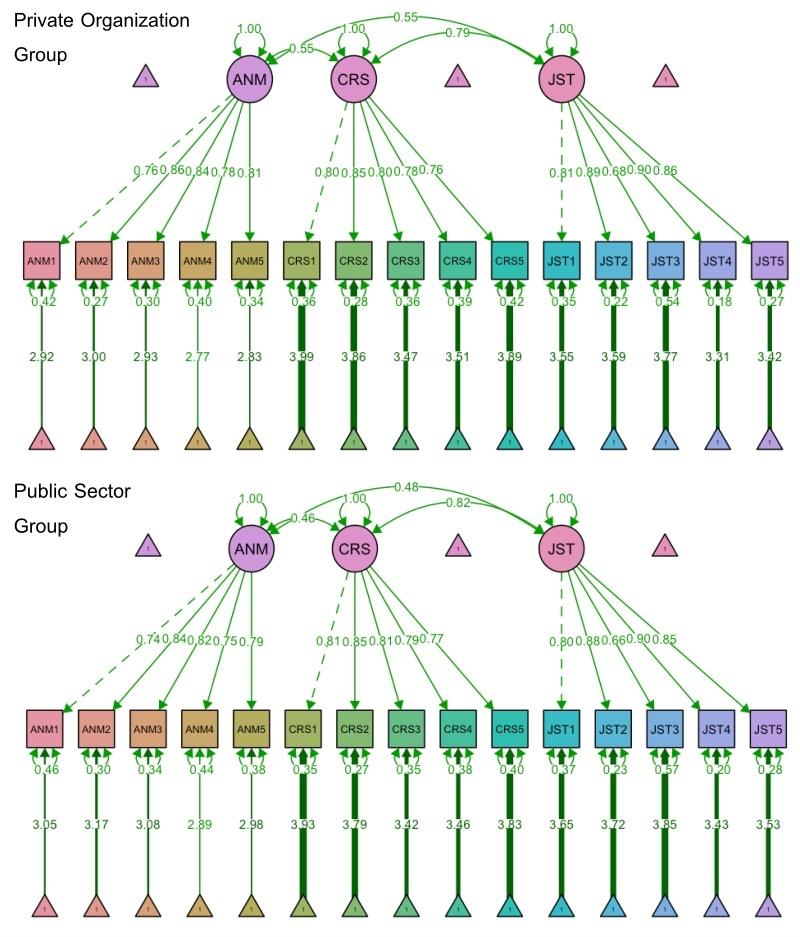
Figure 2. Latent means invariance model (constrained means) among groups.
DISCUSSION
As mentioned earlier, the main objective of the study is to test the measurement invariance of autonomy, career satisfaction and job satisfaction scales among private and public group of employees in a teleworking context and this research was set to answer a question: Do measurement scales of autonomy, career satisfaction and job satisfaction measure a level of autonomy, career satisfaction and job satisfactory differently among private organization employee and public sector employee in a teleworking environment? As per analysis result, the objective was achieved and the study result also revealed that measurement scales of autonomy, career satisfaction and job satisfaction measured a level of autonomy, career satisfaction and job satisfaction invariantly among private organization employee group and public sector employee group.
The process of testing invariance across group in this study was analyzed according to a suggested work from Milfont and Fischer (2010). A configural invariance model was the starting point of the analysis process as the measurement model structures were constrained to be the same. Then metric invariance was put into an analysis by constraining measurement structure and factor loadings of both measurement model to be the same. The next process was scalar invariance constrained measurement structure, factor loadings and intercepts to be the same. Last but not least, strict invariance constrained measurement structure, factor loadings, intercepts and residuals to be the same. Finally, latent means invariance was analyzed by constraining latent means to be the same. According to the five steps of the invariance models analysis, it could be found that the measurement model was still invariant even in the strictest model. This implied that observed or manifest scores had a relationship with latent scores and then resulting in a meaningful interpretation of measurement model across two groups. The result found in this study was consistent with prior research of measurement invariance and structural model from Sardžoska (Sardžoska & Tang, 2009). For the satisfaction scale, this study was also consistent with previous study from Spurk, Abele and Volmer (2015) in the context of the measurement invariance of career satisfaction. This implied that both groups shared the same perception toward these rating scales. As per result, autonomy, career satisfaction and job satisfaction scale were still suitable for measuring a level of autonomy, career and job satisfaction regardless of the group of private organziation or public sector employee. This indicated that, even in a modern teleworking context nowadays, an element of autonomy and satisfaction were still measurable. Therefore, an organization, regardless of the type of the organization, private or public, could still measure a level of autonomy, career satisfaction and job satisfaction by using these traditional rating scale.
Even this study emphasized on the teleworking professional in a modern working context and digital transformation climate, there were several limitations in this study. Firstly, this study only tested for the measurement invariance among group. Future study could possibly extent the result of this study by further analyze on the multi-group structural equation model to test an invariance causal relationship and indirect effect among group by utilizing these measurements. Secondly, the sample used in the study consisted of employees that always worked outside an office. Therefore, the extent and level of invariance measurement might differ in other type of employees. Hence, future study should focus on a broader spectrum of employee type to generalization the result to more general context.
REFERENCES
Bagozzi, R.P., & Yi Y. (1988). On the evaluation of structural equation model. Journal of Academy of Marketing Science, 16 (1), 74-94.
Bollen, K.A., & Long, J.S. (1993). Testing structural equation models (Vol. 154). Newbury Park: Sage.
Browne, M.W., & Cudeck, R. (1993). Alternative ways of assessing model fit. In: Bollen, K.A., Long, J.S. (Eds.),Testing structural equation models (pp.111-135). Beverly Hills: Sage.
Chen, F.F. (2007). Sensitivity of goodness of fit indexes to lack of measurement invariance. Structural Equation Modeling, 14(3), 464–504. https://doi.org/10.1080/10705510701301834
Cheung, G.W., & Rensvold, R.B. (2002). Evaluating goodness-of-fit indexes for testing measurement invariance. Structural Equation Modeling. 9(2), 233–255. https://doi.org/10.1207/S153280007SEM0902_5
Fornell, C., & Larcker, D. (1981). Evaluating structural equation models with unobserved variable and measurement error. Journal of Marketing Research, 18(1), 39-50. https://doi.org/10.2307/3151312
Etchegaray, J.M., Sexton, J.B., Helmreich, R.L., & Thomas, E.J. (2010). Job satisfaction ratings: measurement equivalence across nurses and physicians. Western Journal of Nursing Research, 32(4), 530-539. https://doi.org/10.1177/0193945909355148
Gajendran, R.S., & Harrison, D.A. (2007). The good, the bad, and the unknown about telecommuting: meta-analysis of psychological mediators and individual consequences. Journal of Applied Psychology, 92(6),1524-1541. https://doi.org/10.1037/0021-9010.92.6. 1524
Greenhaus, J.H., Parasuraman, S., & Wormley, W.M. (1990). Effects of race on organizational experiences, job performance evaluations, and career outcomes. Academy of Management Journal, 33(1), 64–86. https://doi.org/10.2307/256352
Hagger, M.S., Chatzisarantis, N.L.D., Hein, V., Pihu, M., Soo´s, I.S., & Karsai, I. (2007). The perceived autonomy support scale for exercise settings (PASSES): development, validity, and cross-cultural invariance in young people. Psychology of Sport and Exercise, 8(5), 632–653. https://doi.org/10.1016/j.psychsport.2006.09.001
Hair, J.F., Black, W.C., Babin, B.J., Anderson, R.E., & Tatham, R.L. (2013). Multivariate data analysis. Upper Saddle River, NJ: Prentice hall.
Hong, S., Malik, M.L., & Lee, M.K. (2003). Testing configural, metric, scalar, and latent mean invariance across genders in sociotropy and autonomy using a non-Western sample. Educational and Psychological Measurement, 63(4), 636-654. https://doi.org/10.1177/0013164403251332
Hu, C., Pellegrini, E.K., & Scandura, T.A. (2011). Measurement invariance in mentoring research: A cross-cultural examination across Taiwan and the US. Journal of Vocational Behavior, 78(2), 274-282. https://doi.org/10.1016/j.jvb.2010.10.003
Inauen, A., Jenny, G.J., & Bauer, G.F. (2015). Discriminating five forms of job satisfaction: investigating their relevance for occupational health research and practice. Psychology, 6(02), 138–150. https://doi.org/10.4236/psych.2015.62013
L. Milfont, T., & Fischer, R. (2010). Testing measurement invariance across groups: applications in cross-cultural research. International Journal of Psychological Research, 3(1), 111. https://doi.org/10.21500/20112084.857
Narayanan, L., Menon, S., Plaisent, M., & Bernard, P. (2017). Telecommuting: the work anywhere, anyplace, anytime organization in the 21st century. Journal of Marketing and Management, 8(2), 47-54.
Rastogi, M., Karatepe, O.M., & Mehmetoglu, M. (2019). Linking resources to career satisfaction through work–family enrichment. The Service Industries Journal, 39(11–12), 855-876. https://doi.org/10.1080/02642069.2018.1449835
Ryan, R.M., & Deci, E.L. (2000). Intrinsic and extrinsic motivations: classic definitions and new directions. Contemporary Educational Psychology, 25, 54–67. https://doi.org/10.1006/ceps.1999.1020
Spurk, D., Abele, A.E., & Volmer, J. (2015). The career satisfaction scale in context: a test for measurement invariance across four occupational groups. Journal of Career Assessment, 23(2), 191–209. https://doi.org/10.1177/1069072714535019
R Core Team (2019). R: A language and environment for statistical computing.. R Foundation for Statistical Computing, Vienna, Austria. Retrieved from http://www. R-project. org/
Van den Broeck, A., Vansteenkiste, M., De Witte, H., Soenens, B., & Lens, W. (2010). Capturing autonomy, competence, and relatedness at work: construction and initial validation of the work‐related basic need satisfaction scale. Journal of Occupational and Organizational Psychology, 83(4), 981–10020.1348/. https://doi.org/1096317909X481382
Weiss, D.J., Dawis, R.V, & England, G.W. (1967). Manual for the minnesota satisfaction questionnaire. Minnesota Studies in Vocational Rehabilitation, 22, 120.