 ISSN: 2822-0838 Online

Alteration of Drug-Resistant Proteins in ESBL-Producing Escherichia coli After Induction with Cefoxitin Using MALDI-TOF Technique
Kamonlapob Boonrugsa, Kate Norkham, Siravit Chotimanon, Khetdan Panyadej, Rath Rerkasem, Pitchaya Singhavesjsakul, Ratchanee Somnabut, Thanapat Sastraruji, and Siriwoot Sookkhee*Published Date : July 10, 2023
DOI : https://doi.org/10.12982/NLSC.2023.036
Journal Issues : Number 3, July-September 2023
Abstract This study aimed to solve the diagnostic problem of AmpC enzyme production from ESBL production of community-acquired urinary tract-infected Escherichia coli from Maharaj Nakorn Chiang Mai Hospital in 2019-2020 by using the MALDI-TOF technique to search for the significant difference between the ceftazidime exposure alone and the concomitance of ESBL inhibitor, clavulanic acid, and AmpC inducer, cefoxitin. Among 254 E. coli isolates, 42.12% (n = 107) were categorized as high-ESBL producers after determined by E-strip test. The frequencies of six peaks, 2689 (88.19%), 3126 (90.55%), 6314 (91.73%), 6411 (88.98%), 7157 (90.55%), 10301 (85.09%) Da were suspected to be the E. coli specific peptide spectra. In the high-ESBL-producing group, three statistically significant peptide spectra which played an ESBL manner were only identified at 4613 (13.33%, P = 0.008), 5613 (11.67%, P = 0.018), and 9713 (55.00%, P < 0.001) Da. Three peptide spectra that acted in AmpC β-lactamase manner were statistically significant at 4184 (16.67%, P = 0.048), 9551 (10.00%, P = 0.021), and 10477 Da (38.33%, P = 0.006) in this group. Whereas the statistically significant peptide spectra which played as AmpC were identified at 5380 (80.00%, P = 0.005) and 6254 Da (66.67%, P = 0.016) in the non ESBL-producing group. Our results indicated that AmpC enzyme-related spectra could be detected in some high-ESBL and non ESBL-producing isolates after being induced by cefoxitin.
Keywords: AmpC, MALDI-TOF, Cefoxitin, ESBL-producing E. coli, Drug resistance protein
Funding: This work was supported by the Faculty of Medicine, Chiang Mai University, Grant No. 2-2565.
Citation: Boonrugsa, K., Norkham, K., Chotimanon, S., Panyadej, K., Rerkasem, R., Singhavesjsakul, P., Somnabut, R., Sastraruji, T., and Sookkhee, S. 2023. Alteration of drug-resistant proteins in ESBL-producing Escherichia coli after induction with cefoxitin using MALDI-TOF technique. Natural and Life Sciences Communications. 22(3): e2023036.
INTRODUCTION
Approximately 40% of the female population worldwide experiences urinary tract infections at least once in their lifetime (Medina et al., 2019). Most urinary tract infections are caused by Uropathogenic Escherichia coli (UPEC) infection (Matsukawa et al., 2019), accounting for 85 percent of hospital-acquired infections and 50 percent of community-acquired infections (Lee et al., 2018). Two major β-lactamase produced by UPEC are Extended Spectrum β-Lactamase (ESBL) and AmpC β-lactamase (Hordijk et al., 2013).
Moreover, reports confirmed that ESBL can be coproduced with AmpC β-lactamase (Pumeesat et al., 2015). ESBL can be inhibited by clavulanic acid. However, AmpC β-lactamase production in Gram-negative bacteria is invulnerable to clavulanic acid. Cefoxitin, second generation cephalosporins, can induce the hyperproduction of AmpC β-lactamase (Harris, 2015). In the study population, 42.5%, 5.3%, 1.8% produced ESBL alone, AmpC β-lactamase alone, and both ESBL and AmpC β-lactamase, respectively (Pumeesat P et al., 2015). Therefore, the identification of β-lactamase producing UPEC is extremely important to choose the proper management to prevent the development of drug-resistance organisms and to achieve the most effective treatment.
Currently, the MALDI-TOF (Matrix-Assisted Laser Desorption Ionization–Time of Flight) technique has been used to identify drug-resistant strains and the size of the bacterial protein through quantitative analysis. The advantages of the MALDI-TOF technique are its high specificity, and more precise and rapid diagnosis of significant proteins, which play an important role in drug resistance mechanisms (Vrioni et al., 2018). Laboratory technicians can apply the MALDI-TOF technique to minimize the number of time-consuming procedures for detecting the bacterial species and significant proteins involved in drug resistance. With the basis of this technique, patients can be treated with smart and proper antibiotics.
This study aimed to determine the alteration of drug-resistant protein found in ESBL-producing E. coli, comparing between before and after induction with cefoxitin utilizing the MALDI-TOF technique. The results were then statistically analyzed, to identify the proteins which were responsible for the drug resistance mechanism. We hope that information obtained from this work will be useful for physicians in providing patients with proper antibiotic treatment.
MATERIALS AND METHODS
Escherichia coli isolates
Two hundred and fifty-four E. coli isolates collected from bacteriuria specimens of patients at the Outpatient Department of Maharaj Nakorn Chiang Mai Hospital were carried out as bacterial population. These isolates were provided from the diagnostic laboratory section, Maharaj Nakorn Chiang Mai Hospital in 2019-2020 (Diagnostic laboratory unit, 2021). These isolates were stored in the -80°C freezer under the responsibility of Assist. Prof. Dr. Siriwoot Sookkhee at the Department of Microbiology, Faculty of Medicine, Chiang Mai University. This research study was approved by the Institutional Biosafety Committee of the Faculty of Medicine, Chiang Mai University.
The tested isolates were removed from the freezer and inoculated into Tryptic Soy Broth (TSB; Oxoid, Basingstoke, Hampshire, United Kingdom) and then incubated at 37°C for 18-24 hours. Biochemical identifications were performed to confirm E. coli. The bacteria can ferment glucose, lactose, and sucrose, turning TSI agar to yellow color and generating gas in anaerobic conditions (A/AG). Additional biochemical tests including motility test, catalase test, Methyl Red and Voges Proskauer assay, urease test, and citrate utilization test were then performed. E. coli, it was inoculated in Tryptic Soy Broth (TSB) for storage at 37°C for 18-24 hours before being supplemented with 20% glycerol and kept at -80°C until further use. E. coli ATCC25922 (Culti-LoopTM Escherichia coliTM 25922TM; Oxoid, Basingstoke, Hampshire, United Kingdom) was used as the standard reference strain.
Antibiotic susceptibility of E. coli
Antimicrobial susceptibility tests, based on Kirby-Bauer's method using Mueller-Hinton agar (MHA; Oxoid, Basingstoke, Hampshire, United Kingdom) according to the 30th ed. Performance standards of antimicrobial susceptibility testing of Clinical Laboratory Standards Institute were performed (Clinical Laboratory Standards Institute, 2020). Each E. coli isolate was inoculated into Tryptic Soy Broth before being adjusted its turbidity to McFarland standard No. 0.5. The samples were swabbed thoroughly on the surface of the MHA plate. Thirteen antimicrobial discs (Oxoid, Basingstoke, Hampshire, United Kingdom), including ampicillin (AMP, 10 µg), amoxicillin-clavulanic acid (AMC, 20/10 µg), cefoxitin (FOX, 30 µg), ceftazidime (CAZ, 30 µg), cefotaxime (CTX, 30 µg), ciprofloxacin (CIP, 5 µg), tetracycline (TE, 30 µg), imipenem (IPM, 10 µg), piperacillin-tazobactam (TZP, 100/10 µg), gentamicin (CN, 10 µg), kanamycin (KA, 30 µg), meropenem (MEM, 10 µg) and doripenem (DOR, 10 µg), were placed on the agar, approximately 20 mm apart from each disc, and then incubated at 37°C for 18-24 hours. The diameter of the inhibition zone was measured and interpreted according to CLSI 2020 guidelines shown in Table 1. The isolate which was resistant to ≤ two antibiotics was categorized as a susceptible isolate. The isolate which was resistant to three antibiotics was categorized as an intermediate resistant isolate. The isolate which was resistant to ≥ four antibiotics was categorized as a resistant isolate (Magiorakos et al., 2012). E. coli ATCC 25922 was performed as the standard control. The antibiogram of each isolate was done, grouped, and determined the percent frequency.
Table 1. Interpretation of antibiotic susceptibility test (Clinical Laboratory Standards Institute, 2020).
|
Antibiotics |
Inhibition zone diameters (mm) |
|
|
Susceptible |
Resistant |
|
|
β - lactams |
|
|
|
AMP |
≤17 |
≥13 |
|
AMC |
≤21 |
≥17 |
|
FOX |
≤18 |
≥14 |
|
CAZ |
≤21 |
≥17 |
|
CTX |
≤26 |
≥22 |
|
IPM |
≤23 |
≥19 |
|
TZP |
≤21 |
≥17 |
|
DOR |
≤23 |
≥19 |
|
MEM |
≤23 |
≥19 |
|
Non β - lactams |
|
|
|
CIP |
≤31 |
≥20 |
|
TE |
≤15 |
≥11 |
|
CN |
≤15 |
≥12 |
|
KA |
≤18 |
≥13 |
ESBL determination of E. coli using DDST and E-strip test
The screening test for ESBL-producing E. coli was based on the Clinical and Laboratory Standards Institute (CLSI), known as the Double Disc Synergy test (DDST) (Drieux et al., 2008). A single colony of E. coli was resuspended into Mueller Hinton Broth (MHB). The turbidity was adjusted to McFarland standard No. 0.5. The samples were swabbed thoroughly on the surface of the MHA plate. Amoxicillin-clavulanic acid disc (AMC, 20/10 µg) were placed between the cefotaxime disc (CTX, 30 µg) and ceftazidime disc (CAZ, 30 µg) apart from 30 mm of each disc. Then, the agar was incubated at 37°C for 18-24 hours. The diameter of the inhibition zone was measured. The appearance of the clear zone and keyhole phenomenon were also determined after being tested with AMC. E. coli ATCC 25922 was used as the standard control.
After being screened with a double disc synergy test, ESBL production of resistant E. coli was determined by an E-strip test. ESBL-producing E. coli was resuspended into MHB broth. McFarland standard No. 0.5 of these cultures were prepared and then swabbed on MHA plate. The samples were swabbed thoroughly on the surface of the MHA plate. Then the E-test strip, coated with ceftazidime on one end and the other end coated with ceftazidime mixed with clavulanic acid, was held with forceps and placed on MHA. The ability of ESBL production of each tested resistant isolate was considered from its minimum inhibition concentration differences (MIC ratio) between CAZ and ceftazidime plus clavulanic acid (CAZ/Clav) at both ends. The production of ESBL was categorized into three groups, non-, low-, and high-ESBL producing E. coli according to the MIC ratio as described in the previous study (Singhavejsakul et al., 2022). This ratio of each isolate including MIC fold was lower than 8-folds, 8-250 folds, and higher than 250 folds, respectively.
Detection of AmpC β-lactamase production from E. coli
AmpC β-lactamase production from E. coli was determined by an antimicrobial disc test. The cultures which prepared as described above were grown on MHA plate. Three antibiotic discs such as CAZ, AMC, and FOX, were carried out. CAZ disc was placed at the adjacent side of AMC and FOX on the MHA plate before being incubated at 37°C for 18-24 hours. ESBL production was interpreted according to the increase in diameter of the inhibitory zone at the side of the AMC disc. AmpC β-lactamase production was detected according to the decrease in the diameter of the inhibitory zone at the side of the FOX disc (Black et al., 2005).
The second detection method for AmpC β-lactamase production from E. coli was performed by placing the tested antibiotic disc apart by 10 mm in distance from one another. CAZ disc was placed between the AMC and FOX discs apart from 10 mm. FOX disc was placed on the opposite side of the AMC disc. ESBL production was detected according to the increased in diameter of the inhibitory zone at the AMC disc side. AmpC β-lactamase production was detected according to the decrease in the diameter of the inhibitory zone at the side of FOX (Correa-Martínez et al., 2019). The presence of a D-shaped zone was interpreted as an inducible AmpC production of the bacteria on the adjacent side of ceftazidime. (Nogueira-Miranda Kda et al., 2012).
Positioning of antibiotic exposed area for proteomic analysis
The preparation of the samples for proteomic analysis was done by resuspending a single colony of E. coli into MHB. McFarland standard No. 0.5 of the tested isolates were done. The adjusted suspension was smeared approximately 3-4 lines on the MHA plate by using cotton swabs. Firstly, the CAZ disc was placed in the middle and the AMC disc was placed 20 mm inferior to the ceftazidime disc on the same vertical plane. Secondly, the FOX disc was placed on the lateral side 20 mm apart from the ceftazidime disc, as seen in Figure 1. Then, the agar was incubated at 37°C for 18-24 hours.
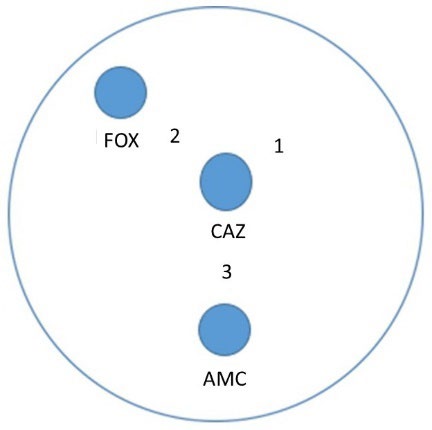
Figure 1. Antibiotic exposure of E. coli. Position 1, the collecting area of the colony after being exposed to CAZ. Position 2, the collecting area of the colony after being exposed to ceftazidime concomitantly with FOX. Position 3, the collecting area of the colony after being exposed to ceftazidime concomitantly with AMC.
Proteomic analysis of E. coli using the MALDI-TOF technique
A single colony of E. coli ATCC 8739, positive control, was applied to the calibration spots in each acquisition of the Vitek MS-DS target slide (bioMérieux™, Marcy l'Etoile, France). A single colony of tested E. coli was smeared onto each sample spot of the VITEK® MS-DS target slide. Then, 1 microliter of alpha-4-cyano-4-hydroxycinnamic acid (CHCA) matrix (bioMérieux™, Marcy l'Etoile, France) was dropped onto each calibration spot and each sample spot for forming the protein crystallization. VITEK® MS-DS target slide was air dried for 3-5 min before being taken into the VITEK® MS apparatus. The protein intensity obtained from VITEK® MS was analyzed via MYLA software (bioMérieux™, Marcy l'Etoile, France). E. coli specific species proteins, the peptide spectra that were detected in more than 80 percent of all tested isolates of E. coli. tested samples were analyzed. The ESBL peptide spectra were also identified by performing the statistical analysis. The higher average intensity obtained at position 1 of any significant peaks in high- or/and low- ESBL producers were suspected to be ESBL spectra due to the clavulanic acid can degrade the ESBL enzyme demonstrated as the reduction of intensity obtained at position 3.
AmpC β-lactamase peptide spectrum was also identified. FOX was carried out to induce AmpC β-lactamase hyperproduction in some E. coli due to the low-level AmpC β-lactamase expression or constitutionally expression makes it unable to be significantly detected with peptide spectrum analysis. The higher average of peptide spectrum intensity obtained at position 2 of any significant peaks in any ESBL groups was suspected to be AmpC spectra.
Statistical analysis
Among the high-, low-, and non- ESBL producers, the peptide spectrum intensity after the colony was exposed to CAZ alone, and CAZ concomitantly with AMC-exposed areas (shown as positions 1 and 3 in Figure 1, respectively) were analyzed. Differences in peptide spectrum intensity were considered statistical significance by performing the paired t-test at a P-value ≤ 0.05. For AmpC determination, the peptide spectrum intensity after the colony was exposed to CAZ alone, and CAZ concomitantly with FOX (shown as positions 1 and 2 in Figure 1) were also analyzed by performing the paired t-test at a P-value ≤ 0.05.
RESULTS
Antibiotic susceptibility
To differentiate the antimicrobial susceptibilities of 254 E. coli isolates, the agar disk diffusion was performed as described above. According to Figure 2, 7.87% (n=20), 12.59% (n = 32), and 79.52% (n = 202) of community-acquired isolates of urinary tract infected E. coli were susceptible to ≥ 11, 10, and ≤ 9 drugs and then classified into the susceptible, intermediate resistant, and resistant groups, respectively. Results revealed the resistant group to be the major group of this infection. The antibiotic susceptibility of each isolate should be considered for smart antibiotic use.
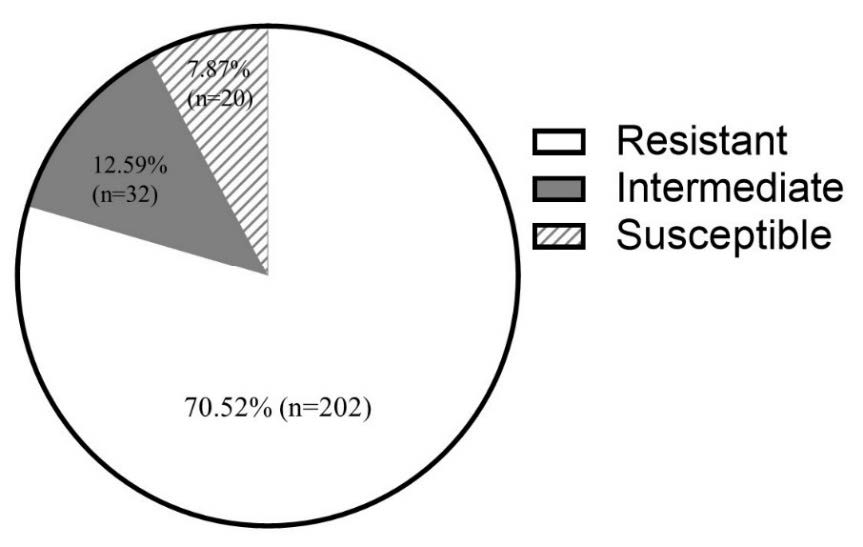
Figure 2. Frequency of E. coli in each group divided by antibiotic susceptibility.
From the antimicrobial susceptibilities of total isolates, the tested antibiotics could be categorized into β-lactam and non-β-lactam agents as shown in Table 1. For the susceptibility of non-β-lactam agents, most of all isolates were susceptible to CN and KA but were resistant to CIP and TE. Most of all resistant E. coli were resistant to β-lactam agents including PEN, FOX, CTX, CAZ, and AMC except for TZP, IPM, MEM, and DOR (Figure 3). Regarding the clinically appropriate use, if the resistant E. coli was reported, the consideration of antibiotic smart use should be careful due to its wide range of β-lactam resistance in the antimicrobial susceptibility test.
Results demonstrated the different prevalence of antibiotic susceptibility among the total isolates and the resistant isolates. Over 90% of the resistant E. coli were less susceptible to β-lactam agents except for three members of carbapenems, IPM, MEM, and DOR. However, the combination of β-lactamase inhibitor class A such as TZP also resulted in the susceptibility. It may be suggested that ESBL was the main mechanism of these resistant isolates towards β-lactams. Moreover, some isolates were not susceptible to AMC or TZP which is demonstrated in the details of antibiograms and their percentage in Table 2. Another mechanism of these isolates should be expressed for performing to resist these agents. AmpC enzyme was mentioned for these resistant, therefore, the identification of this enzyme was important to clarify the resistance. Agar disk diffusion method and the differentiation of this enzyme using the protein spectrum obtained from VITEK® MS analysis, the current proteomic analysis routinely used in the laboratory diagnosis of the hospital should be required.
Determination of ESBL production using E-test
Two hundred and two resistant isolates of E. coli that were classified in the resistant pattern were carried out for determining ESBL production by double disc synergy test and ESBL E-test. Among the isolates in the antibiotics-resistant group, 91% of isolates were resistant to ceftazidime and 61% of isolates exhibit the keyhole phenomenon after being tested by DDST assay.
Among the resistant group of tested E. coli, 15 isolates (7.42% of total resistant isolates) demonstrated the MIC ratio <8 folds and were classified as non-ESBL producers. These 80 isolates (39.60%) were also classified as low-ESBL producers due to their MIC ratio between 8-250 folds. One hundred and seven high ESBL- producing E. coli (52.97%) were detected according to their MIC ratio ≥ 250 folds. The results are shown in Figure 4.
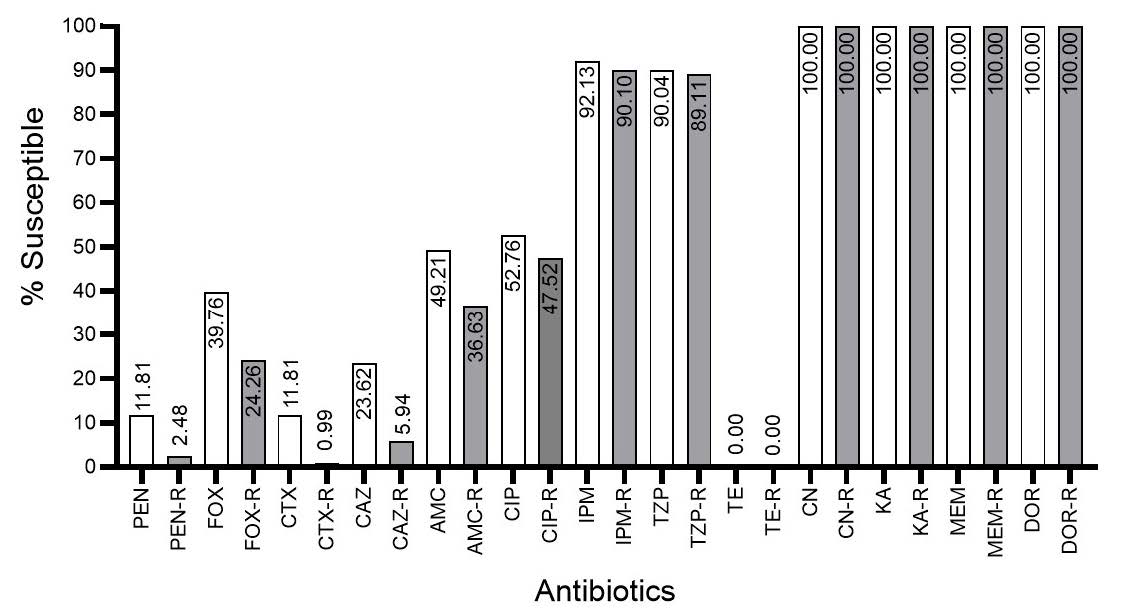
Figure 3. Percentage of susceptible isolates after testing among the total isolates (grey bar) and resistant isolates (white bar). PEN, penicillin; FOX, cefoxitin; CTX, cefotaxime; CAZ, ceftazidime; AMC, amoxicillin/clavulanic acid; CIP, ciprofloxacin; IPM, imipenem; TZP, piperacillin/tazobactam; TE, tetracycline; CN, gentamicin; KA, kanamycin; MEM, meropenem; DOR, doripenem.
Table 2. Antibiograms and percentage of isolates in each antibiogram.
|
Antibiograms |
Percentage (n=254) |
||||||||||||
|
PENR |
FOXR |
CTXR |
CAZR |
AMCR |
CIPR |
IPMS |
TZPS |
TER |
CNS |
KAS |
MEMS |
DORS |
18.50% |
|
PENR |
FOXR |
CTXR |
CAZR |
AMCS |
CIPS |
IPMS |
TZPS |
TER |
CNS |
KAS |
MEMS |
DORS |
18.50% |
|
PENR |
FOXR |
CTXR |
CAZR |
AMCR |
CIPS |
IPMS |
TZPS |
TER |
CNS |
KAS |
MEMS |
DORS |
13.39% |
|
PENR |
FOXS |
CTXR |
CAZS |
AMCS |
CIPS |
IPMS |
TZPS |
TER |
CNS |
KAS |
MEMS |
DORS |
7.48% |
|
PENR |
FOXS |
CTXR |
CAZR |
AMCR |
CIPR |
IPMS |
TZPS |
TER |
CNS |
KAS |
MEMS |
DORS |
5.12% |
|
PENS |
FOXS |
CTXS |
CAZS |
AMCS |
CIPS |
IPMS |
TZPS |
TER |
CNS |
KAS |
MEMS |
DORS |
5.12% |
|
PENR |
FOXR |
CTXR |
CAZR |
AMCS |
CIPR |
IPMS |
TZPS |
TER |
CNS |
KAS |
MEMS |
DORS |
3.94% |
|
PENR |
FOXS |
CTXR |
CAZR |
AMCR |
CIPS |
IPMS |
TZPS |
TER |
CNS |
KAS |
MEMS |
DORS |
3.94% |
|
PENR |
FOXS |
CTXR |
CAZR |
AMCR |
CIPR |
IPMR |
TZPR |
TER |
CNS |
KAS |
MEMS |
DORS |
2.76% |
|
PENR |
FOXS |
CTXR |
CAZS |
AMCS |
CIPR |
IPMS |
TZPS |
TER |
CNS |
KAS |
MEMS |
DORS |
2.76% |
|
PENR |
FOXS |
CTXS |
CAZS |
AMCS |
CIPR |
IPMS |
TZPS |
TER |
CNS |
KAS |
MEMS |
DORS |
2.76% |
|
PENR |
FOXR |
CTXR |
CAZR |
AMCR |
CIPR |
IPMR |
TZPR |
TER |
CNS |
KAS |
MEMS |
DORS |
2.36% |
|
PENS |
FOXS |
CTXS |
CAZS |
AMCS |
CIPR |
IPMS |
TZPS |
TER |
CNS |
KAS |
MEMS |
DORS |
2.36% |
|
PENR |
FOXS |
CTXR |
CAZR |
AMCS |
CIPR |
IPMS |
TZPS |
TER |
CNS |
KAS |
MEMS |
DORS |
1.97% |
|
PENR |
FOXR |
CTXR |
CAZR |
AMCR |
CIPS |
IPMR |
TZPR |
TER |
CNS |
KAS |
MEMS |
DORS |
1.18% |
|
PENS |
FOXS |
CTXR |
CAZR |
AMCS |
CIPS |
IPMS |
TZPS |
TER |
CNS |
KAS |
MEMS |
DORS |
1.18% |
|
PENR |
FOXR |
CTXR |
CAZR |
AMCR |
CIPR |
IPMS |
TZPR |
TER |
CNS |
KAS |
MEMS |
DORS |
0.79% |
|
PENR |
FOXR |
CTXR |
CAZS |
AMCR |
CIPR |
IPMS |
TZPS |
TER |
CNS |
KAS |
MEMS |
DORS |
0.79% |
|
PENR |
FOXR |
CTXR |
CAZS |
AMCS |
CIPR |
IPMR |
TZPR |
TER |
CNS |
KAS |
MEMS |
DORS |
0.39% |
|
PENR |
FOXS |
CTXR |
CAZR |
AMCS |
CIPS |
IPMS |
TZPS |
TER |
CNS |
KAS |
MEMS |
DORS |
0.39% |
|
PENR |
FOXS |
CTXS |
CAZR |
AMCR |
CIPR |
IPMR |
TZPR |
TER |
CNS |
KAS |
MEMS |
DORS |
0.39% |
|
PENR |
FOXS |
CTXS |
CAZR |
AMCS |
CIPS |
IPMS |
TZPS |
TER |
CNS |
KAS |
MEMS |
DORS |
0.39% |
|
PENR |
FOXS |
CTXS |
CAZS |
AMCR |
CIPR |
IPMS |
TZPS |
TER |
CNS |
KAS |
MEMS |
DORS |
0.39% |
|
PENS |
FOXR |
CTXR |
CAZR |
AMCR |
CIPR |
IPMS |
TZPS |
TER |
CNS |
KAS |
MEMS |
DORS |
0.39% |
|
PENS |
FOXS |
CTXR |
CAZR |
AMCR |
CIPS |
IPMS |
TZPS |
TER |
CNS |
KAS |
MEMS |
DORS |
0.39% |
|
PENS |
FOXS |
CTXR |
CAZR |
AMCS |
CIPR |
IPMR |
TZPR |
TER |
CNS |
KAS |
MEMS |
DORS |
0.39% |
|
PENS |
FOXS |
CTXR |
CAZR |
AMCS |
CIPR |
IPMS |
TZPS |
TER |
CNS |
KAS |
MEMS |
DORS |
0.39% |
|
PENS |
FOXS |
CTXR |
CAZS |
AMCS |
CIPR |
IPMR |
TZPR |
TER |
CNS |
KAS |
MEMS |
DORS |
0.39% |
|
PENS |
FOXS |
CTXR |
CAZS |
AMCS |
CIPR |
IPMS |
TZPS |
TER |
CNS |
KAS |
MEMS |
DORS |
0.39% |
|
PENS |
FOXS |
CTXR |
CAZS |
AMCS |
CIPS |
IPMS |
TZPS |
TER |
CNS |
KAS |
MEMS |
DORS |
0.39% |
|
PENS |
FOXS |
CTXS |
CAZS |
AMCR |
CIPS |
IPMS |
TZPR |
TER |
CNS |
KAS |
MEMS |
DORS |
0.39% |
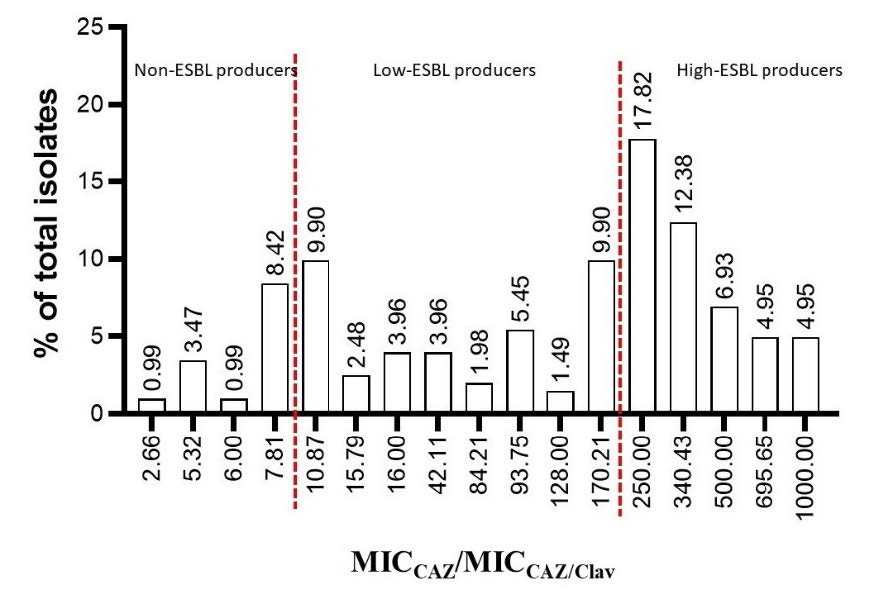
Figure 4. Number and percentage of isolate in each MIC ratio between CAZ and CAZ/Clav.
AmpC determination
Results demonstrated that 18 isolates gave positive results for determining AmpC enzyme after being induced with cefoxitin. D-shape zone around CAZ disc which inferred this inducible production could be observed in two, six, five, and five isolates of intermediate resistant, non, low, and high ESBL-producing groups, respectively. However, this screening assay was performed as the phenotypic method. Other isolates may also produce this enzyme at a low level as the constitutive expression. Several non-ESBL producing isolates were classified as the resistant isolates but could not be detected ESBL production according to the MIC ratio between CAZ and CAZ/Clav. A highly sensitive observation of MALDI-TOF could be carried out to determine this enzyme.
Determination of E. coli species-specific peptide spectra
E. coli species-specific spectra were identified by using the MALDI-TOF technique via the VITEK® MS apparatus. The prevalence of each peptide spectrum obtained in all isolates was also demonstrated in Figure 5 and Figure 6 showed the peptide spectra that could be detected in the high prevalence in each group of ESBL-producing E. coli. The peptide spectrum that is specifically identified to be E. coli should be detected in ≥ 80 percent of total isolates. The prevalence of each peak obtained in all isolates was also demonstrated in Figure 5. Results revealed that six peptide spectra were significantly detected over the cut-off value and suspected as the identified E. coli-specific peptide spectra. They were located at 2689, 3126, 6314, 6411, 7157, 10301 Da in the prevalence of 88.19%, 90.55%, 91.73%, 88.98%, 90.55%, 85.09%, respectively. Figure 6 showed the peptide spectra that could be detected in the high prevalence in each group of ESBL-producing E. coli.

Figure 5. Each peptide spectrum showing prevalence in percentage.

Figure 6. percentage of frequency of each peptide spectrum detected in the ESBL-producing E. coli.
ESBL-production peptide spectra
To identify the ESBL peptide spectra in high-ESBL producing E. coli, the significant peptide spectra were statistically identified by comparing the peak intensities obtained from the VITEK® MS analysis of CAZ-exposed and CAZ-exposed concomitantly with AMC colonies (positions 1 and 3, respectively). Results as shown in Figure 7 demonstrated six significantly different peaks which located at 4613 (P = 0.008), 5613 (P = 0.018), 6314 (P < 0.001), 6411 (P = 0.006), 9713 (P < 0.001), 10301 (P = 0.009) Da. ESBL manner in the characteristics of VITEK® MS peak intensity would be higher intensity peptide spectra of CAZ-exposed than CAZ and AMC-exposed colonies. Only 3 peaks, 4613, 5613, and 9713 Da were demonstrated in the ESBL manner as described above. Analyzed with paired T-test, fifty-five percent of high ESBL-producing isolates exhibited the detected pairs at 9713 Da (33 of 60 isolates). Even in the 27 isolates, the absence of detected pairs may be caused by the complete effect of clavulanic acid to destroy the protein or from the absence of protein production. Whereas the detected peak at 4613, and 5613 Da, the higher numbers of the detected unpairs were found (n = 52, and 54, respectively). Besides the ESBL manner, three peaks which located at 6314 (P ≤ 0.001), 6411 (P = 0.006), and 10301 (P = 0.009) Da were the significant peptide spectrums but the decreases in intensity obtain from the CAZ and AMC exposure were not demonstrated. It may be suspected that they were not ESBL spectra but were stress-response proteins highly produced after being exposed to clavulanic acid (Recacha et al., 2021). These protein productions of these E. coli may be to prevent the degradation of enzymes by clavulanic acid.
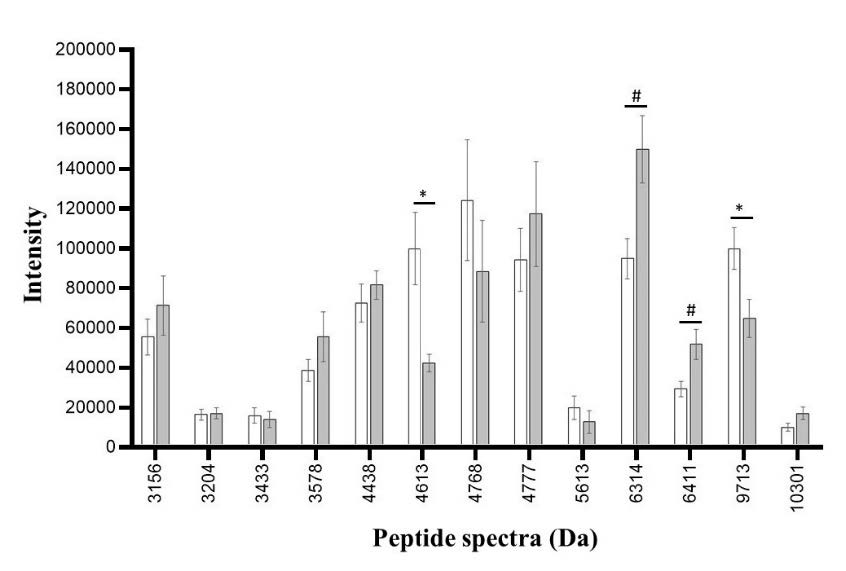
Figure 7. Peptide spectra in high ESBL-producing E. coli after exposure to CAZ (white bar) and CAZ and AMC (grey bar). The significant difference in the spectrum is when the spectrum intensity after exposure to CAZ is higher (*) or lower (#) than the spectrum intensity after exposure to CAZ and AMC.
Among the low ESBL-producing E. coli, significant differences in peak intensities were detected at 3578 (P = 0.001), 6314 (P ≤ 0.001), 6411 (P = 0.007), 7157 (P ≤ 0.001), 7872 (P = 0.003), and 8875 (P ≤ 0.001) Da as shown in Figure 8. Among these 6 peaks, there were no peaks that exhibited the characteristic of ESBL manner. These peaks were likely to be stress-response proteins as described above. Eventhough no ESBL manner spectra were identified by pair t-test, the enzyme may be degraded by clavulanic acid and result in the absence of peak intensity. This event could not be analyzed by pair t-test. According to the E-strip test, these isolates were already classified as low ESBL producing E. coli but due to statistical limitations, some ESBL manner spectra may not be identified as significant peaks at P-value = 0.05
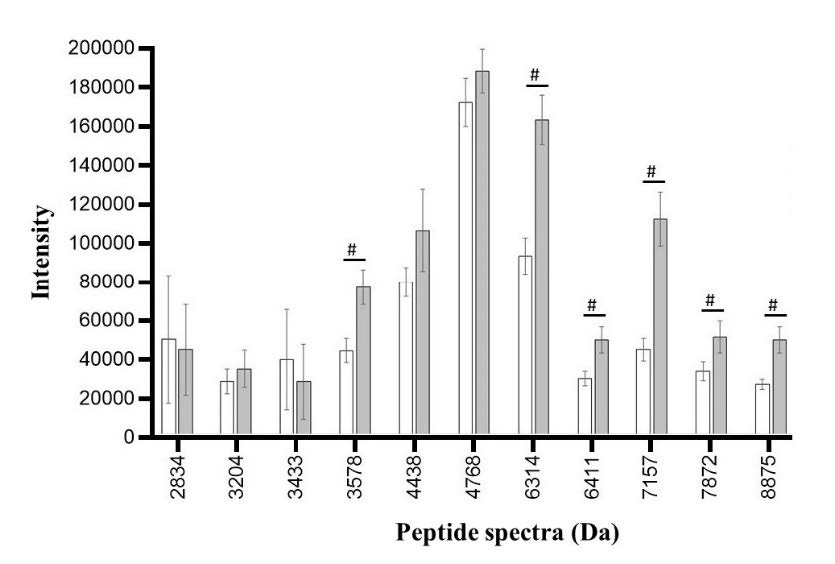
Figure 8. Peptide spectra in low ESBL-producing E. coli after exposure to CAZ (white bar) and CAZ and AMC (grey bar). The significant difference in the spectrum is when the spectrum intensity after exposure to CAZ is lower (#) than the spectrum intensity after exposure to CAZ and AMC.
In non ESBL-producing E. coli, the significant peptide spectra were identified at 3578 (P = 0.043), 4185 (P = 0.039), 4438 (P = 0.048), 6314 (P = 0.001), 6411 (P = 0.001), 7157 (P ≤ 0.001), 7872 (P ≤ 0.001), 8369 (P = 0.003), and 8875 (P ≤ 0.001) Da. Among these peaks, none of these peaks exhibits the characteristic of ESBL manner as same as the non ESBL-producing group (Figure 9).
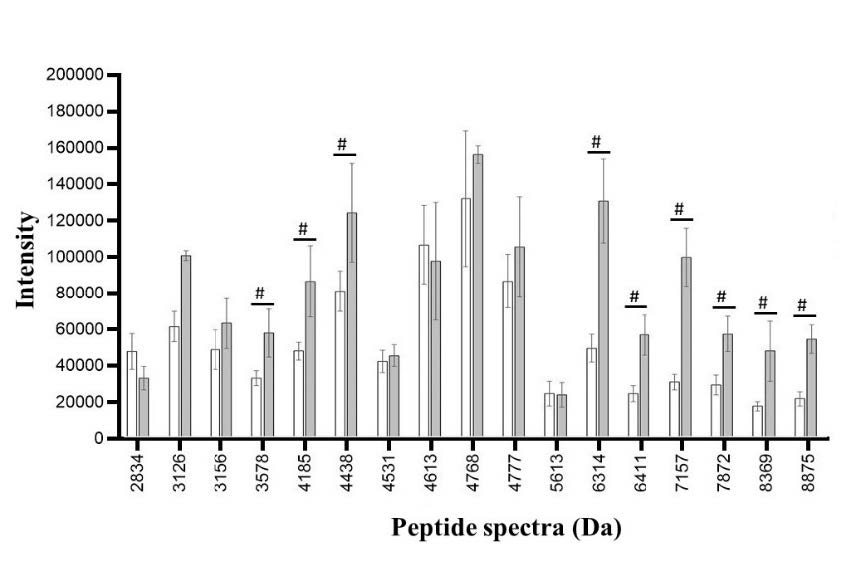
Figure 9. Peptide spectra in non ESBL-producing E. coli after exposure to CAZ (white bar) and CAZ and AMC (grey bar). The significant difference in the spectrum is when the spectrum intensity after exposure to CAZ is lower (#) than the spectrum intensity after exposure to CAZ and AMC.
AmpC-production peptide spectra
AmpC production of high ESBL-producing E. coli was determined among peptide spectrum intensities obtained from the area which was exposed to CAZ alone (position 1) and the area which was exposed to CAZ concomitant with FOX (position 2). Four peptide spectrum intensities were significantly different between the above positions. They were located at 4184 (P = 0.048), 5096 (P < 0.001), 9551 (P = 0.021), and 10477 (P = 0.006) Da. Among these peaks, only three peaks exhibit the AmpC β-lactamase manner, showing higher intensity peptide spectra in an area exposed to CAZ concomitant with FOX (position 2) than area exposed to CAZ alone (position 1), which were 4184, 9551, 10477 Da. AmpC enzyme could be detected in three peaks located at 4184 (n=10), 9551 (n=6), 10477 (n=23) Da. These isolates could be suspected as AmpC and ESBL coproducers between the high ESBL and AmpC enzymes (Table 3).
Table 3. Peptide spectra in high ESBL-producing E. coli after exposure to CAZ (white bar) and CAZ and FOX (grey bar). The significant difference in the spectrum is when the spectrum intensity after exposure to CAZ is higher (*) or lower (#) than the spectrum intensity after exposure to CAZ and FOX.
|
Spectra (Da) |
Intensity of spectrum after exposure to |
P |
|||
|
CAZ (Average) |
CAZ (SD.) |
CAZ and FOX (Average) |
CAZ and FOX (SD.) |
||
|
3410 |
35255.88 |
46197.43 |
19006.61 |
3312.361 |
0.163 |
|
4174 |
48192.97 |
24233.48 |
51173.03 |
30476.41 |
0.636 |
|
4184 |
113064.60 |
86039.39 |
144184.70 |
98179.97 |
0.048* |
|
4362 |
65549.10 |
28423.81 |
72231.95 |
36385.72 |
0.212 |
|
4531 |
65110.25 |
47907.06 |
55048.52 |
27582.01 |
0.476 |
|
4726 |
68211.97 |
36557.93 |
125475.60 |
53566.76 |
0.051 |
|
4768 |
39553.11 |
29412.52 |
43501.91 |
20595.55 |
0.101 |
|
4777 |
80267.25 |
118837.60 |
64697.79 |
81550.07 |
0.687 |
|
4856 |
81908.53 |
52721.95 |
76642.06 |
34133.43 |
0.695 |
|
5096 |
86677.98 |
40959.30 |
62668.28 |
39708.22 |
<0.001# |
|
5236 |
61204.22 |
21821.61 |
67808.18 |
29044.19 |
0.525 |
|
5380 |
68843.04 |
23919.42 |
76235.57 |
39264.95 |
0.670 |
|
5968 |
71630.40 |
42619.30 |
78291.29 |
66771.15 |
0.748 |
|
6254 |
43246.54 |
16900.38 |
46827.04 |
21484.88 |
0.959 |
|
7271 |
21634.57 |
4709.949 |
23643.33 |
10862.74 |
0.119 |
|
8254 |
56873.69 |
71126.13 |
58720.29 |
35274.15 |
0.840 |
|
8350 |
55560.78 |
24403.18 |
61283.18 |
31293.03 |
0.381 |
|
9063 |
149822.50 |
59860.57 |
148682.00 |
72855.60 |
0.864 |
|
9537 |
30867.03 |
10584.47 |
37938.69 |
16709.97 |
0.276 |
|
9551 |
113306.70 |
74244.21 |
147127.10 |
95223.83 |
0.021* |
|
9713 |
121081.30 |
62353.97 |
109363.10 |
51517.19 |
0.120 |
|
9741 |
73285.06 |
22884.42 |
94495.68 |
48034.31 |
0.549 |
|
10463 |
59755.12 |
37804.88 |
50179.79 |
20784.30 |
0.375 |
|
10477 |
52823.42 |
28793.76 |
68029.97 |
40009.88 |
0.006* |
AmpC β-lactamase identification of low-ESBL producing E. coli was determined among peptide spectrum intensities analyzed from the area which was exposed to ceftazidime alone (position 1) and the area which was exposed to ceftazidime concomitant with cefoxitin (position 2). Two peptide spectrum intensities were significantly different between the above positions. They were located at 3410 (n = 18) and 5096 (n = 35) Da but none of the peaks exhibited AmpC β-lactamase (Table 4).
Table 4. Peptide spectra in low ESBL-producing E. coli after exposure to CAZ (white bar) and CAZ and FOX (grey bar). The significant difference in the spectrum is when the spectrum intensity after exposure to CAZ is lower (#) than the spectrum intensity after exposure to CAZ and FOX.
|
Spectra (Da) |
Intensity of spectrum after exposure to |
P |
|||
|
CAZ (Average) |
CAZ (SD.) |
CAZ and FOX (Average) |
CAZ and FOX (SD.) |
||
|
3410 |
27780.70 |
26641.25 |
19637.49 |
2015.229 |
<0.001# |
|
4163 |
40303.10 |
25585.16 |
35812.88 |
16807.47 |
.450 |
|
4174 |
39265.13 |
16938.43 |
51363.40 |
33929.05 |
.238 |
|
4362 |
86098.70 |
37915.71 |
79767.04 |
38549.39 |
.152 |
|
4531 |
57564.37 |
28960.62 |
63521.59 |
25888.31 |
.339 |
|
4856 |
63658.81 |
25369.72 |
62675.16 |
28300.39 |
.760 |
|
4869 |
95212.29 |
39202.12 |
96096.20 |
51204.20 |
.994 |
|
5096 |
78124.97 |
14177.86 |
61197.32 |
15144.03 |
.01# |
|
5380 |
86554.98 |
28304.40 |
79992.29 |
34371.47 |
.296 |
|
6254 |
51950.97 |
21106.29 |
50596.78 |
22188.54 |
.440 |
|
7271 |
23442.65 |
7994.891 |
22158.30 |
9834.24 |
.141 |
|
8326 |
33936.34 |
16277.90 |
38068.74 |
12366.77 |
.250 |
|
8350 |
55209.54 |
24726.49 |
48586.21 |
23150.70 |
.366 |
|
9063 |
164585.90 |
62166.93 |
149999.30 |
61324.15 |
.106 |
|
9537 |
34532.86 |
14679.22 |
28614.78 |
11006.78 |
.095 |
|
9713 |
98363.86 |
38072.25 |
86313.80 |
43936.42 |
.212 |
|
9741 |
105128.20 |
59099.81 |
116403.30 |
51612.26 |
.231 |
|
10463 |
56117.52 |
31885.38 |
52753.60 |
27392.34 |
.917 |
|
10477 |
59854.05 |
39767.04 |
42776.52 |
28796.88 |
.343 |
AmpC β-lactamase of non-ESBL producing E. coli were determined among peptide spectrum intensities analyzed from the area which was exposed to ceftazidime alone (position 1) and the area which was exposed to ceftazidime concomitant with cefoxitin (position 2). Three peptide spectrum intensities were significantly different between the above positions. They were located at 2875, 5380 and 6254 Da. Among these three peaks, two peaks exhibited AmpC
β-lactamase which were 5380 (n = 48) and 6254 (n = 40) Da as shown in Table 5. The identification of AmpC β-lactamase gives us the support evidence of why non ESBL-producing E. coli can be grouped as resistant E. coli. It may be caused from the production of AmpC β-lactamase.
Table 5. Peptide spectra in non ESBL-producing E. coli after exposure to CAZ (white bar) and CAZ and FOX (grey bar). The significant difference in the spectrum is when the spectrum intensity after exposure to CAZ is higher (*) or lower (#) than the spectrum intensity after exposure to CAZ and FOX.
|
Spectra (Da) |
Intensity of spectrum after exposure to |
P |
|||
|
CAZ (Average) |
CAZ (SD.) |
CAZ and FOX (Average) |
CAZ and FOX (SD.) |
||
|
2184 |
79362.91 |
100051.30 |
27057.26 |
7918.08 |
.420 |
|
2548 |
25278.09 |
10763.03 |
27902.40 |
10897.70 |
.551 |
|
2835 |
27663.49 |
8744.43 |
33163.41 |
17906.78 |
.249 |
|
2875 |
80921.02 |
85779.00 |
34469.12 |
19411.74 |
.003# |
|
3157 |
27568.14 |
4771.72 |
27584.85 |
8781.93 |
.648 |
|
3410 |
22938.03 |
2071.30 |
23339.00 |
3132.17 |
.356 |
|
4163 |
74497.12 |
99078.78 |
24164.82 |
9944.97 |
.516 |
|
4174 |
39157.76 |
17361.07 |
30830.24 |
14189.51 |
.053 |
|
4362 |
113626.7 |
192790.10 |
99747.10 |
51175.19 |
.578 |
|
4531 |
49592.79 |
16444.04 |
48049.60 |
22497.02 |
.705 |
|
4777 |
40978.24 |
22017.52 |
41888.71 |
17196.68 |
.992 |
|
4856 |
72312.31 |
63635.05 |
54893.98 |
50227.20 |
.400 |
|
4869 |
67464.15 |
34138.14 |
68792.85 |
38750.34 |
.964 |
|
5096 |
97640.86 |
36973.36 |
92371.42 |
42630.30 |
.951 |
|
5380 |
77819.15 |
10543.99 |
93257.15 |
12226.05 |
.005* |
|
6254 |
52929.24 |
9799.31 |
60799.22 |
6099.84 |
.026* |
|
8350 |
42858.23 |
21141.03 |
33621.70 |
18051.18 |
.178 |
|
9063 |
111817.3 |
56010.18 |
93721.46 |
59834.90 |
.093 |
|
9537 |
32000.82 |
25080.62 |
43994.34 |
89721.41 |
.382 |
|
9551 |
56545.73 |
115276.20 |
47547.22 |
101472.00 |
.945 |
|
9713 |
71581.18 |
13235.10 |
70376.40 |
38093.38 |
.580 |
|
9741 |
101591.2 |
46588.15 |
72417.07 |
57093.27 |
.147 |
|
10463 |
40754.47 |
19582.95 |
45101.31 |
27479.51 |
.622 |
DISCUSSION
Community-acquired urinary tract infection has been a major problem for women of reproductive age. There are several causative agents for this type of urinary tract infection at Maharaj Nakorn Chiang Mai such as E. coli, E. faecalis, and E. faecium (Magliano et al., 2012). Uropathogenic E. coli (UPEC) is the most common E. coli for urinary tract infections, which correlates to the prevalence of previous studies (Matsukawa et al., 2019).
From the previous study by Singhavejsakul et al. (Singhavejsakul et al., 2022), 115 of 198 isolates were classified as resistant to E. coli, however, they were susceptible to meropenem, doripenem, amikacin and gentamicin. Regarding the ESBL E-strip test, the results showed that the tested resistant isolates were categorized as the non-ESBL producers, the low-, and the high- ESBL producers with 33.33%. This previous investigation also further suggested other drug resistance mechanisms of the tested resistant E. coli such as AmpC β-lactamase, other degrading enzymes, and efflux pump for its highly antibiotic resistance. It may be suggested that there are other enzymes concomitant with ESBL production, especially AmpC β-lactamase production both in non-ESBL and ESBL-producing E. coli.
Pumeesat et al. reported the detection of ESBL and AmpC β-lactamase of 400 clinical isolates of Enterobacteriaceae at Faculty of Medicine Vajira Hospital, Navamindradhiraj university, and found that the prevalences of ESBL production alone, AmpC production alone, and coproduction were 42.5%, 5.3%, and 1.8%, respectively (Pumeesat P et al., 2015) that correlated to other studies in Thailand such as Chayakulkeeree et al. who collected 348 E. coli isolates from Siriraj Hospital (Chayakulkeeree et al., 2005). As like as our result, Vesalova et al. carried out the DDST method as likely as Potjaman et al. found that ESBL production was found roughly at the same percentage which was 33.3% and 32%, respectively (Pumeesat et al., 2015; Velasova et al., 2019). DDST and Phenotypic AmpC activity test was used to find ESBL and AmpC production in 445 E. coli from a study conducted in Hojimin, Vietnam by Lan et al (Lan et al., 2017). Of all the tested E. coli, 6.2% have on ESBL, 0.5% have only AmpC β-lactamase and only 0.5% have ESBL-coproduction with AmpC. The prevalences of ESBL and AmpC production by using the DDST method in Korea was found that E. coli produced ESBL alone, AmpC alone, and ESBL-coproduction with AmpC β-lactamase accounting for 80%, 45.3%, and 3.1% of 159 tested E. coli isolates (Yoo et al., 2010). Result of this study in Korea was also likely to our investigation.
Normally, AmpC β-lactamase is a constitutionally expressed enzyme. However, AmpC β-lactamase is found to be in hyperproduction condition due to some affecting factors such as cefoxitin or imipenem exposure which increases 1,6-anhydro-MurNAc-tripeptides, the depressor of AmpR protein, and then the conversion of AmpR expression, and the large volume of AmpC enzyme are occurred (Harris, 2015). In our study, cefoxitin was carried out as the inducer for activating the hyperproduction of AmpC β-lactamase to determine the co-production of AmpC β-lactamase and ESBL in the different groups of ESBL-producing E. coli.
The antibiogram of our tested isolates was likely to be the yearly antibiogram of the E. coli in Maharaj Nakorn Chiang Mai Hospital (Diagnostic laboratory unit, 2021). We found that E. coli was not so susceptible to AMP and CTX and more widely drugs used to treat UTI were cephalosporins, so the laboratory decided not to report E. coli susceptibility to ampicillin since 2010. The low susceptible incidence, only 15.2% and 16.2%, of AMP and CTX could be implied to the inappropriate use of AMP and CTX to treat UTI and it means that most E. coli could produce β-lactamase enzymes such as ESBL, AmpC, carbapenemase which resulted to the reduction of β-lactam efficacy. For the CAZ and AMC antibiogram in 2017, the percentage of susceptible incidence was also similar level, 62% and 66% (Diagnostic laboratory unit, 2021). So, TZP could eradicate ESBL-producing E. coli while tazobactam contained in TZP can not inhibit the activity of AmpC enzyme. Unlikely, our study found the reduction of TZP-susceptible E. coli. The differences in the decline of the E. coli population may have other enzymes production apart from ESBL such as AmpC and carbapenemase.
When comparing other carbapenems drugs in 2012 through 2017, 98-100% of E. coli were still susceptible to imipenem and meropenem. This correlated to our study in which 100% of the tested E. coli were susceptible to imipenem and correlated to the susceptibility from the National Antimicrobial Resistance Surveillance Center, Thailand (NARST) which collected Antibiogram results from 79 hospitals in Thailand (Sangsuwan, 2021). NARST found that from 2010 to 2020, more than 95% of E. coli were susceptible to carbapenems. This shows us that the E. coli population in our hospital and also other hospitals had a low level of carbapenem resistance. The susceptible pattern helps ensure us that carbapenems could still be used to treat UTIs in the present.
According to their degree of susceptibility, we determined to classify the isolates into three groups susceptible, intermediate resistant and resistance group. The classification of E. coli isolates was performed according to the criteria described in the previous studies of other colleagues in our laboratory (Singhavejsakul et al., 2022). The criteria used for the classification of Sabir et al. that collected urine specimen from a hospital in Punjab, India by Kirby-Bauer method were different (Sabir et al., 2014).
Clavulanic acid is an ESBL inhibitor and has no bactericidal effect. Therefore, if the clear zone occurred, it may be implied that clavulanic acid eradicates the ESBL enzyme produced by E. coli around the disc and shows us the effectiveness of the drug around each antibiotic disc. Clavulanic acid could still diffuse further from the clear zone occurred, help eradicate enzymes, and induce the keyhole phenomenon. In our study, the keyhole phenomenon was observed in 53.04% of all the tested isolates. Therefore, the keyhole phenomenon observed in this study could only be inferred that about half of the tested E. coli had ESBL production. The E-strip test is a confirmatory test for ESBL production. MIC ratio between MICCAZ and MICCAZ/Clav, for differentiating the ESBL production of the resistant E. coli. According to this MIC ratio as described in the previous report of Singhavejsakul et al, the tested E. coli isolates could be grouped into 3 groups, non-, low-, and high-ESBL producing E. coli (Singhavejsakul et al., 2022).
Various methods for screening AmpC production include the Tris-EDTA technique for cell lysis, the AmpC inhibitor technique, and the AmpC induction method. Any of the methods could be performed for screening AmpC β-lactamase production. AmpC induction method is a way of using cefoxitin (30 µg) to induce E. coli that demonstrated the AmpC hyperproduction of E. coli nature for producing AmpC β-lactamase, according to Ingram et al‘s report (Ingram et al., 2011).
The benefit of VITEK® MS correlates to what had been stated in other studies which is minimizing its consumption time. The total analyzing time used for processing was about 1 minute, it can be shortened the reporting time to the doctor. In our study, species-specific spectra from the analysis of VITEK® MS were determined. Besides the species-specific spectra, some peptide spectra may be correlated with the drug-resistant proteins, such as ESBL, and AmpC β-lactamase and may be used the different intensity of these spectra to indicate the drug-resistant-related enzymes. This hypothesis was supported by Li et al (Li et al., 2018) who uses the three- dimensional and MALDI-TOF technique to detect the ability to produce AmpC β-lactamase. Sixty-nine well-characterized AmpC-producing and 36 non-AmpC-producing strains were identified. The reason is that drug resistance enzyme produced by E. coli must always be protein and therefore could be expressed through these spectra. It could be said that the spectra analysis for determining the drug-resistant mechanism is an extraordinary activity that MYLA itself could not accomplish at present.
The frequency of detected spectra that were shown as the species-specific spectra was mentioned as well as two previous studies performed via VITEK® MS (Lananta et al., 2021; Wisutthithada et al., 2022). Their species-specific spectra were described at 4365, 5431, 5097, 5380, 6255, and 9065 Da with a cut-off in a range of 70-80%. Although there may be a small amount of discrepancy of the species-specific spectra among these studies (about ± 1-2 Da), however it does not have any effect due to its insignificant discrepancy. Differently, the cut-off value of Singhavejsakul et al. (Singhavejsakul et al., 2022) was set to 95% and the specie peptide spectrum was identified at 4365, 5380, 6255 Da which was also identified in our study, and other spectra such as 2182, 3637, 3936, 7255, 7872, 8875 Da that was not detected in our study.
Lananta et al. (Lananta et al., 2021) reported that a peptide spectrum located at 9713 Da was suspected as an ESBL peptide spectrum among the nosocomial isolates of E. coli. We focused to compare the ESBL peptide spectrums of nosocomial isolates tested in Lananta et al. and of community-acquired isolates in our study. As same as the previous study, peptide spectrum at 9713 Da was detected only in high- ESBL producers and then also suspected as ESBL indicative spectra whereas there was no detection in the non-, and low-ESBL producers both in our and previous studies.
Comparably, the ESBL spectra as reported in the studies of Lananta et al. (Lananta et al., 2021), Wisutthithada et al. (Wisutthithada et al., 2022), and our study was similarly detected at 9713 Da. Moreover, these studies which investigated with nosocomial isolates also identified ESBL spectra at 5968, 7159, 10477 Da (Lananta et al., 2021), and 4613, 7153 Da (Wisutthithada et al., 2022). These peaks were not found in our study of community-acquired isolates. The differences in identifying the ESBL peptide spectrum maybe due to the samples used in each study. Singhavejsakul et al. (Singhavejsakul et al., 2022) and our study uses samples collected from Community-acquired UTI cases. Meanwhile, Lananta et al. and Wisutthithada et al. (Lananta et al., 2021; Wisutthithada et al., 2022) uses samples collected from Hospital acquired UTI cases.
Only this study and Li et al. (Li et al., 2018) study determined to identify AmpC β-lactamase hyperproduction. Li et al. stated that the peaks 434, and 494 Da were AmpC β-lactamase, these peaks were obtained through cefotaxime hydrolysis assay. Li et al. also stated that the peaks 563, and 587 Da were AmpC β-lactamase, these peaks were obtained through ceftazidime hydrolysis assay. However, any peaks from the result of Li et al was not identified as AmpC β-lactamase in our study.
In the case that the results did not correlate to the hypothesis might be due to the production of other proteins or enzymes associated with other drug resistance mechanisms. For example, Some E. coli did not have ESBL but was still drug resistant. Other drug resistance mechanism such as efflux pump results in a multidrug-resistant pattern in the absence of enzymes. Therefore, to confirm the correct results of our study, the statistical method was the only option.
CONCLUSION
The rapid diagnosis using VITEK® MS of drug-resistant proteins responsible to ESBL and AmpC β-lactamase have been commonly important for treating UTI. In the present study, we identified proteins, which were responsible for the drug resistance mechanism, acquired from ESBL-producing E. coli. Among 254 isolates of E. coli, only 107, and 80 isolates were high-, and low-ESBL-producing E. coli, respectively. The results exhibited that the peptide spectra located at 4613, 5613 and 9713 Da may be suspected to play an ESBL enzymatic manner. Five peaks, 4184, 5380, 6254, 9551, and 10077 Da may be suspected to play an AmpC β-lactamase enzymatic manner. Consequently, it would be more precise, valid, and reliable if the sample size were larger than this study. By identifying peptide spectra from E. coli according to these procedures, we can benefit from identifying drug-resistant mechanism of E. coli through routine laboratory via VITEK® MS.
ACKNOWLEDGEMENTS
The authors would like to thank the Department of Microbiology, Chiang Mai University for providing microbiological support. We are grateful to Maharaj Nakorn Chiang Mai Hospital for providing the clinical isolates. We are also grateful to all technicians at the Diagnostic Laboratory Unit, Maharaj Nakorn Chiang Mai Hospital, Faculty of Medicine for their guidance on performing the VITEK® MS apparatus. We would also like to thank the Institutional Biosafety Committee (IBC) for approving our work done on Biosafety Level 2.
AUTHOR INFORMATION
Author KB, KP, and SC participated in the proposal sending, participated in the experiments, and proved the manuscript. KN participated in the proposal sending and participated in the microbiologic experiment. RR analyzed data and drafted the manuscript. PS participated in the microbiologic experiment and drafted the manuscript. RS collected the bacteria and performed the VITEK® MS experiment. TS performed the statistic analysis and proved the manuscript. SS carried out the research funding, designed the research methods, collected the bacteria, participated in the microbiologic experiment, and drafted the manuscript. All authors have read and approved the final manuscript.
CONFLICT OF INTEREST
The authors declare that they hold no competing interests.
REFERENCES
Black, J.A., Moland, E.S., and Thomson, K.S. 2005. AmpC disk test for detection of plasmid-mediated AmpC beta-lactamases in Enterobacteriaceae lacking chromosomal AmpC beta-lactamases. Journal of Clinical Microbiology. 43(7): 3110-3113.
Chayakulkeeree, M., Junsriwong, P., Keerasuntonpong, A., Tribuddharat, C., and Thamlikitkul, V. 2005. Epidemiology of extended-spectrum beta-lactamase producing gram-negative bacilli at Siriraj Hospital, Thailand, 2003. Southeast Asian Journal of Tropical Medicine and Public Health. 36(6): 1503-1509.
Clinical Laboratory Standards Institute. 2020. Performance Standards for Antimicrobial Susceptibility Testing (Thirtyth ed.). Wayne (PA): CLSI.
Correa-Martínez, C.L., Idelevich, E.A., Sparbier, K., Kostrzewa, M., and Becker, K. 2019. Rapid detection of extended-spectrum β-Lactamases (ESBL) and AmpC β-Lactamases in enterobacterales: Development of a screening panel using the MALDI-TOF MS-Based Direct-on-Target microdroplet growth assay. Frontiers in Microbiology. 10: 13.
Diagnostic laboratory unit, M.N.C.M.H. 2021. Antimicrobial susceptible percentage of isolated bacteria all clinical specimen January -December 2020 Retrieved from Faculty of Medicine, Chiang Mai University: retrieve from https://w2.med.cmu.ac.th/lab/#1626499790760-c8af5345-b280. avalable at March 22, 2022.
Drieux, L., Brossier, F., Sougakoff, W., and Jarlier, V. 2008. Phenotypic detection of extended-spectrum β-lactamase production in Enterobacteriaceae: Review and bench guide. Clinical Microbiology and Infection. 14(s1): 90-103.
Harris, P. N. 2015. Clinical management of infections caused by Enterobacteriaceae that express extended-spectrum β-lactamase and AmpC enzymes. Seminars in Respiratory and Critical Care Medicine. 36(1): 56-73.
Hordijk, J., Wagenaar, J.A., van de Giessen, A., Dierikx, C., van Essen-Zandbergen, A., Veldman, K., et al. 2013. Increasing prevalence and diversity of ESBL/AmpC-type β-lactamase genes in Escherichia coli isolated from veal calves from 1997 to 2010. Journal of Antimicrobial Chemotherapy. 68(9): 1970-1973.
Ingram, P.R., Inglis, T.J.J., Vanzetti, T.R., Henderson, B.A., Harnett, G.B., and Murray, R. J. 2011. Comparison of methods for AmpC β-lactamase detection in Enterobacteriaceae. Journal of Medical Microbiology. 60(Pt 6): 715-721.
Lan, N.P.H., Hien, N.H., Le Thi Phuong, T., Thanh, D.P., Thieu, N.T.V., Ngoc, D.T.T., et al. 2017. Phenotypic and genotypic characteristics of ESBL and AmpC producing organisms associated with bacteraemia in Ho Chi Minh City, Vietnam. Antimicrobial Resistance and Infection Control. 6: 105-105.
Lananta, S., Siriratanagool, P., Sommanawan, N., Lerttrakarnnon, P., Boonchuay, S., Jirawattanapong, S., et al. 2021. Different responses of ESBL indicative peptide spectra to various β- lactam exposures among community acquired urinary tract infected Escherichia coli by using the MALDI-TOF technique. Chiang Mai University Journal of Natural Sciences. 20(4): e2021095.
Lee, D.S., Lee, S.J., and Choe, H.S. 2018. Community-acquired urinary tract infection by Escherichia coli in the era of antibiotic resistance. BioMed Research International. 2018: 7656752.
Li, C., Ding, S., Huang, Y., Wang, Z., Shen, J., Ling, H., et al. 2018. Detection of AmpC β-lactamase-producing Gram-negative bacteria by matrix-assisted laser desorption/ionization time-of-flight mass spectrometry. Journal of Hospital Infection. 99(2): 200-207.
Magiorakos, A.P., Srinivasan, A., Carey, R.B., Carmeli, Y., Falagas, M.E., Giske, C.G., et al. 2012. Multidrug-resistant, extensively drug-resistant and pandrug-resistant bacteria: An international expert proposal for interim standard definitions for acquired resistance. Clinical Microbiology and Infection. 18(3): 268-281.
Magliano, E., Grazioli, V., Deflorio, L., Leuci, A.I., Mattina, R., Romano, P., et al. 2012. Gender and age-dependent etiology of community-acquired urinary tract infections. Sciences World Journal. 2012: 349597.
Matsukawa, M., Igarashi, M., Watanabe, H., Qin, L., Ohnishi, M., Terajima, J., et al. 2019. Epidemiology and genotypic characterisation of dissemination patterns of uropathogenic Escherichia coli in a community. Epidemiology and Infection. 147: e148.
Medina, M. and Castillo-Pino, E. 2019. An introduction to the epidemiology and burden of urinary tract infections. Therapeutic Advances in Urology. 11: 1756287219832172.
Nogueira-Miranda Kda, S., Palmeiro, J.K., Conte, D., Maia, F.V., Reason, I.T., Monteiro, C.L., et al. 2012. Detection of extended-spectrum β-lactamase in Enterobacter spp.--evaluation of six phenotypic tests. Microbial Drug Resistance. 18(1): 66-70.
Pumeesat P, Chitpirom P, and K., M. 2015. Detection of extended-spectrum beta-lactamase and AmpC beta-lactamase in enterobacteriaceae. Royal Thai Army Medical Journal. 68: 165-171.
Recacha, E., Fox, V., Díaz-Díaz, S., García-Duque, A., Docobo-Pérez, F., Pascual, Á., et al. 2021. Disbalancing envelope stress responses as a strategy for sensitization of Escherichia coli to antimicrobial agents. Frontiers in Microbiology. 12: 653479.
Sabir, S., Ahmad Anjum, A., Ijaz, T., Asad Ali, M., Ur Rehman Khan, M., and Nawaz, M. 2014. Isolation and antibiotic susceptibility of E. coli from urinary tract infections in a tertiary care hospital. Pakistan Journal of Medical Sciences 30(2): 389-392.
Singhavejsakul, P., Niamsup, P., Malairungsakul, N., Chaisaen, Y., Pooriwarangkakul, P., Nimlamool, W., et al. 2022. Clavulanic acid - susceptible peptide spectra tested with agar disk diffusion and E-test of urinary tract infected Escherichia coli isolated from the community-acquired infection. Chiang Mai University Journal of Natural Sciences. 21(2): e2022035.
Sangsuwan, T., Jariyasoonthornkit, K., and Jamulitrat, S. 2021. Antimicrobial resistance patterns amid community-acquired uropathogens in outpatient settings of a tertiary care hospital in Thailand. Siriraj Medical Journal. 73(8): 501-509.
Velasova, M., Smith, R.P., Lemma, F., Horton, R.A., Duggett, N.A., Evans, J., et al. 2019. Detection of extended-spectrum β-lactam, AmpC and carbapenem resistance in Enterobacteriaceae in beef cattle in Great Britain in 2015. Journal of Applied Microbiology. 126(4): 1081-1095.
Vrioni, G., Tsiamis, C., Oikonomidis, G., Theodoridou, K., Kapsimali, V., and Tsakris, A. 2018. MALDI-TOF mass spectrometry technology for detecting biomarkers of antimicrobial resistance: current achievements and future perspectives. Annals of Translational Medicine. 6(12): 240.
Wisutthithada, P., Sirilueangtrakul, T., Suwannapong, P., Nongmak, R., Khamnoi, P., Sastraruji, T., et al. 2022. The decrease in the spectrum intensity of ESBL spectra after being exposed to clavulanic acid in nosocomial urinary tract infected Escherichia coli analysed by VITEK® MS. Chiang Mai University Journal of Natural Science. 21(4): e2022061.
Yoo, J. S., Byeon, J., Yang, J., Yoo, J. I., Chung, G. T., and Lee, Y. S. 2010. High prevalence of extended-spectrum beta-lactamases and plasmid-mediated AmpC beta-lactamases in Enterobacteriaceae isolated from long-term care facilities in Korea. Diagnostic Microbiology and Infectious Diseases. 67(3): 261-265.
OPEN access freely available online
Natural and Life Sciences Communications
Chiang Mai University, Thailand. https://cmuj.cmu.ac.th
Kamonlapob Boonrugsa1, Kate Norkham1, Siravit Chotimanon1, Khetdan Panyadej1, Rath Rerkasem1, Pitchaya Singhavesjsakul1, Ratchanee Somnabut2, Thanapat Sastraruji3, and Siriwoot Sookkhee1, *
1 Department of Microbiology, Faculty of Medicine, Chiang Mai University, Chiang Mai, 50200, Thailand.
2 Diagnostic Laboratory Section, Maharaj Nakorn Chiang Mai Hospital, Faculty of Medicine, Chiang Mai University, Chiang Mai, 50200, Thailand.
3 Dental Research Center, Faculty of Dentistry, Chiang Mai University, Chiang Mai, 50200, Thailand.
Corresponding author: Siriwoot Sookkhee, E-mail: siriwoot.s@cmu.ac.th
Total Article Views
Editor: Veerasak Punyapornwithaya,
Chiang Mai University, Thailand
Article history:
Received: November 11, 2022;
Revised: March 14, 2023;
Accepted: March 21, 2023;
Published online: April 12, 2023