 ISSN: 2822-0838 Online

Peptide Spectra Analysis of DNA Starvation/Stationary Phase Protection-Like Protein Found in Hospital-Acquired ESBL Producing Escherichia coli by MALDI-TOF Technique
Purilarp Daoaroonkiet, Siriaran Kwangsukstith, Salin Srichai, Swasamon Jaidee, Metha Emthanom, Pijitra Sujitpiriyakit, Thanapat Sastraruji, and Siriwoot Sookkhee*Published Date : April 3, 2023
DOI : https://doi.org/10.12982/NLSC.2023.032
Journal Issues : Number 2, April-June 2023
ABSTRACT: The present study aimed to investigate the hospital-acquired Extended Spectrum β-Lactamase production (ESBL) producing Escherichia coli, to identify the significant ESBL peptide spectra after exposure to ceftazidime and amoxicillin/clavulanic acid, and to identify the resistant peptide spectra after exposure to ciprofloxacin. ESBL production and the minimal inhibitory concentration of ciprofloxacin were investigated using the Epsilometer strip test. Their colonies were collected to analyze the peptide spectra by VITEK® Mass Spectrometry. The significant difference in spectrum intensity for suspected ESBL peptide spectra, and DNA starvation/stationary phase protection (Dps) -like peptide spectra were also determined. Among 228 isolates, the high ESBL-producing E. coli which exhibited high ciprofloxacin resistance was demonstrated as 22.63%. The significant reduction of spectrum intensity after exposure to ceftazidime and amoxicillin/clavulanic acid was only detected at spectrum 9714 Da in the high ESBL-producing group (P ≤0.001). Among four selected high ESBL producers, only one significant spectrum located at 9063 Da was detected in the high ciprofloxacin-resistant group (P ≤0.001) after being exposed to ceftazidime and ciprofloxacin. The highest percentage increase of spectrum 9063 Da was 69.42%. Multidrug resistance was demonstrated in the tested E. coli isolates, especially β-lactam resistance which may be caused by their ESBL production. It may be said that the peptide spectrum located at 9714, and 9063 Da were suspected as the ESBL indicative peptide spectrum in the high ESBL producers, and as the Dps indicative peptide spectrum in the high ciprofloxacin-resistant isolates.
Keywords: Peptide spectra analysis, DNA starvation/stationary phase protection like protein, Hospital-acquired infection, Extended spectrum β-lactamase, Escherichia coli, Matrix-Assisted Laser Desorption Ionization-Time Of Flight
Funding: This work was supported by the Faculty of Medicine, Chiang Mai University, grant No. 4-2565.
Citation: Daoaroonkiet, P., Kwangsukstith, S., Srichai, S., Jaidee, S., Emthanom, M., Sujitpiriyakit, P., Sastraruji, T., Sookkhee, S., 2023. Peptide spectra analysis of DNA starvation/stationary phase protection-like protein found in hospital-acquired ESBL producing Escherichia coli by MALDI-TOF technique. Nat. Life Sci. Commun. 22(2): e2023032.
INTRODUCTION
With the spread of antibiotic resistance, rapid diagnosis to indicate the mechanism of antibiotic resistance has been important for eradicating the causative pathogens. The most common pathogen is Escherichia coli, especially Extended-Spectrum β-Lactamase producing E. coli (ESBL-EC). It is the major cause of urinary tract infection (UTI), affecting the urinary bladder, urethra, and kidneys (Flores-Mireles et al., 2015). Although this infection could be treated with the drugs of choice, aminoglycoside, and polymyxin, this pathogen still produces Extended-Spectrum β-Lactamase (ESBL) and/or other mechanisms and transfers the ESBL and/or other antibiotic-resistance genes to other bacteria. In the past, UTIs were easily cured by antibiotics. However, inappropriate use of antibiotics has led to the worldwide emergence of antibiotic-resistant strains of E. coli (Cantón et al., 2011), resulting in an increased mortality rate due to difficulties in treating UTIs. ESBL produced by E. coli can degrade the β-lactam rings which is the component of penicillin, cephalosporin, and monobactam groups. Therefore, fluoroquinolone is frequently used to treat ESBL-EC infection instead (Wiener et al., 2015). Nevertheless, it was found that the rate of fluoroquinolone resistance has significantly increased among ESBL-EC but not in non-ESBL-EC (Hirakata et al., 2005; National Antimicrobial Resistance Surveillance Center, 2019; Talan et al., 2016). There are several mechanisms of fluoroquinolone resistance, such as mutation of genes on target enzyme, efflux upregulation, decreased porin protein, plasmid-mediated quinolone resistance (PMQR) via qnr gene (Redgrave et al., 2014), and DNA starvation/stationary phase protection (Dps) protein expression (Alhajouj et al., 2020; Pinto et al., 2010).
After proteomically identified by liquid chromatography coupled with tandem mass spectrometry (LC-MS/MS) in the previous study (Sookkhee et al., 2017), a 19-kDa protein resembling the Dps-like protein produced by E. coli O157:H7 and E. coli B7A was detected in high ciprofloxacin-resistant strains of ESBL-EC that were exposed to various concentrations of ciprofloxacin. This protein may be responsible for protecting E. coli when exposed to stressors such as ciprofloxacin, nutritional stress, ultraviolet radiation, gamma radiation, or thermal stress (Wolf et al., 1999). It protects DNA from stressors by promoting DNA condensation and reducing the formation of reactive oxygen species (Karas et al., 2015). Lately, a new technique, Matrix-Assisted Laser Desorption Ionization-Time Of Flight (MALDI-TOF), is performed to identify the pathogen species, and identify antibiotic-resistant proteins or peptides to be less time-consuming, less expensive, and more precise compared to the conventional method. VITEK® Mass Spectrometry (VITEK® MS) apparatus, which uses the MALDI-TOF technique, was recently carried out for routine in vitro diagnosis (IVD) in hospitals in Thailand. Moreover, VITEK® MS has been applied to analyze the proteins in specific peptide spectra of antibiotic resistance (Clark et al., 2013). However, there are no reports on this technique being used to analyze the peptide spectra in ESBL-EC after previous exposure to ciprofloxacin. In the present study, the objectives were to investigate the significant peptide spectra after exposure to ceftazidime (CAZ) compared with amoxicillin/clavulanic acid (AMC), and with ciprofloxacin (CIP) according to ESBL production and minimal inhibitory concentration of ciprofloxacin (MICCIP) for suspected ESBL indicative peptide spectrum, and as the Dps indicative peptide spectrum.
MATERIALS AND METHODS
Bacterial Populations
The sample size was calculated with G*Power program version 3.1.9.4 by analysis of variance (F-tests) with a priori power analysis (McCrum-Gardner, 2010). The significance level (α) was determined at 0.05. The calculated sample size was at least 66 isolates. Two hundred and twenty-eight non-duplicated E. coli isolates were randomly collected from the positive urine-cultured MacConkey plates at the Diagnostic Laboratory Unit, Maharaj Nakorn Chiang Mai Hospital, Chiang Mai, Thailand in 2019-2020. These collected isolates were grown on MacConkey’s agar and incubated at 37°C for 18-24 hours. The colonies that appeared as lactose fermenters were further biochemically identified. E. coli would exhibit A/AG (Glucose, lactose, and/or sucrose fermenter with gas production) in a Triple Sugar Iron tube. Gram stain, motility test, catalase test, indole production test, urease test, and utilization of citrate were also conducted. The colonies that were confirmed as E. coli were inoculated in Tryptic Soy Broth supplemented with 20% glycerol and were kept in a -80°C freezer at the Department of Microbiology, Faculty of Medicine, Chiang Mai University until further use. E. coli strains ATCC25922 and ATCC8739 were used as the standard control strains.
Antibiotic Susceptibility
The Kirby-Bauer assay of agar disk diffusion technique was performed to determine the antibiotic susceptibility of each E. coli isolate according to CLSI guideline 2020 (Clinical Laboratory Standards Institute, 2020). Briefly, a single colony of each isolate was inoculated in Müeller Hinton Broth (MHB), adjusting the turbidity to McFarland standards No. 0.5. It was later swabbed on Müeller Hinton Agar (MHA) and antibiotic disks were placed then incubated at 37°C for 18-24 hours. Diameter of the inhibition zone of each isolate to thirteen antibiotics including amoxicillin/clavulanic acid (AMC, 20/10 µg/disk), ampicillin (AMP, 10 µg/disk), cefoxitin (FOX, 30 µg/disk), ceftazidime (CAZ, 30 µg/disk), cefotaxime (CTX, 30 µg/disk), piperacillin/ tazobactam (PTZ, 100/10 µg/disk), imipenem (IPM, 10 µg/disk), meropenem (MEM, 10 µg/disk), doripenem (DOR, 10 µg/disk), kanamycin (K, 30 µg/disk), gentamicin (CN, 10 µg/disk), ciprofloxacin (CIP, 5 µg/disk), and tetracycline (TE, 30 µg/disk) was measured and interpreted according to the CLSI guideline 2020. Among 13 antibiotics, the multidrug-resistant isolates were categorized that exhibited the numbers of antibiotic susceptibility less than seven drugs and then assumed to be called resistant group while the isolates were also categorized and called the susceptible or intermediate resistant groups if they exhibited the numbers of antibiotic susceptibility more than ten, or eight-nine drugs, respectively.
Detections of ESBL Production
According to the recommendation by CLSI guideline 2020 as described above, ESBL production can be detected by using Double Disk Synergy Test (DDST). A single colony of E. coli from the resistant group was done with Kirby-Bauer assay as described above before placing the AMC disk at 30 mm apart from CTX and CAZ disks and then incubated at 37°C for 18-24 hours. The inhibition zone and the keyhole phenomenon that appeared between AMC with CTX or/and with CAZ were observed. ESBL production was screened according to their CTX and CAZ susceptibilities. The keyhole phenomenon was also focused on ESBL production.
Subpopulations of ESBL-EC were categorized by using the Epsilometer test (E-test). A colony was inoculated in MHB, then the turbidity was adjusted to McFarland standards No. 0.5 and swabbed on MHA. The E-test strip containing the gradient concentration of CAZ was placed at one end and ceftazidime/clavulanic acid (CAZ/Clav) at the other end. They were incubated and MIC levels of both sides were obtained. MIC ratio was then calculated between CAZ and CAZ/Clav. If the MIC ratio was lower than eight-fold, the result was interpreted as non-ESBL production (ESBLN). If the MIC ratio was greater or equal to eight-fold, it was assumed to be categorized as low ESBL production (ESBLL), while MIC ratio was greater or equal to 250-fold, it was assumed to be categorized as high ESBL production (ESBLH), according to our laboratory criteria which were modified from Division of Central Laboratory, Maharaj Nakorn Chiang Mai Hospital, Chiang Mai, Thailand.
Ciprofloxacin Susceptibility
According to our laboratory criteria which were modified from the Division of Central Laboratory, Maharaj Nakorn Chiang Mai Hospital, Chiang Mai, Thailand, MICCIP levels of each ESBL-EC isolate was also determined by using E-test as described above with CIP E-strip. Results were interpreted into four groups namely the high CIP resistant (CIPHR), low CIP resistant (CIPLR), CIP intermediate resistant (CIPINTR), and CIP susceptible (CIPSUS) groups. If the MIC level is > 8 µg/ml, it was classified as CIPHR isolate, while MIC levels ≥ 4 µg/ml and ≤ 8 µg/ml were classified as CIPLR isolate. CIPINTR and CIPSUS isolates had MIC levels of 1 - 4 µg/ml and ≤ 1 µg/ml, respectively.
Peptide Preparation of MALDI-TOF Technique
Kirby-Bauer assay was performed to expose ESBL-EC to antibiotics as described above. CIP, AMC, and CAZ disks were placed on MHA which was swabbed with each culture at McFarland standards No. 0.5. Then the plate was incubated at 37°C for 18-24 hours. Each exposed area as shown in Figure 1 was collected for further peptide preparation on VITEK® MS-DS Target Slide (Biomerieux, Marcy l’Etoile, France). The culture of E. coli ATCC8739, carried out as the standard control, was spotted on the calibrator well on this slide. Next, 1 µL of alpha-cyano-4-hydroxycinnanic acid (CHCA) matrix (Biomerieux, Marcy l’Etoile, France) was dropped into each well of VITEK® MS-DS Target Slide. Once all wells were dried, the slides were placed into the VITEK® MS apparatus (Biomerieux, Marcy l’Etoile, France). The MALDI-TOF technique was performed by using a laser frequency of 50 Hz, laser wavelength of 337 nm, ion source voltage of 20 kV, and lens voltage of 6 kV. The mass and spectra intensities of each tested well were exhibited. Spectra analysis was further carried out to determine the significant peptide.
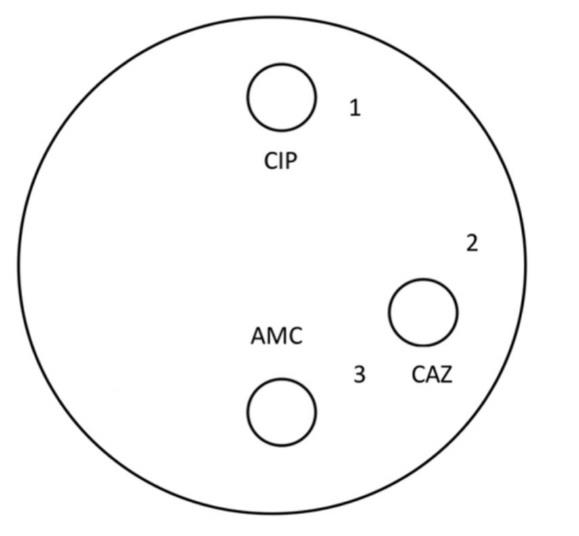
Figure 1. The positions of the collected spots of each culture with the exposure areas: 1) CIP-exposed area, 2) CAZ-exposed area, and 3) CAZ and AMC-exposed area.
Spectra Analysis
Peptide spectra from all tested wells of each ESBL-EC isolate were analyzed. The normality of the data was initially analyzed by the Shapiro-Wilk test. As shown in Figure 1, the significant difference in spectra intensity between the CAZ-exposed area (Area 3) and CAZ and AMC-exposed area (Area 2) was calculated by using the paired t-test. This significant difference indicated the presence of ESBL production. In the present study, it was called the ESBL peptide spectra. According to our previous report, the presence of Dps-like protein was revealed in the culture of CIPHR isolates namely 8/14, 21/7, 23/9, 24/5, and 26/40. In contrast, the absence of Dps protein was found in the culture of CIPSUS isolates namely 23/5, 23/48, and ATCC25922. In the present study, the peptide spectra of these isolates, CIPHR and CIPSUS isolates were also tested. Dps indicative peptide spectra of these isolates were determined. The significant difference in spectra intensity compared between the CIP-exposed and non-CIP-exposed areas (Areas 1 and 2 shown in Figure 1) were analyzed by using paired t-test. Peptide spectra that demonstrated the significant difference only in CIPHR E. coli were suspected as Dps peptide spectra.
Dps Peptide Spectra Analysis
To determine the presences of Dps peptide spectra in three groups of ESBL production, and three groups of CIP resistance, the significant difference in Dps spectra intensity compared between the CIP-exposed and non-CIP-exposed (or CAZ-exposed) areas (Areas 1 and 2 shown in Figure.1) were analyzed by using paired t-test among the ESBLH, ESBLL, and ESBLN groups, and CIPHR, CIPL, and CIPINTR+SUS groups. The prevalence of Dps peptide spectra exhibited in CIPHR and CIPLR groups was also determined.
RESULTS
Antibiotic susceptibility
Among 228 E. coli isolates, 51 (22.37%), 40 (17.54%), and 137 (60.09%) isolates were categorized into three groups including susceptible (S), intermediate resistant (I), and multidrug-resistant (R), respectively, according to their susceptibility toward 13 antibiotics. Apart from nine antibiotics, all isolates were susceptible to four antibiotics namely MEM, K, CN, and DOR. Only the isolates resistant to at least six antibiotics, considered to multidrug-resistant, and categorized in the multidrug-resistant group were selected to further determine ESBL production. According to Table 1, the most common antibiogram (12.28%) were resistant to 6 of 13 antibiotics, except PTZ, IPM, MEM, CN, K, CIP, and DOR. Due to not being ESBL substrates, therefore, these antibiotics were not affected by ESBL. CIP is a fluoroquinolone. MEM and IPM are carbapenems. CN and K are aminoglycosides. PTZ is piperacillin combined with tazobactam.
Among 13 antibiotics, AMP and CTX were the most resisted drugs with percentages of 84.21% and 83.77%, 100% and 100%, and 100% and 96.61% among total, ESBLH, and ESBLL isolate, respectively. TE was also found as the third most resisted drug with resistance percentages of 75.00%, 97.01%, and 62.71% among total, ESBLH, and ESBLL isolates, respectively. The results are demonstrated in Figure 2. While none of the isolates were susceptible to four agents including MEM, CN, K, and DOR.
Table 1. Antibiograms of all tested isolates toward 13 antibiotics. Number of drugs susceptibility, groups, and % prevalence arranged descendingly according to % prevalence.
|
Antibiograms |
No. of susceptible drugs |
Group |
%(N) |
|
AMPR FOXR CTXR CAZR AMCR PTZS IPMS MEMS CNS KS CIPS DORS TER |
7 |
R |
12.28 (28) |
|
AMPR FOXR CTXR CAZR AMCR PTZR IPMS MEMS CNS KS CIPR DORS TER |
5 |
R |
11.84 (27) |
|
AMPR FOXR CTXR CAZR AMCR PTZS IPMS MEMS CNS KS CIPR DORS TER |
6 |
R |
8.33 (19) |
|
AMPR FOXS CTXR CAZR AMCR PTZS IPMS MEMS CNS KS CIPR DORS TER |
7 |
R |
4.82 (11) |
|
AMPR FOXS CTXR CAZS AMCS PTZR IPMS MEMS CNS KS CIPR DORS TER |
8 |
I |
4.82 (11) |
|
AMPR FOXS CTXR CAZS AMCS PTZR IPMS MEMS CNS KS CIPS DORS TER |
9 |
I |
4.82 (11) |
|
AMPR FOXS CTXR CAZS AMCS PTZS IPMS MEMS CNS KS CIPS DORS TES |
11 |
S |
4.39 (10) |
|
AMPR FOXR CTXR CAZR AMCS PTZS IPMS MEMS CNS KS CIPR DORS TER |
7 |
R |
3.95 (9) |
|
AMPS FOXS CTXS CAZS AMCS PTZS IPMS MEMS CNS KS CIPS DORS TER |
12 |
S |
3.95 (9) |
|
AMPR FOXS CTXR CAZR AMCR PTZS IPMS MEMS CNS KS CIPS DORS TER |
8 |
I |
3.51 (8) |
|
AMPS FOXS CTXS CAZS AMCS PTZS IPMS MEMS CNS KS CIPS DORS TES |
13 |
S |
3.51 (8) |
|
AMPR FOXR CTXR CAZR AMCR PTZR IPMS MEMS CNS KS CIPS DORS TER |
6 |
R |
3.07 (7) |
|
AMPR FOXR CTXR CAZS AMCR PTZR IPMS MEMS CNS KS CIPR DORS TES |
7 |
R |
3.07 (7) |
|
AMPR FOXS CTXS CAZS AMCS PTZS IPMS MEMS CNS KS CIPR DORS TER |
10 |
S |
3.07 (7) |
|
AMPR FOXR CTXR CAZR AMCR PTZS IPMS MEMS CNS KS CIPR DORS TES |
7 |
R |
2.63 (6) |
|
AMPR FOXS CTXR CAZR AMCR PTZS IPMR MEMS CNS KS CIPR DORS TES |
7 |
R |
2.63 (6) |
|
AMPS FOXS CTXR CAZR AMCS PTZS IPMS MEMS CNS KS CIPS DORS TER |
10 |
S |
1.75 (4) |
|
AMPR FOXR CTXR CAZR AMCR PTZR IPMS MEMS CNS KS CIPR DORS TES |
6 |
R |
1.32 (3) |
|
AMPS FOXS CTXS CAZS AMCS PTZS IPMS MEMS CNS KS CIPR DORS TER |
11 |
S |
1.32 (3) |
|
AMPR FOXR CTXR CAZR AMCR PTZR IPMR MEMS CNS KS CIPR DORS TER |
4 |
R |
0.88 (2) |
|
AMPR FOXR CTXR CAZS AMCR PTZS IPMS MEMS CNS KS CIPR DORS TER |
7 |
R |
0.88 (2) |
|
AMPR FOXS CTXR CAZR AMCR PTZS IPMS MEMS CNS KS CIPS DORS TES |
9 |
I |
0.88 (2) |
|
AMPS FOXS CTXS CAZS AMCS PTZS IPMS MEMS CNS KS CIPR DORS TES |
12 |
S |
0.88 (2) |
|
AMPR FOXR CTXR CAZR AMCR PTZR IPMR MEMS CNS KS CIPR DORS TES |
5 |
R |
0.44 (1) |
|
AMPR FOXR CTXR CAZR AMCR PTZS IPMR MEMS CNS KS CIPR DORS TER |
5 |
R |
0.44 (1) |
|
AMPR FOXR CTXR CAZR AMCR PTZS IPMR MEMS CNS KS CIPR DORS TES |
6 |
R |
0.44 (1) |
|
AMPR FOXR CTXR CAZR AMCR PTZS IPMR MEMS CNS KS CIPS DORS TES |
7 |
R |
0.44 (1) |
|
AMPR FOXR CTXR CAZR AMCR PTZS IPMS MEMS CNS KS CIPS DORS TES |
8 |
I |
0.44 (1) |
|
AMPR FOXR CTXR CAZR AMCS PTZR IPMS MEMS CNS KS CIPR DORS TES |
7 |
R |
0.44 (1) |
|
AMPR FOXR CTXR CAZS AMCR PTZR IPMS MEMS CNS KS CIPR DORS TER |
6 |
R |
0.44 (1) |
|
AMPR FOXR CTXS CAZS AMCS PTZR IPMR MEMS CNS KS CIPR DORS TER |
7 |
R |
0.44 (1) |
|
AMPR FOXS CTXR CAZR AMCR PTZR IPMS MEMS CNS KS CIPR DORS TES |
7 |
R |
0.44 (1) |
|
AMPR FOXS CTXR CAZS AMCR PTZS IPMR MEMS CNS KS CIPR DORS TES |
8 |
I |
0.44 (1) |
|
AMPR FOXS CTXR CAZS AMCS PTZS IPMS MEMS CNS KS CIPR DORS TER |
9 |
I |
0.44 (1) |
|
AMPR FOXS CTXR CAZS AMCS PTZS IPMS MEMS CNS KS CIPS DORS TER |
10 |
S |
0.44 (1) |
|
AMPR FOXS CTXS CAZR AMCR PTZR IPMS MEMS CNS KS CIPR DORS TER |
7 |
R |
0.44 (1) |
|
AMPR FOXS CTXS CAZR AMCR PTZS IPMR MEMS CNS KS CIPR DORS TES |
8 |
I |
0.44 (1) |
|
AMPR FOXS CTXS CAZR AMCR PTZS IPMS MEMS CNS KS CIPR DORS TER |
8 |
I |
0.44 (1) |
|
AMPR FOXS CTXS CAZR AMCS PTZR IPMS MEMS CNS KS CIPS DORS TER |
9 |
I |
0.44 (1) |
|
AMPS FOXR CTXR CAZR AMCR PTZS IPMS MEMS CNS KS CIPR DORS TER |
7 |
R |
0.44 (1) |
|
AMPS FOXS CTXR CAZR AMCR PTZR IPMS MEMS CNS KS CIPS DORS TES |
9 |
I |
0.44 (1) |
|
AMPS FOXS CTXR CAZS AMCS PTZS IPMR MEMS CNS KS CIPR DORS TER |
9 |
I |
0.44 (1) |
|
AMPS FOXS CTXR CAZS AMCS PTZS IPMR MEMS CNS KS CIPR DORS TES |
10 |
S |
0.44 (1) |
|
AMPS FOXS CTXR CAZS AMCS PTZS IPMS MEMS CNS KS CIPR DORS TER |
10 |
S |
0.44 (1) |
|
AMPS FOXS CTXR CAZS AMCS PTZS IPMS MEMS CNS KS CIPR DORS TES |
11 |
S |
0.44 (1) |
|
AMPS FOXS CTXR CAZS AMCS PTZS IPMS MEMS CNS KS CIPS DORS TES |
12 |
S |
0.44 (1) |
|
AMPS FOXS CTXS CAZR AMCS PTZS IPMS MEMS CNS KS CIPS DORS TER |
11 |
S |
0.44 (1) |
|
AMPS FOXS CTXS CAZS AMCR PTZR IPMS MEMS CNS KS CIPS DORS TES |
11 |
S |
0.44 (1) |
|
AMPS FOXS CTXS CAZS AMCS PTZS IPMR MEMS CNS KS CIPR DORS TER |
10 |
S |
0.44 (1) |
Note: AMP, Ampicillin; FOX, Cefoxitin; CTX, Cefotaxime; CAZ, Ceftazidime; AMC, Amoxicillin/ clavulanic acid; PTZ, Piperacillin/tazobactam; IPM, Imipenem; MEM, Meropenem; CN, Gentamicin; K, Kanamycin; CIP, Ciprofloxacin; DOR, Doripenem; TE, Tetracycline; R, Resistant; S, Susceptible; R, Multidrug-Resistant group, numbers of drug susceptibility ≤7; I, Intermediate resistant group, numbers of drug susceptibility 8-9; S, Susceptible group, numbers of drug susceptibility ≥10.
Detections of ESBL Production
According to DDST, CAZ and CTX resistances, and keyhole phenomenon were detected in 159 out of 177 isolates (89.83%) in the resistant and intermediate-resistant groups. The keyhole phenomenon could be observed as the clear zone between AMC and CAZ or AMC and CTX disks. It could be interpreted that these isolates were ESBL producers. Positive results of the ESBL screening test were detected in all resistant isolates (n=137). These isolates were selected for further determination of ESBL peptide spectra.
According to the ESBL confirmation test using an E-strip test with CAZ and CAZ/clavulanic acid at opposite ends, 67 (48.91%), 59 (43.07%), and 11 (8.03%) isolates were classified as ESBLH, ESBLL, and ESBLN E. coli with MICCAZ/MICCAZ/Clav ≥ 250, 8 to 250, and ≤ 8, respectively.
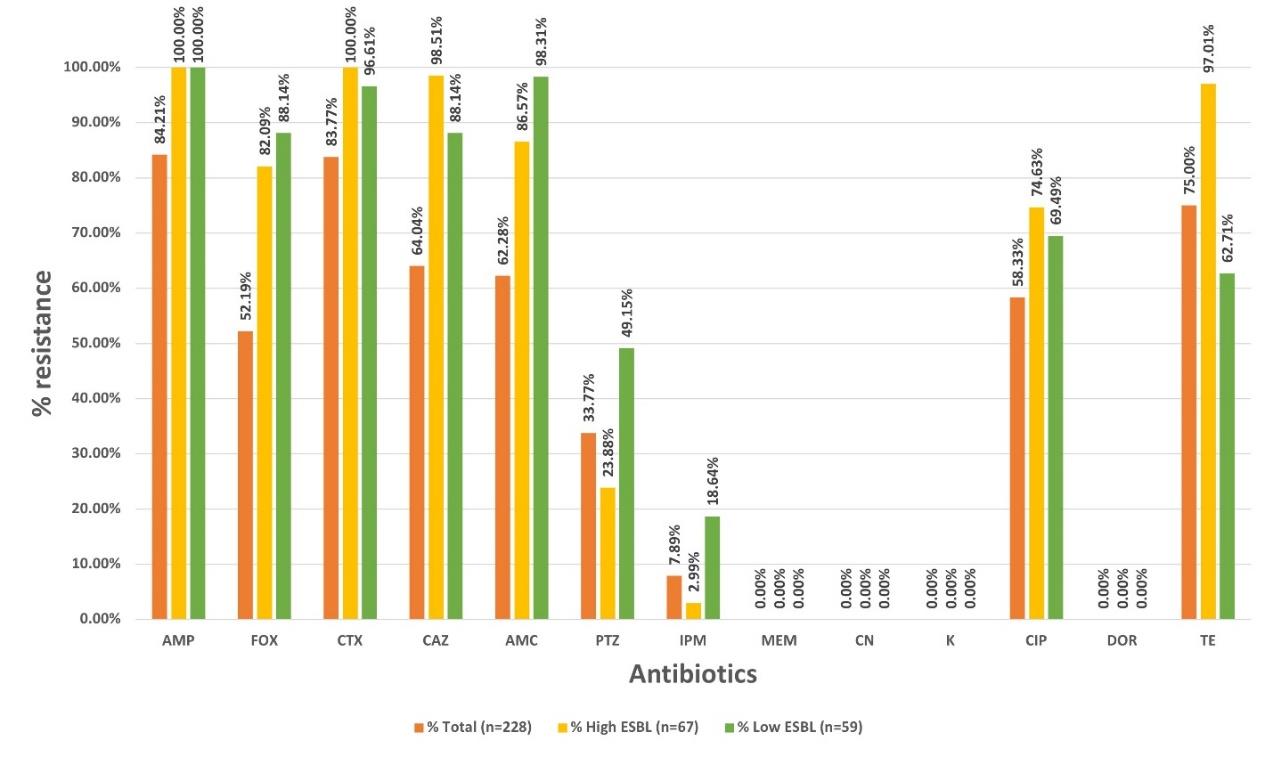
Figure 2. Percentages of resistant isolates toward 13 antibiotics in the order of total isolates (orange bar), ESBLH (yellow bar) and ESBLL (green bar) ESBL-producing groups.
Ciprofloxacin Susceptibility
All ESBLH and ESBLL E. coli according to the result of the ESBL E-strip test were then carried out to determine their CIP susceptibility using the E-strip test. Fifty-four ESBL-producing isolates with MICCIP ≥ 16 µg/mL were grouped into CIPHR ESBL-producing isolates. Fifty-seven and seven isolates were classified into CIPLR and CIPINTR groups, respectively. Only 19 isolates (13.87%) exhibited as the CIPSUS isolates. This classification was also shown in Supplemented Table 1. According to their ESBL production and CIP susceptibility, each isolate was separately plotted and categorized into nine groups as shown in Figure 3.
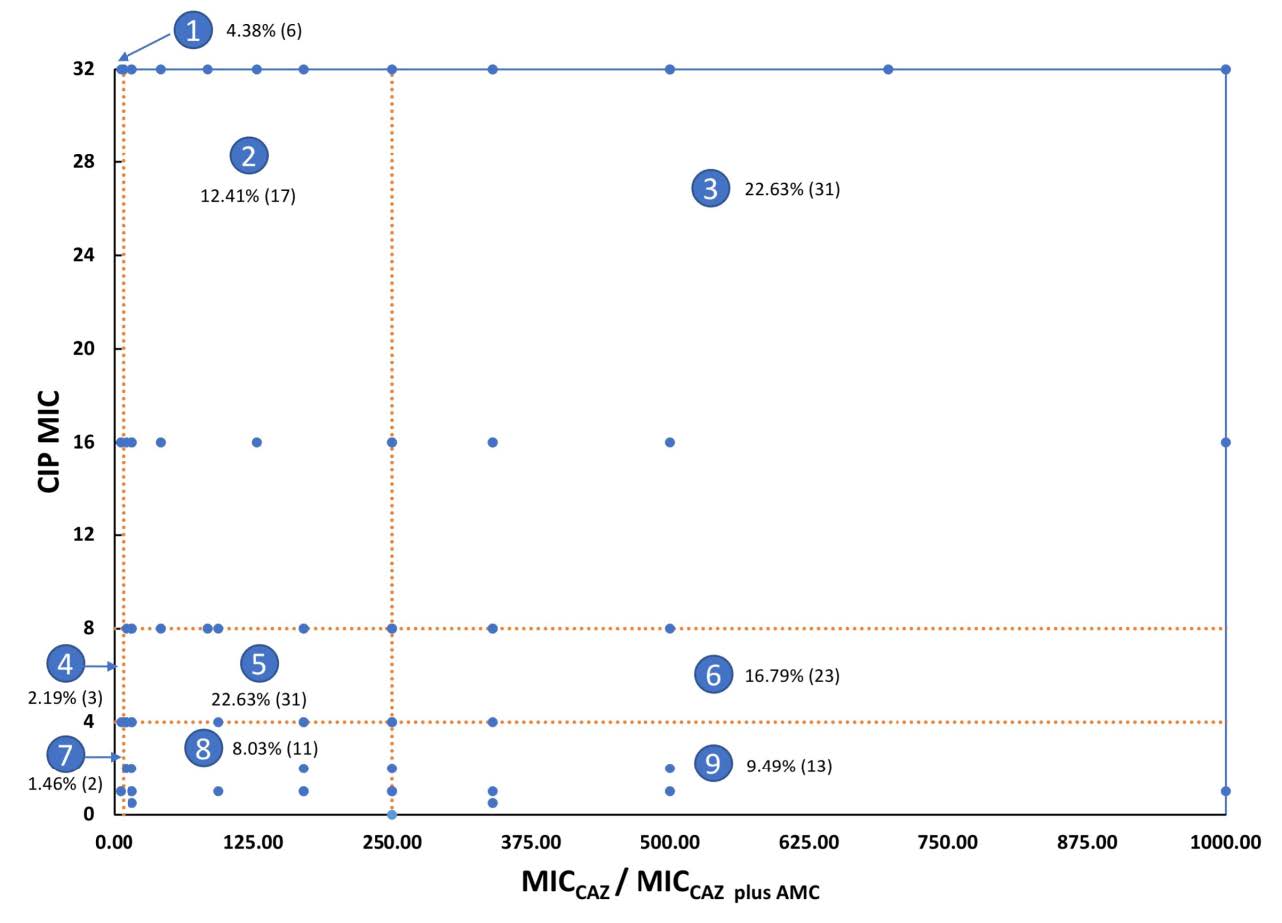
Figure 3. Distribution of 137 resistant isolates according to their MICCAZ/MICCAZ/Clav and MICCIP by categorizing them into nine groups. Each dot represents isolates that had the same values of MICCAZ/MICCAZ/Clav and MICCIP. Area 1, ESBLN, CIPHR; Area 2, ESBLL, CIPHR; Area 3, ESBLH, CIPHR; Area 4, ESBLN, CIPLR; Area 5, ESBLL, CIPLR; Area 6, ESBLH, CIPLR; Area 7, ESBLN, CIPINTR+SUS; Area 8, ESBLL, CIPINTR+SUS; Area 9, ESBL , CIPINTR+SUS.
Figure. 3 showed the distribution of nine groups of the tested isolates according to their ESBL production and CIP resistant level, MICCAZ/MICCAZ/Clav, and MICCIP, respectively. From this figure, the ESBLH and CIPHR groups, Area 3, could be suggested that the ESBL-tolerant β-lactams such as MEM and DOR, and other groups of agents such as CN should be used to treat the infection of these isolates. Details of this figure exhibit six isolates (4.38%) were ESBLN, and CIPHR (Area 1). Seventeen isolates (12.41%) were ESBLL, and CIPHR (Area 2). Thirty-one isolates (22.63%) were ESBLH, and CIPHR (Area 3). Three isolates (2.19%) were ESBLN, and CIPLR (Area 4). Thirty-one isolates (22.63%) were ESBLL, and CIPLR (Area 5). Twenty-three isolates (16.79%) were ESBLH, and CIPLR (Area 6). Two isolates (1.46%) were ESBLN, and CIPINTR+SUS (Area 7). Eleven isolates (8.03%) were ESBLL, and CIPINTR+SUS (Area 8). Thirteen isolates (9.49%) were ESBLH, and CIPINTR+SUS (Area 9). Their ESBL production and CIP susceptibility were categorized as shown in Supplemented Table 2.
Spectra Analysis
Out of 83 isolates of E. coli that were analyzed using the MALDI-TOF technique by VITEK® MS, 30, 25, and 28 isolates were ESBLH, ESBLL, ESBLN, and 27, 12, and 44 were CIPHR, CIPLR, and CIPINTR+SUS, respectively.
Considering the manner of ESBL indicative peptide spectra, the spectrum intensities of these spectra should be significantly decreased after comparing the CAZ and AMC exposed areas. Among 199 peptide spectra that were visible after being analyzed by VITEK® MS, nine peptide spectra of ESBLH isolates were selected according to the ESBL manner.
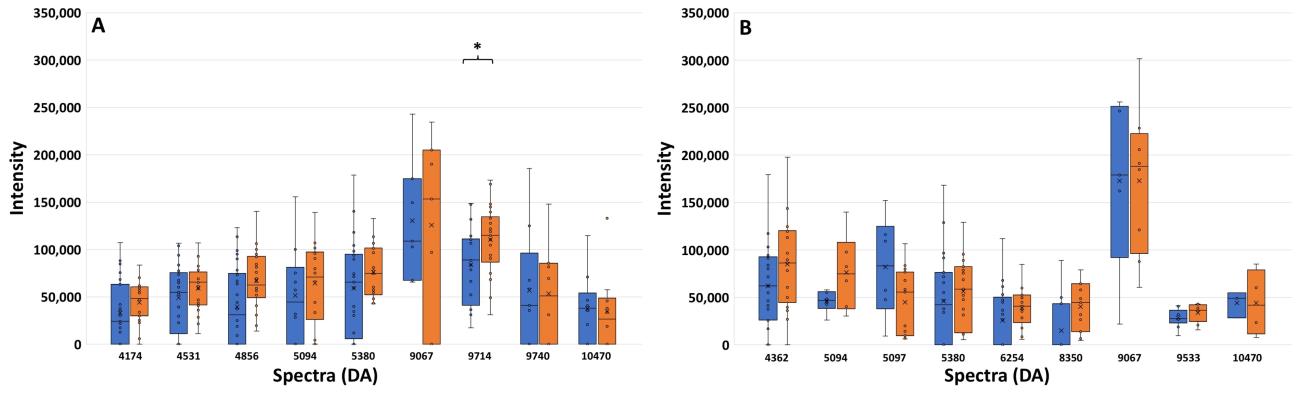
Figure 4. Spectrum intensities after exposure to AMC (blue bar) and CAZ (orange bar) of the ESBLH (A) and ESBLL (B) groups. The positive standard error of each spectrum is also shown. *, P ≤ 0.001.
They are shown in Figure 4A. A spectrum located at 9714 Da exhibited a significant difference in the spectrum intensities between these exposures as shown by the P-value of ≤ 0.001. It could be possible that the significant decrease in spectrum intensity after exposure to AMC may be caused by the destructive action of clavulanic acid toward the ESBL enzyme. This decreased manner of this spectrum after being exposed to AMC may be suggested as the characteristics of ESBL enzyme in the ESBLH isolates. From Figure 4B, ten peptide spectra of ESBLL isolates are shown. Their decreased intensities were also detected after comparing the exposure with CAZ and AMC. However, there were no peptide spectra that have a significant difference in spectra intensities.
As shown in Figure 5, only one spectrum at 9714 Da was suspected to be ESBL indicative peptide spectrum. It was lower spectrum intensity after being exposed to AMC than CAZ. Reductions of spectrum intensity between AMC-exposed and CAZ-exposed points of isolate A2C7, U438, B2D2, and U1050 were 48.14% (Δ=61440.73; 66184.62 when exposed to AMC, and 127625.4 when exposed to CAZ), 71.31% (Δ=82683.37; 33265.55 when exposed to AMC, and 115948.9 when exposed to CAZ), 38.94% (Δ=56450.8; 88536.22 when exposed to AMC, and 144987 when exposed to CAZ), and 80.58 (Δ=90575.18; 21828.19 when exposed to AMC, and 112403.4 when exposed to CAZ), respectively. The manner of the reduction of spectrum intensity at 9714 Da in four ESBLH isolates was implied as to the specific inhibition of clavulanic acid towards β-lactamase, suggesting that the manner of this spectrum could be applied to identify the ESBLH production in E. coli. Spectrum intensities of high, low, and non-ESBL producing groups were demonstrated in Supplemented Table 3.
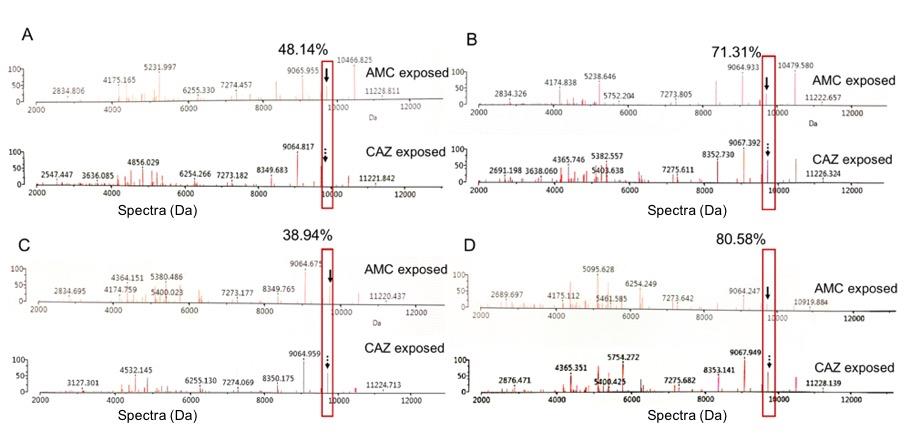
Figure 5. Comparison of the % reduction of spectrum intensity at 9714 Da between the exposure with CAZ and AMC. The suspected ESBL enzyme are shown in the red boxes and labeled with black arrows. These CIPHR isolates were A2C7 (A), U438 (B), B2D2 (C), and U1050 (D).
Dps Peptide Spectra Analysis
To analyze the peptide spectra indicating Dps among the CIPHR and CIPSUS ESBL-EC, CIPHR isolates A2D7, AA3, B2A6, T101, and CIPSUS ESBL-EC, isolates A2F2, B1B1, B2F2 were renamed from isolates 8/14, 21/7, 26/40, 23/9, and 23/48, 24/5, 23/4, respectively as shown in the previous study (Sookkhee et al., 2017). From the former results, Dps protein was demonstrated in all CIPHR isolates but not shown in all CIPSUS isolates. With VITEK®-MS, Dps suspected protein is shown in the form of peptide spectra and should be also shown in the CIPHR isolates. After being exposed to the sub-MIC of CIP, the stress proteins involved with the increased CIP concentration were expected to be demonstrated in the CIPHR isolates. It was found that there were some peptide spectra exhibited only in the CIPHR group but not in the CIPSUS group. Among the CIPHR group, the increase in spectrum intensities was significantly detected after compared between the exposure to CIP and CAZ.
Figure 6 shows the spectra intensities of six significant peptide spectra, namely 4531, 4777, 8350, 9063, 9551, and 10477 Da, selected based on the presence or absence of these spectra in four representatives of CIPHR and three representatives of CIPSUS ESBL-EC previously reported by Sookkhee et al (Sookkhee et al., 2017). Four significant spectra located at 4531, 8350, 9063, and 10477 were detected only in CIPHR isolates and absent in CIPSUS isolates, suggesting that they may play a role in the resistance to CIP. These selected spectra may be suspected as Dps-like protein as described above. In contrast, spectra 4777 and 9551 were expressed only in CIPSUS isolates and absent in CIPHR isolates. This suggested that these peptide spectra could be used to distinguish between CIPHR and CIPSUS ESBL-EC. Further statistical analysis of the spectra 4531, 8350, 9063, and 10477 should be performed for all isolates to determine if any or all of them are expressed among the CIPHR group in a statistically significant amount for the likeliest spectrum of Dps. It may be supposed that only one spectrum at 9063 Da (in red box) may be considered specific to the Dps-like protein. However, we mentioned ESBL-EC isolates for investigating the significant difference. Spectrum intensities of high, low, and non-ESBL producing groups were demonstrated in Supplemented Table 4.
Among CIPHR representative isolates as shown in Figure 6, the spectrum intensity of 4531 Da after being exposed to CIP was 106160.6, 96764.72, 90151.11, and 23079.16 for A2D7, AA3, B2A6, and T101, respectively. The intensity of 8350 Da was 49509.08, 39086.93, and 57215.58 for A2D7, AA3, and B2A6, respectively. The intensity of 10477 Da was 38647.53, 70789.87, and 38347.45, by A2D7, B2A6, and T101, respectively. Only one spectrum at 9063 Da was suspected to be Dps indicative peptide spectrum. The spectrum intensity increased after being exposed to CIP than CAZ. Their intensities were 257205.3, 199994.9, 239033.8, and 95899.94, by A2D7, AA3, B2A6, and T101, respectively. While the CIPSUS isolates, the intensity of 4777 Da were 29781.71, 31740.7, and 75675.06 for A2F2, B1B1, and B2F2, respectively. The intensity of 9551 Da was 23373.05 and 28276.13 for B1B1 and B2F2, respectively. The increase of spectrum intensity at 9714 Da in 4 CIPHR representative isolates was implied as to the specific induction of ciprofloxacin towards Dps-like protein, suggesting that this spectrum may be applied to investigate one of ciprofloxacin resistance in E. coli.
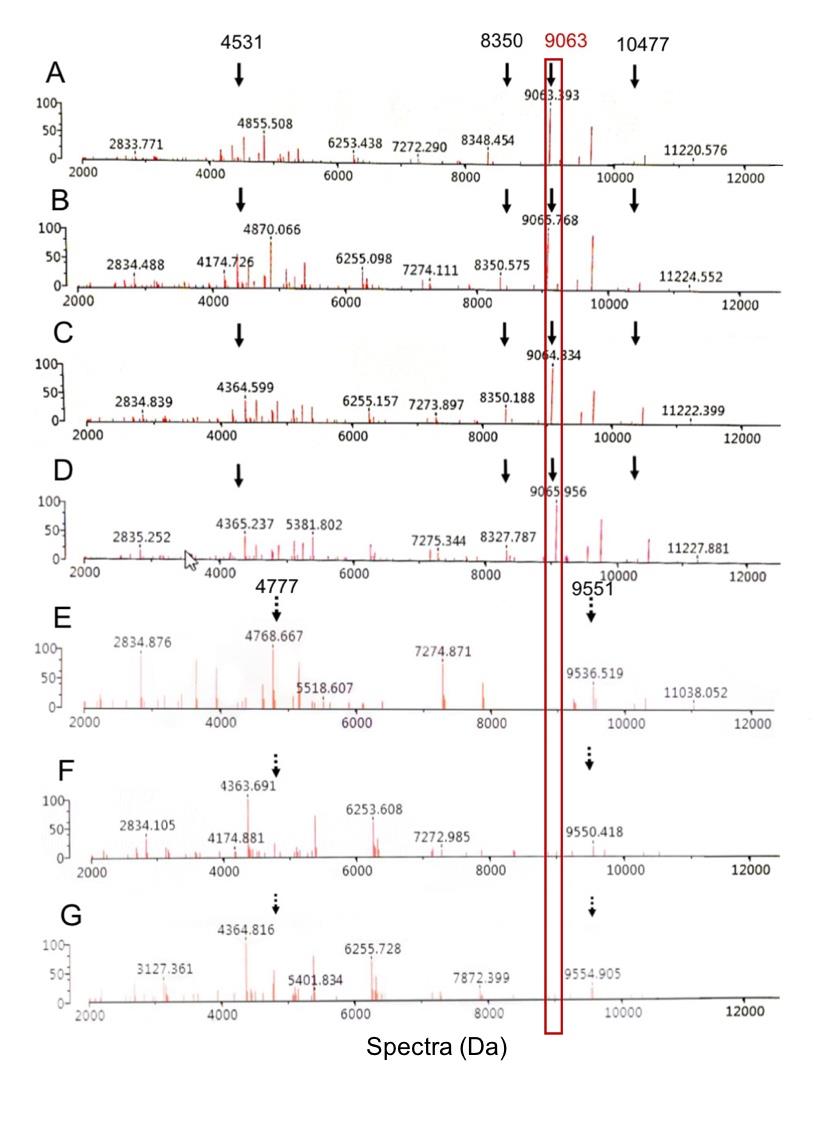
Figure 6. Comparison of 4 CIPHR isolates and 3 CIPS isolates when exposed to CIP. The % reduction of spectrum intensity at 9063 Da between the exposure with CIP and CAZ. The suspected Dps-like protein are shown in the red boxes and labeled with black solid arrows. Different spectra which were absent in the CIPHR isolates (A-D) can be detected in the CIPSUS isolates (E-G) and present as the black dotted arrows. These isolates were A2D7 (A), AA3 (B), B2A6 (C), T101 (D), A2F2 (E), B1B1 (F), and B2F2 (G).
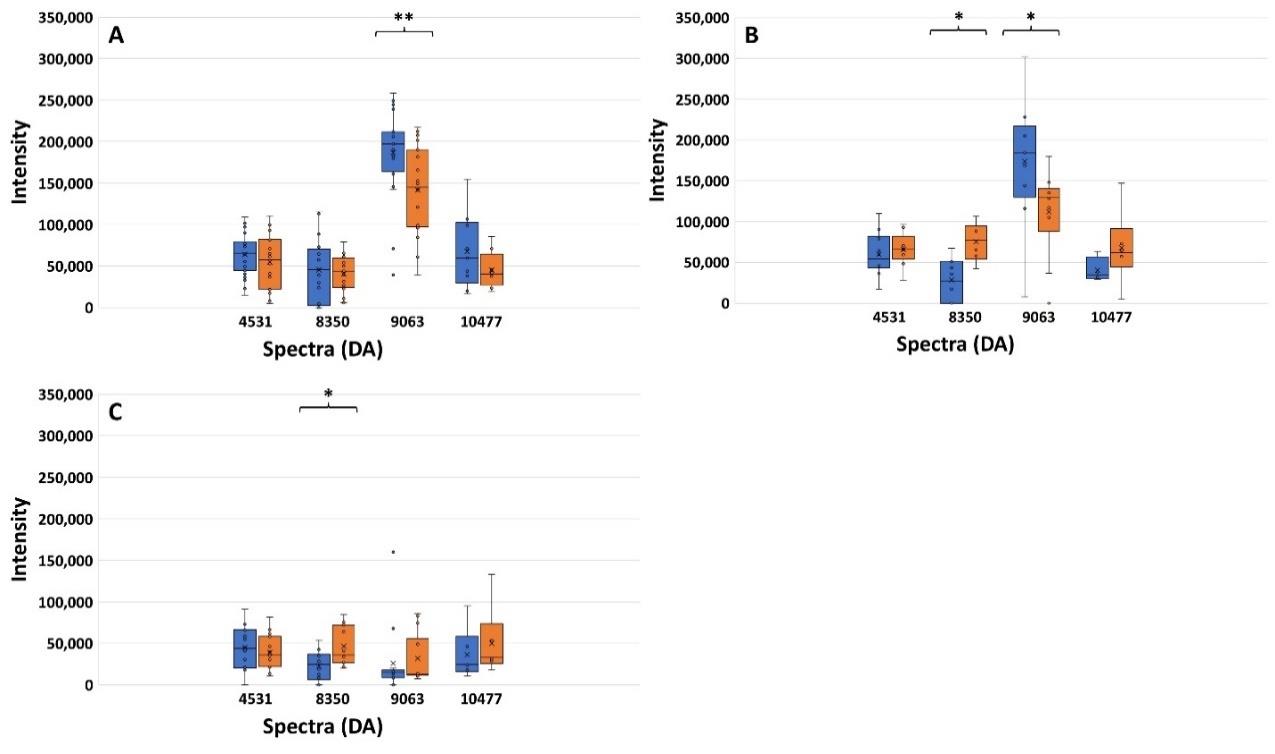
Figure 7. Spectrum intensities after exposure to CIP (blue bar) and CAZ (orange bar) of the CIPHR (A), CIPLR (B), and CIPINTR+SUS groups (C). *, P ≤ 0.05; **,P-value ≤ 0.001.
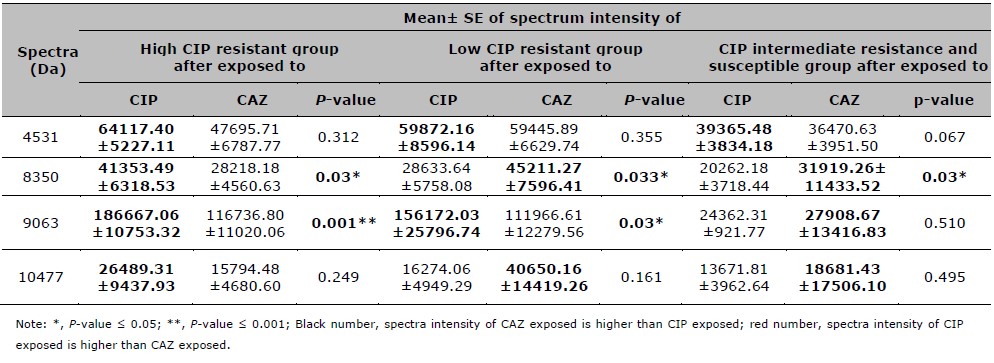
Figure 7 shows the spectrum intensities of four peptide spectra including 4531, 8350, 9063, and 10477 Da after being exposed to CIP and CAZ. From Figure 7A, the CIPHR groups, the increase of spectra intensity at 9063 Da was significantly different between the exposure of CIP compared to CAZ (P ≤ 0.001). As well as Figure 7B, the increase of spectra intensity at 9063 Da in the CIPLR groups was significantly different (P ≤ 0.05). In contrast to the spectra intensity of peptide spectrum 8350 Da, the spectrum intensity after exposure to CIP was significantly lower than the intensity after exposure to CAZ. This significant difference was also demonstrated in the CIPINTR+SUS groups. It may be suggested that the presence of spectrum 9063 Da after exposure to CIP could be used as a criterion to identify CIPHR in ESBL-EC. From the results of the previous study as described above, the peptide spectrum at 9063 Da may be suspected to be Dps protein.
From the results of Figure 8, it may be suggested that only one spectrum at 9063 Da was suspected to be Dps protein. The spectrum intensity was higher after being exposed to CIP than CAZ. Reductions of spectrum intensity between CIP-exposed and CAZ-exposed points of isolate B1B6, B2A6, B2C2, and U1362 were 41.19% (Δ=84807.05; 205911.70 when exposed to CIP, and 121104.70 when exposed to CAZ), 40.56% (Δ=96948.31; 239033.80 when exposed to CIP, and 142085.50 when exposed to CAZ), 69.42% (Δ=110974.70; 159852.20 when exposed to CIP, and 48877.51 when exposed to CAZ), and 69.21% (Δ=112628.50; 162735.20 when exposed to CIP, and 50106.65 when exposed to CAZ), respectively.
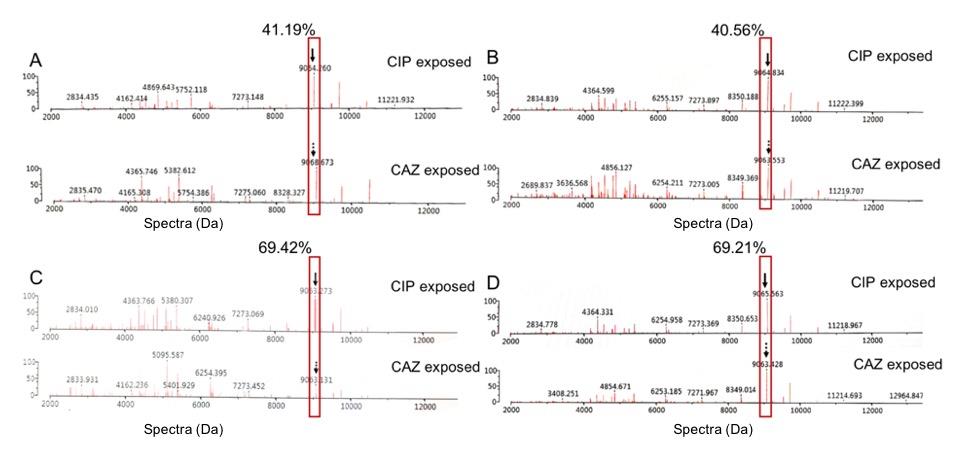
Figure 8. Comparison of the % reduction of spectrum intensity at 9063 Da between the exposure with CIP and CAZ. The suspected Dps-like protein are shown in the red boxes and labelled with black arrows. These CIPHR isolates were B1B6 (A), B2A6 (B), B2C2 (C), and U1362 (D).
DISCUSSION
β-lactams, aminoglycosides, fluoroquinolones, and tetracyclines are recommended to treat Gram-negative bacterial infections including E. coli. One of the E. coli infections in the hospital is the hospital-acquired UTI that demonstrated the occurrence of antibiotic resistance including resistance from β-lactamase production and fluoroquinolone resistance. The antibiotic susceptibility and the resistance of β-lactamase-producing strains in hospital-acquired UTIs require rapid and accurate identification for the reassessment of existing treatment protocols.
According to a previous study, ESBL-producing isolates were most resistant to ampicillin followed by ceftriaxone, cefpodoxime, cefotaxime, aztreonam, cefepime and ceftazidime (Maheshwari et al., 2016). This finding was similar to our study, which found that AMP, CTX, and TE were three of the most resisted antibiotics, while none of the isolates were resistant to MEM, CN, K, or DOR. It can be confirmed that the representative antibiotics in the aminoglycoside group, K and CN, were appropriate to be prescribed as the drug of choice for UTI due to the antibiotic resistance rates of these drugs were still low as also previously reported (Soleimani et al., 2014)
Pormohammad et al. reported the prevalence of multidrug resistance (MDR) in human, environmental, and animal E. coli isolates at 22%, 31.3%, and 5.7%, respectively (Pormohammad et al., 2019). Similarly, urine specimens in our study showed a high prevalence of the representative β-lactam and CIP resistance (n of R groups, %), thus, MDR was mentioned. CIP was one of the antibiotics used to treat E. coli. It acts by binding to bacterial DNA gyrase and/or topoisomerase IV (Hamed et al., 2018). However, the emergence of CIP resistance in ESBL-EC, particularly in UTI, has been increasing over the years as well, with MIC assessments indicating a prevalence of 43% in Thailand (Polwichai et al., 2009). Several studies reported on how E. coli, especially ESBL-EC, employed various mechanisms to resist CIP and/or other fluoroquinolones. The mechanisms of resistance include the mutation of the gyrA gene which is encoded to bacterial DNA gyrase (Weigel et al., 1998), the mutation of ParC subunits which are encoded to bacterial topoisomerase IV (Gonzalez et al., 1998), the upregulation of efflux pump (Giraud et al., 2000), the downregulation of porin protein (Coldham et al., 2006), and the use of plasmid-mediated quinolone resistance (Hamed et al., 2018). In addition, another mechanism that helps to protect bacterial cell from oxidative stress during the stationary phase while exposed to antibiotics is the production of DNA Starvation/Stationary Phase Protection Protein (Dps) (Ceci et al., 2004)., which acts as the stress protein. This stress protein was highlighted to be investigated in our laboratory. Dps-like protein was also reported in the previous study of our colleague (Sookkhee et al., 2017)as the demonstrated protein at 19 kDa found in the isolates of CIPHR and ESBLH E. coli after being exposed to sub-MIC of CIP. It possessed a high identity to Dps protein as described previously (Choi et al., 2000; Nair et al., 2004). However, this characteristic of Dps analyzed from the proteomic analysis did not provide the specific spectrum of the Dps-like protein after being analyzed by VITEK® MS. The present study would like to investigate the specific spectrum of this stress protein which is analyzed by VITEK® MS. The most common resistant mechanism of the resistance of E. coli is ESBL production, resulting in resistance to penicillins, cephalosporins, and monobactams. However, a higher prevalence of CIP resistance was statistically significant in ESBL-producing clinical isolates compared to non-ESBL-producing clinical isolates (Maheshwari et al., 2016). A study by Abera et al. (Abera et al., 2016) reported that ESBL-producing Enterobacteriaceae showed higher levels of resistance against chloramphenicol, cotrimoxazole and CIP than non-ESBL producers (P = 0.001). This outcome suggested that there is a possible relationship between the production of ESBL and CIP resistance. The co-existence of the two resistance mechanisms could be explained by them being transferred on the same plasmid that carried genes encoding ESBL enzymes and other resistant proteins of different antibiotics, especially CIP-resistant markers (Maheshwari et al., 2016). The higher resistance to ciprofloxacin in ESBL-producing isolates could be confirmed by ESBL-encoding genes and CIP-resistant genes, plasmid-mediated quinolone resistance (PMQR) gene, being in the same plasmid (Azargun et al., 2018). Farajzadeh Sheikh et al. reported a prevalence of qnr genes which is one of the PMQR genes as 68.29% and 95.23% of qnr S and qnr S-B genes among 58 ESBL-producing E. coli isolates, respectively (FarajzadehSheikh et al., 2019). These findings indicate a possible association between ESBL production and the presence of qnr genes. The rise of plasmids co-harboring multiple drug-resistance genes could lead to a higher prevalence of UTI (Xiong et al., 2008). A significant relationship between the presence of PMQR genes consisted of qnrA, qnrB, qnrC, qnrD, qnrS, qepA, oqxA, oqxB, and aac genes in E. coli that caused nosocomial UTI and ESBL production was also confirmed (Zaki et al., 2021). Several reports described that the close relationship between the resistance to third-generation cephalosporins and CIP can be found in other Enterobacteriaceae, since both E. coli and K. pneumoniae possess this characteristic (Paterson et al., 2000). Possibly, the relationship between resistance to third-generation cephalosporins and quinolones may also be explained by other mechanisms such as the active efflux, outer membrane protein alterations, and the presence of Dps, requiring further study. Although several studies have confirmed the co-existence of PMQR genes and other antibiotic resistances Dps-encoding gene has not yet been determined to be at plasmid or chromosome. In the present study, we mentioned the relation between the presence of Dps-like protein and high production of ESBL, hence, the localization of the Dps-encoding gene would be an interesting aspect to be further studied. In our previous study, Dps-like protein was found in high ESBL-producing isolates which also exhibited CIPHR resistance (Sookkhee et al., 2017). Hence, we hypothesized that the presence of Dps-like protein could be detected in the resistant E. coli after being analyzed by VITEK® MS. To investigate other proteins which contributed to the resistance, the lack of porin protein and encoded genes of our ESBLH isolates in this study may be further studied on cephalosporin, carbapenem and CIP resistances as same as the study on carbapenem resistance that described the isolates with loss of porin genes may be suspected to also resist carbapenem (Doumith et al., 2009).
To detect antimicrobial resistance, the five main approaches are molecular genetics analysis, biochemical methods, rapid immunoassays, electrochemical assay, and mass spectrometry. All the approaches yield high sensitivity and specificity with more than 90% in both values. However, the difference in turnaround time (TAT) is an important factor for consideration. MALDI-TOF MS, a mass spectrometry technology, not only yielded in as little TAT as 30 minutes (Oviaño et al., 2019), but also has a low cost per test (Tran et al., 2015). Apart from the identification of antimicrobial resistance, species identification and strain typing are also possible for MALDI-TOF MS. MALDI-TOF MS is also appropriate for routine laboratory In Vitro Diagnostics (IVD), as the conventional proteomic analysis is expensive and time-consuming while MALDI-TOF technique via VITEK® MS apparatus is more effective and cost-saving (Jang et al., 2018). It has become more acceptable and widespread in clinical laboratory diagnosis. This method has high sensitivity and efficiency, with the ability to analyze molecules in attomolar (10-18 mmol/liter) to femtomolar (10-15 mmol/liter) concentrations. Unlike other mass spectrometry techniques, MALDI-TOF MS uses soft ionization to ionize large molecules which are then detected and analyzed to generate a spectrum of the components based on mass-to-charge ratios. This enables MALDI-TOF MS to analyze biomolecules without fragmentation. Concerning the identification of antimicrobial resistance, MALDI-TOF MS is performed in three aspects, which are measuring antibiotics modifications caused by bacterial enzymes, analyzing the antibiotic resistance-related spectra patterns, and measuring the bacterial growth after being exposed to antibiotics. Through these methods, many antimicrobial-resistant proteins could be detected including β-lactamases, which have the most advanced in terms of detection by measuring antibiotics modifications (Hrabák et al., 2013). For the analysis of the peptide spectra approach of β-lactamases, the peptide spectrum located at 11109 Da was identified as the carbapenemase in KPC-producing Klebsiella pneumoniae (Lau et al., 2014). This spectrum was also detected in 88.2% of KPC-producing Klebsiella pneumoniae (Gaibani et al., 2016). Our experiment was the first study to use the MALDI-TOF MS technique via VITEK® MS to investigate the specific peptide spectra of ESBL and Dps-like protein in ESBL-EC after exposure to CIP to indicate the mechanism of resistance and result in the appropriate use of antibiotics.
Analysis via VITEK® MS in the present study found that some specific peptide spectra were demonstrated in significantly different levels between CAZ-exposed and CAZ and AMC-exposed areas to determine the indicative peptide spectra of ESBL, and CIP-exposed, and non-CIP exposed areas of ESBLH isolates. Statistical analysis showed that the peptide spectrum at 9714 Da was more significantly different, and this is supposedly correlated to the production of ESBL, and the peptide spectrum at 9063 Da was significantly different among CIPHR, CIPLR, CIPINTR and CIPSUS. This finding may suggest that the peptide spectrum at 9063 Da was supposed to be the suspected Dps-like protein as reported in our previous study. The further proteomic study is required to precisely confirm if this spectrum plays a role as a Dps-like protein. Although the detection of antimicrobial resistance using MALDI-TOF MS is carried out with software, VITEK® MS still lacks the software to automatically detect antimicrobial-resistant protein. Hence, if we can identify the peptide spectra which are specifically indicated for the ESBLH and Dps-like protein, it would be beneficial for the development of rapid and simple antimicrobial resistance detection by VITEK® MS in the future.
CONCLUSION
Fluoroquinolones, frequently used to treat ESBL-EC infection, are becoming more ineffective in recent years due to the emergence of multidrug-resistant strains. Although the detection of antimicrobial resistance using VITEK® MS was carried out with software, VITEK® MS cannot still automatically detect antimicrobial-resistant proteins. Identifying spectra corresponding to resistant proteins, including Dps-like protein, would be beneficial for the development of precise, accurate, and rapid antimicrobial resistance detection by VITEK® MS. In this study, the peptide spectra of hospital-acquired ESBL-EC, which were multidrug-resistant, were analyzed upon the MALDI-TOF MS technique of the VITEK® MS apparatus. Results showed the peptide spectrum located at 9714 Da was supposed to be ESBL-indicative peptide spectra, and the peptide spectrum located at 9063 Da was separately supposed to be a Dps-like protein as previously reported by our proteomic analysis in ESBL-EC. Further proteomic analysis can also be done to confirm this finding. This finding could potentially help expedite the routine laboratory diagnosis using VITEK® MS in hospitals and allow for early detection of fluoroquinolone-resistance and ESBLH.
ACKNOWLEDGMENTS
The authors would like to thank the Department of Microbiology, Chiang Mai University for providing microbiological support. We are grateful to Maharaj Nakorn Chiang Mai Hospital for providing the clinical isolates. We are also grateful to all technicians at the Diagnostic Laboratory Unit, Maharaj Nakorn Chiang Mai Hospital, Faculty of Medicine for their guidance on performing the VITEK® MS apparatus. We would also like to thank the Institutional Biosafety Committee (IBC) for approving our work done on Biosafety Level 2(CMUIBC02018/2564).
AUTHOR INFORMATION
PD participated in the proposal sending, analyzing data, and proofing the manuscript. SK participated in the proposal sending and participated in the microbiologic experiment. SSr participated in the microbiologic experiment and drafted the manuscript. SJ analyzed data and designed the figure. ME participated in the microbiologic experiment and drafted the manuscript. PS collected the bacteria and performed the VITEK® MS experiment. TS performed the statistic analysis. SSo carried out the research funding, designed the research methods, collected the bacteria, participated in the microbiologic experiment, and drafted the manuscript. All authors have read and approved the final manuscript.
CONFLICT OF INTEREST
The authors have no competing interests.
REFERENCES
Abera, B., Kibret, M., and Mulu, W. 2016. Extended-spectrum beta (β)-Lactamases and antibiogram in Enterobacteriaceae from clinical and drinking water sources from Bahir Dar City, Ethiopia. PLoS One. 11: e0166519.
Alhajouj, M.S., Alsharif, G.S., and Mirza, A.A. 2020. Impact of sequential passaging on protein expression of E. coli using proteomics analysis. International Journal of Microbiology. 2020: 2716202.
Azargun, R., Sadeghi, M.R., Soroush Barhaghi, M.H., Samadi Kafil, H., Yeganeh, F., Ahangar Oskouee, M., et al. 2018. The prevalence of plasmid-mediated quinolone resistance and ESBL-production in Enterobacteriaceae isolated from urinary tract infections. Infection and Drug Resistance. 11: 1007-1014.
Cantón, R., and Morosini, M.I. 2011. Emergence and spread of antibiotic resistance following exposure to antibiotics. Microbiology Reviews. 35: 977-991.
Ceci, P., Cellai, S., Falvo, E., Rivetti, C., Rossi, G.L., and Chiancone, E. 2004. DNA condensation and self-aggregation of Escherichia coli Dps are coupled phenomena related to the properties of the N-terminus. Nucleic Acids Research. 32: 5935-5944.
Choi, S.H., Baumler, D.J., and Kaspar, C. W. 2000. Contribution of dps to acid stress tolerance and oxidative stress tolerance in Escherichia coli O157:H7. Applied and Environmental Microbiology. 66: 3911-3916.
Clark, A.E., Kaleta, E.J., Arora, A., and Wolk, D.M. 2013. Matrix-assisted laser desorption ionization-time of flight mass spectrometry: a fundamental shift in the routine practice of clinical microbiology. Clinical Microbiology Reviews. 26(3): 547-603.
Clinical Laboratory Standards Institute. (2020). Performance Standards for Antimicrobial Susceptibility Testing (30th.). Wayne (PA): CLSI.
Coldham, N.G., Randall, L.P., Piddock, L.J.V., and Woodward, M.J. 2006. Effect of fluoroquinolone exposure on the proteome of Salmonella enterica serovar Typhimurium. Journal of Antimicrobial Chemotherapy. 58: 1145-1153.
Doumith, M., Ellington, M.J., Livermore, D.M., and Woodford, N. 2009. Molecular mechanisms disrupting porin expression in ertapenem-resistant Klebsiella and Enterobacter spp. clinical isolates from the UK. Journal of Antimicrobial Chemotherapy. 63: 659-667.
FarajzadehSheikh, A., Veisi, H., Shahin, M., Getso, M., and Farahani, A. 2019. Frequency of quinolone resistance genes among extended-spectrum β-lactamase (ESBL)-producing Escherichia coli strains isolated from urinary tract infections. Tropical Medicine and Health. 47: 19.
Flores-Mireles, A.L., Walker, J.N., Caparon, M., and Hultgren, S.J. 2015. Urinary tract infections: epidemiology, mechanisms of infection and treatment options. Nature Reviews Microbiology. 13: 269-284.
Gaibani, P., Galea, A., Fagioni, M., Ambretti, S., Sambri, V., and Landini, M.P. 2016. Evaluation of matrix-assisted laser desorption ionization-time of flight mass spectrometry for identification of KPC-producing Klebsiella pneumoniae. Journal of Clinical Microbiology. 54: 2609-2613.
Giraud, E., Cloeckaert, A., Kerboeuf, D., and Chaslus-Dancla, E. 2000. Evidence for active efflux as the primary mechanism of resistance to ciprofloxacin in Salmonella enterica serovar typhimurium. Antimicrobial Agents and Chemotherapy. 44: 1223-1228.
Gonzalez, M., Frank, E.G., Levine, A.., and Woodgate, R. 1998. Lon-mediated proteolysis of the Escherichia coli UmuD mutagenesis protein: In vitro degradation and identification of residues required for proteolysis. Genes & Development. 12: 3889-3899.
Hamed, S.M., Elkhatib, W.F., El-Mahallawy, H.A., Helmy, M.M., Ashour, M.S., and Aboshanab, K.M.A. 2018. Multiple mechanisms contributing to ciprofloxacin resistance among Gram negative bacteria causing infections to cancer patients. Scientific Reports. 8: 12268.
Hirakata, Y., Matsuda, J., Miyazaki, Y., Kamihira, S., Kawakami, S., Miyazawa, Y., et al. 2005. Regional variation in the prevalence of extended-spectrum beta-lactamase-producing clinical isolates in the Asia-Pacific region (SENTRY 1998-2002). Diagnostic Microbiology and Infectious Disease. 52: 323-329.
Hrabák, J., Chudácková, E., and Walková, R. 2013. Matrix-assisted laser desorption ionization-time of flight (maldi-tof) mass spectrometry for detection of antibiotic resistance mechanisms: from research to routine diagnosis. Clinical Microbiology Reviews. 26: 103-114.
Jang, K.S. and Kim, Y.H. 2018. Rapid and robust MALDI-TOF MS techniques for microbial identification: A brief overview of their diverse applications. Journal of Microbiology. 56: 209-216.
Karas, V.O., Westerlaken, I., and Meyer, A.S. 2015. The DNA-binding protein from starved cells (Dps) utilizes dual functions to defend cells against multiple stresses. Journal of Bacteriology. 197(19): 3206-3215.
Lau, A. F., Wang, H., Weingarten, R. A., Drake, S. K., Suffredini, A. F., Garfield, M. K., et al. 2014. A rapid matrix-assisted laser desorption ionization-time of flight mass spectrometry-based method for single-plasmid tracking in an outbreak of carbapenem-resistant Enterobacteriaceae. Journal of Clinical Microbiology. 52(8): 2804-2812.
Maheshwari, M., Yaser, N.H., Naz, S., Fatima, M., and Ahmad, I. 2016. Emergence of ciprofloxacin-resistant extended-spectrum β-lactamase-producing enteric bacteria in hospital wastewater and clinical sources. Journal of Global Antimicrobial Resistance. 5: 22-25.
McCrum-Gardner, E. 2010. Sample size and power calculations made simple. International Journal of Therapy and Rehabilitation. 17: 10-14.
Nair, S. and Finkel, S.E. 2004. Dps protects cells against multiple stresses during stationary phase. Journal of Bacteriology. 186: 4192-4198.
National Antimicrobial Resistance Surveillance Center. (2019). Antimicrobial resistance reports in Thailand from 2000-2019. Retrieved from http://narst.dmsc.moph.go.th/data/AMR 2000-2019-12M.pdf
Oviaño, M. and Bou, G. 2019. Matrix-assisted laser desorption ionization-time of flight mass spectrometry for the rapid detection of antimicrobial resistance mechanisms and beyond. Clinical Microbiology Reviews. 32: e00037-18.
Paterson, D.L., Mulazimoglu, L., Casellas, J.M., Ko, W.C., Goossens, H., Von Gottberg, A., et al. 2000. Epidemiology of ciprofloxacin resistance and its relationship to extended-spectrum beta-lactamase production in Klebsiella pneumoniae isolates causing bacteremia. Clinical Infectious Diseases. 30: 473-478.
Pinto, L., Radhouani, H., Coelho, C., Martins da Costa, P., Simões, R., Brandão, R.M., et al. 2010. Genetic detection of extended-spectrum beta-lactamase-containing Escherichia coli isolates from birds of prey from Serra da Estrela natural reserve in Portugal. Applied and Environmental Microbiology. 76: 4118-4120.
Polwichai, P., Dejsirilert, S., Panpetch, S., Sawanpanyalert, P., Aswapokee, N., and Mootsikapun, P. 2009. Antimicrobial resistance of Escherichia coli isolated from urine in Thailand from 2000 to 2005. Journal of the Medical Association of Thailand. 92 Supplies. 4: S59-67.
Pormohammad, A., Nasiri, M.J., and Azimi, T. 2019. Prevalence of antibiotic resistance in Escherichia coli strains simultaneously isolated from humans, animals, food, and the environment: A systematic review and meta-analysis. Infection and Drug Resistance. 12: 1181-1197.
Redgrave, L.S., Sutton, S.B., Webber, M.A., and Piddock, L.J. 2014. Fluoroquinolone resistance: Mechanisms, impact on bacteria, and role in evolutionary success. Trends in Microbiology. 22: 438-445.
Soleimani, N., Aganj, M., Ali, L., Shokoohizadeh, L., and Sakinc, T. 2014. Frequency distribution of genes encoding aminoglycoside modifying enzymes in uropathogenic E. coli isolated from Iranian hospital. BMC Research Notes. 7: 842.
Sookkhee, S., Khantawa, B., and Srihinkong, W. 2017. Proteomic analysis of DNA starvation/stationary phase protection proteins from extended spectrum β - lactamase producing Escherichia coli. Chiang Mai University Journal of Natural Sciences. 16: 215–230.
Talan, D.A., Takhar, S.S., Krishnadasan, A., Abrahamian, F.M., Mower, W.R., and Moran, G.J. 2016. Fluoroquinolone-resistant and extended-spectrum β-lactamase-producing Escherichia coli infections in patients with pyelonephritis, United States(1). Emerging Infectious Diseases. 22: 1594-1603.
Tran, A., Alby, K., Kerr, A., Jones, M., and Gilligan, P. H. 2015. Cost savings realized by implementation of routine microbiological identification by matrix-assisted laser desorption ionization-time of flight mass spectrometry. Journal of Clinical Microbiology. 53: 2473-2479.
Weigel, L.M., Steward, C.D., and Tenover, F.C. 1998. gyrA mutations associated with fluoroquinolone resistance in eight species of Enterobacteriaceae. Antimicrobial Agents and Chemotherapy. 42: 2661-2667.
Wiener, E.S., Heil, E.L., Hynicka, L.M., and Johnson, J. K. 2015. Are fluoroquinolones appropriate for the treatment of Extended-Spectrum β-Lactamase-producing Gram-negative bacilli? Journal of Pharmacy Technology. 32: 16-21.
Wolf, S.G., Frenkiel, D., Arad, T., Finkel, S.E., Kolter, R., and Minsky, A. 1999. DNA protection by stress-induced biocrystallization. Nature. 400: 83-85.
Xiong, Z., Wang, P., Wei, Y., Wang, H., Cao, H., Huang, H., et al. 2008. Investigation of qnr and aac(6')-Ib-cr in Enterobacter cloacae isolates from Anhui Province, China. Diagnostic Microbiology and Infectious Disease. 62: 457-459.
Zaki, M.E.S., El Salam, M.A., and Faried, O.A. 2021. Study of plasmid-mediated quinolone resistance in Escherichia coli from nosocomial urinary tract infections. Infectious Disorders - Drug Targets. 21: 243-247.
OPEN access freely available online
Natural and Life Sciences Communications
Chiang Mai University, Thailand.
Supplemented
Table 1. Data of ESBL screening result, the presence of keyhole phenomenon, the ratio of MICCAZ/MICCAZ/Clav, and the ESBL confirmation results of resistant and intermediate resistant isolates.
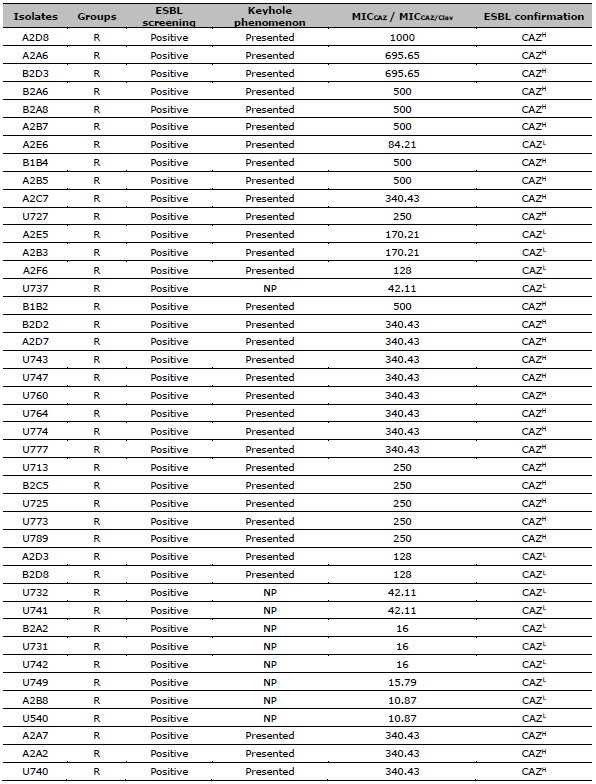
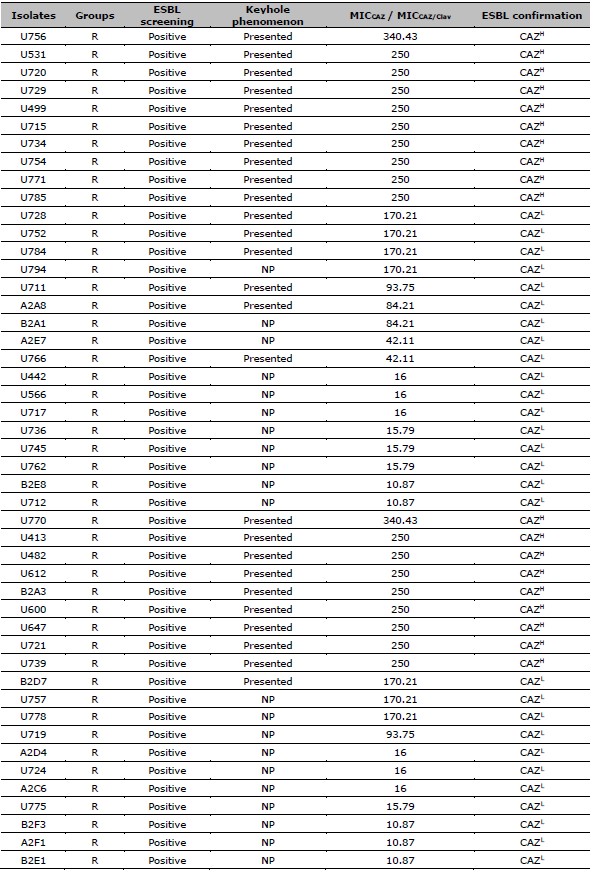
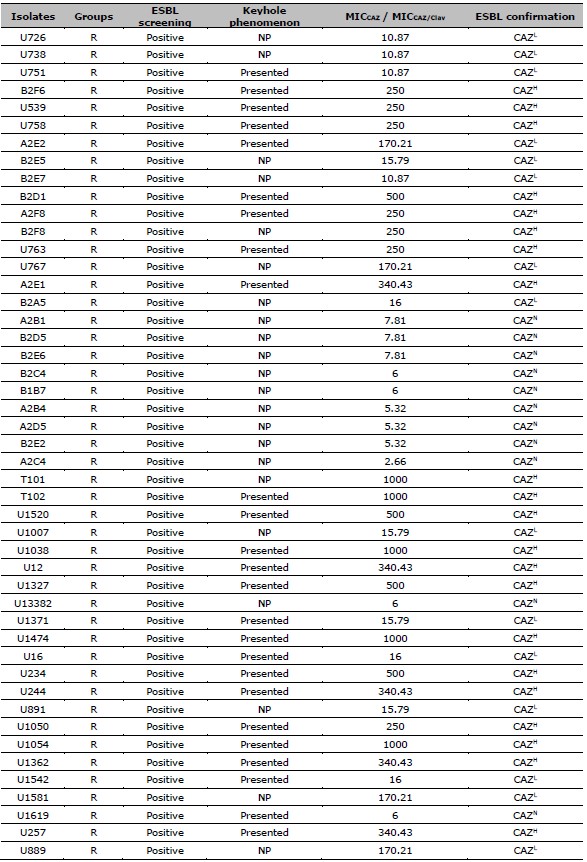
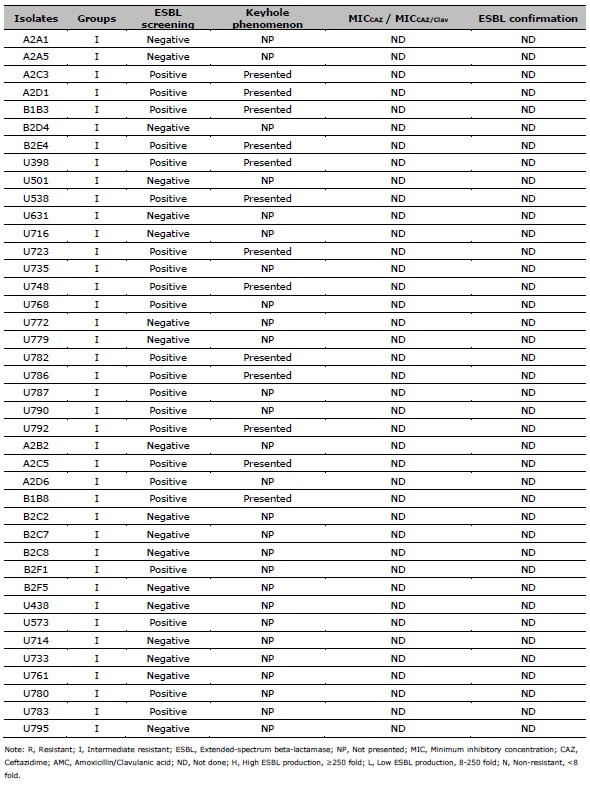
Table 2. ESBL production after exposed to CAZ, and CIP susceptibility of 137 resistant E. coli. ESBL production after exposed to CAZ is categorized by the MIC ratio between CAZ, and CAZ /Clav. CIP susceptibility is categorized by the MIC of CIP.
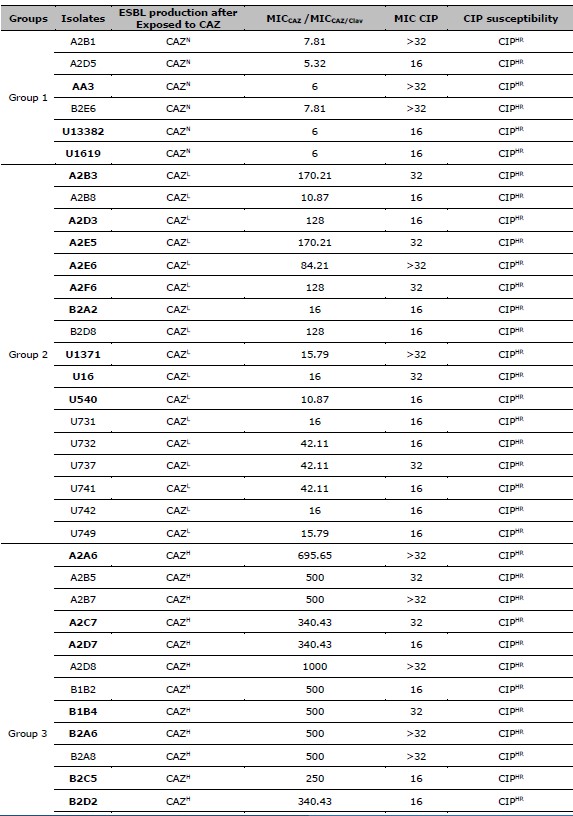
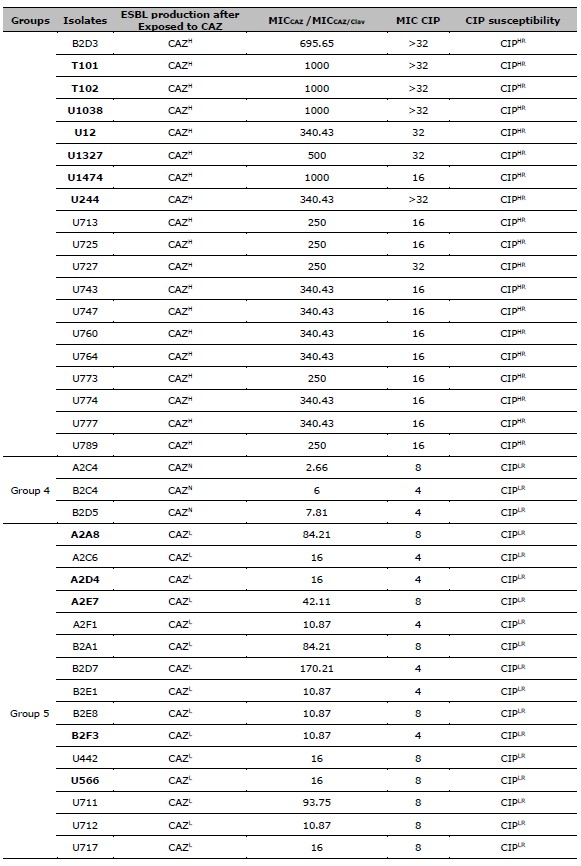
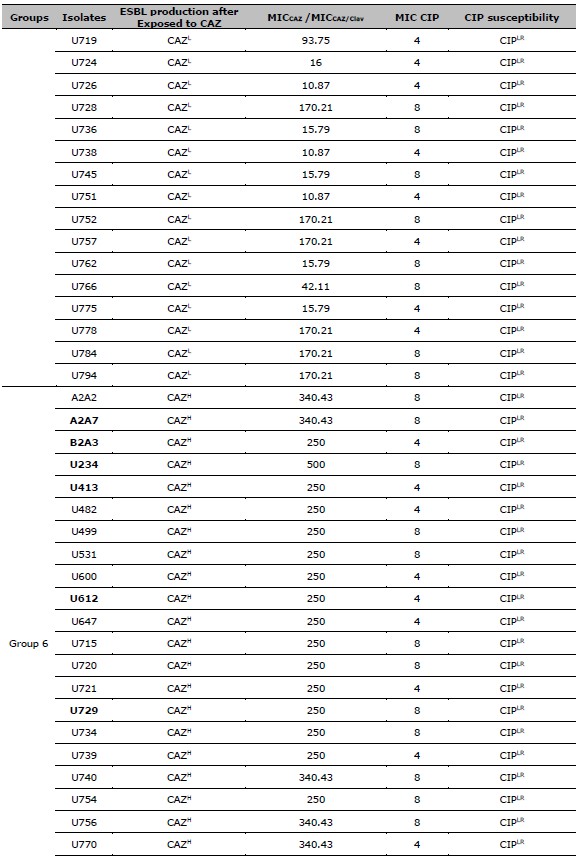
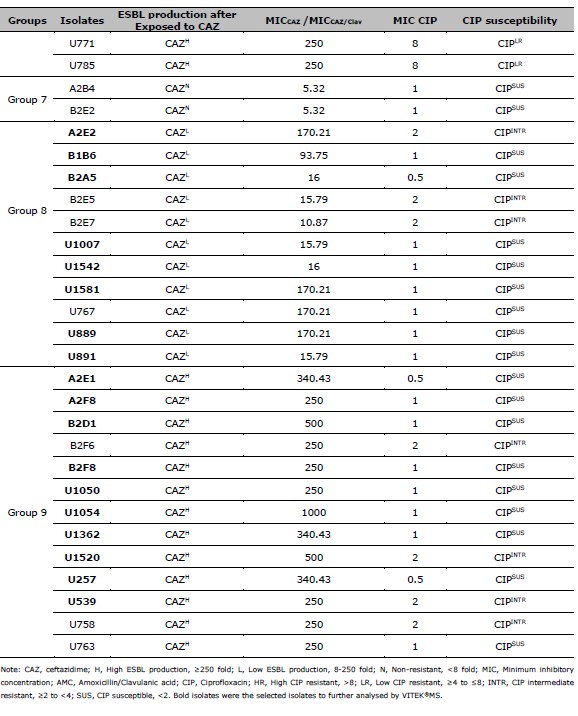
Table 3. Mean, SE, and P-values of spectra intensities after compared between the AMC and CAZ exposure in high, low, and non-ESBL producing groups.
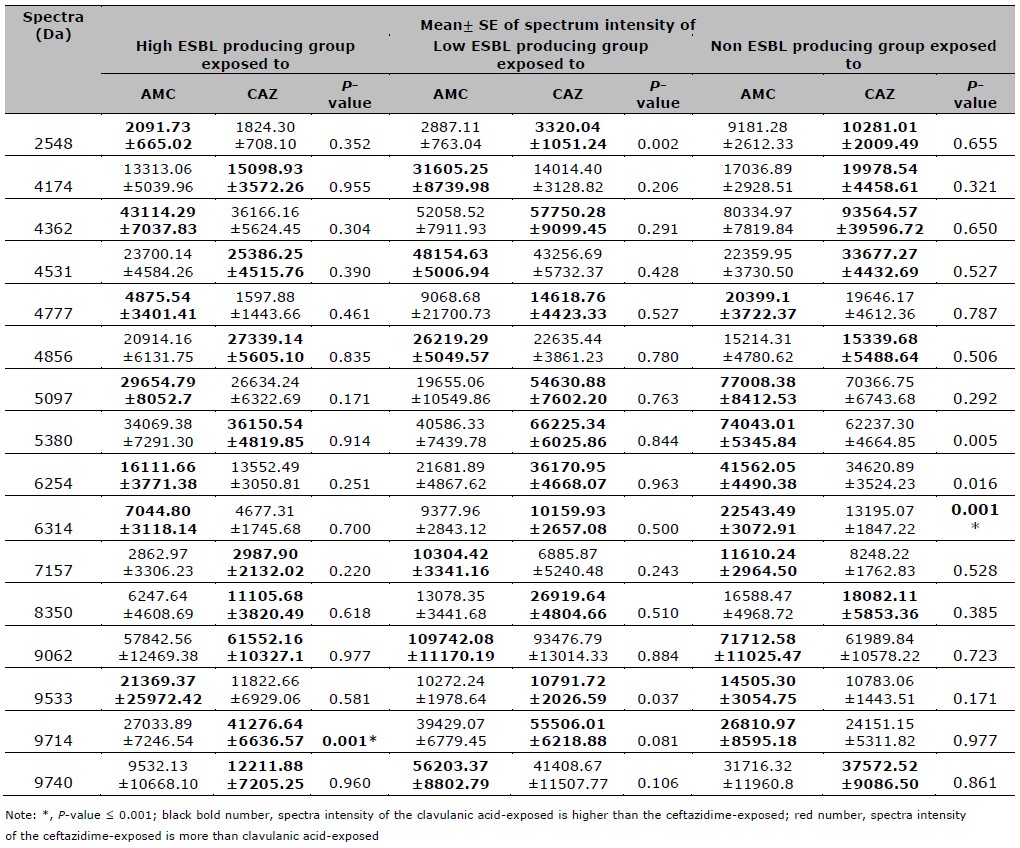
Table 4. Mean, SE, and P-value of spectra intensities after compared between the CIP and CAZ exposure in high, low, intermediate resistant, and CIP susceptible groups.
Purilarp Daoaroonkiet1, Siriaran Kwangsukstith1, Salin Srichai1, Swasamon Jaidee1, Metha Emthanom1, Pijitra Sujitpiriyakit2, Thanapat Sastraruji3, and Siriwoot Sookkhee1, *
1 Department of Microbiology, Faculty of Medicine, Chiang Mai University, Chiang Mai, 50200, Thailand.
2 Diagnostic Laboratory Unit, Maharaj Nakorn Chiang Mai Hospital, Faculty of Medicine, Chiang Mai University, Chiang Mai, 50200, Thailand.
3 Dental Research Center, Faculty of Dentistry, Chiang Mai University, Chiang Mai, 50200, Thailand.
Corresponding author: Siriwoot Sookkhee, E-mail: siriwoot.s@cmu.ac.th
Total Article Views
Editor: Veerasak Punyapornwithaya,
Chiang Mai University, Thailand
Article history:
Received: December 17, 2022;
Revised: March 16, 2023;
Accepted: March17, 2023;
Published online: March 28, 2023