 ISSN: 2822-0838 Online

Effects of Forest Restoration Age on the Species Diversity of Epiphytic Bryophyte Communities
Puwadol Chawengkul, Pranee Nangngam and Stephen Elliott*Published Date : April 3, 2023
DOI : https://doi.org/10.12982/NLSC.2023.022
Journal Issues : Number 2, April-June 2023
ABSTRACT
We examined recovery of bryophyte diversity during forest restoration by the framework species method (FSM), as a component of overall biodiversity recovery—one of the defining indicators of restoration success. The epiphytic bryophyte communities in FSM trial plots (13 and 21 years since tree planting), were compared with those of old-growth forest in the upper Mae Sa Valley, northern Thailand. Bryophytes were surveyed in June 2019, on the bark of 3 framework tree species: Archidendron clypearia, Erythrina subumbrans and Sarcosperma arboreum. Fifteen species were recorded, representing 14 genera and 12 families in 3 morphological groups: acrocarpous mosses 4 species (27%), pleurocarpous mosses 5 species (33%) and leafy liverworts 6 species (40%). Within 13 years after restoration initiation, bryophyte species richness had increased to the same level as that recorded in old-growth forest. Furthermore, the bryophyte community species composition of the older restoration forest was more similar to that of natural forest than was the bryophyte community species composition of younger forest. We conclude that the FSM effectively recovers bryophyte diversity and directs the successional trajectory of the bryophyte community towards that of old growth forest within an acceptable time span. The use of bryophytes as indicators of forest restoration progress is discussed.
Keywords: Conservation, Framework species method, Liverwort, Moss, Species richness
Funding: Chiang Mai University funded the work of SE on this project.
Citation: Chawengkul, P., Nangngam, P., and Elliott, S. 2023. Effects of Forest Restoration Age on the Species Diversity of Epiphytic Bryophyte Communities. Nat. Life Sci. Commun. 22(2): e2023022.
INTRODUCTION
Forest restoration is the direction and acceleration of ecological succession towards an indigenous reference (or target) forest ecosystem of the maximum biomass, structural complexity, biodiversity and ecological functioning that can be self-sustained within prevailing climatic and soil limitations (Elliott et al., 2013). Its success is indicated by the return of a multi-layered canopy, increasing species richness and diversity, improved soil conditions and recovery of forest dynamics, resulting in self-sustaining ecosystems (Forest Restoration Research Unit, 2005).
Epiphytic bryophytes are small, non-vascular plants, which grow on other plants without parasitizing them. Tree bark is an important habitat for them. Their taxonomic diversity on trees in forests increases with increasing tree stocking-density and tree size (Oishi, 2012).
Although they are of much lower economic value than fungi, algae or angiosperms, bryophytes are rapid colonizers of vacant micro-niches, with species that can grow at high elevations, on flooded sites and even on severely degraded sites. During ecosystem restoration, their recolonization indicates the return of moist micro-niches, particularly in tropical forests. They also add humus to micro-niches, allowing germination and establishment of other plant species (Mizuno et al., 2015), particularly vascular epiphytes in tropical forests such as ferns and orchids. Thus, they can have “knock on” effects on biodiversity recovery during restoration and have been proposed as potential indicators of forest integrity (Frego, 2007) and progress of forest restoration towards the reference condition (McDonald et al., 2016). Furthermore, they are easily surveyed, due to their small size.
Therefore, we tested the hypotheses that, as restoration progresses, the taxonomic diversity of epiphytic bryophyte communities increases, and their species composition becomes more similar to that of old-growth forest. The ultimate aim was to determine to what extent forest restoration promotes recovery of epiphytic bryophyte diversity.
MATERIALS AND METHODS
Study site
The study site comprised forest-restoration trial plots and adjacent old-growth evergreen forest (disturbed) in the upper Mae Sa Valley, Chiang Mai Province, northern Thailand (Figure 1).
The upper Mae Sa Valley lies mostly within Doi Suthep-Pui National Park (DSPNP) in Chiang Mai Province, northern Thailand, with the Hmong hill tribe communities of Ban Mae Sa Mai and Ban Mae Sa Noi (BMS) (combined population of 2,197) situated at 18°52′07.24′′ N, 98°51′08.47′′ E, 1,018 m above sea level. Along the watershed above the village, Chiang Mai University’s Forest Restoration Research Unit (FORRU-CMU) has established a chronosequence of forest restoration trial plots (18°51′46.62′′ N, 98°50′58.81′′ E, 1,200–1,325 m above sea level) to test the framework species method (FSM) of forest restoration. Plots were planted annually from 1997 to 2013 with 20–30 species of indigenous forest trees (Elliott et al., 2019). The FSM is a technique used to restore mostly tropical forest ecosystems by densely planting open sites, close to natural forest with tree species, characteristic of the reference ecosystem, and selected for their ability to accelerate ecological succession. Framework tree species are selected for their tolerance of exposed conditions, ability to inhibit herbaceous weeds and attractiveness to seed-dispersing wildlife, thus accelerating recovery of forest structure, biodiversity and ecological functioning (Goosem and Tucker, 1995; Elliott et al., 2013). The study presented here investigated the ability of three such tree species to promote recovery of one particular component of biodiversity, namely epiphytic bryophyte communities.
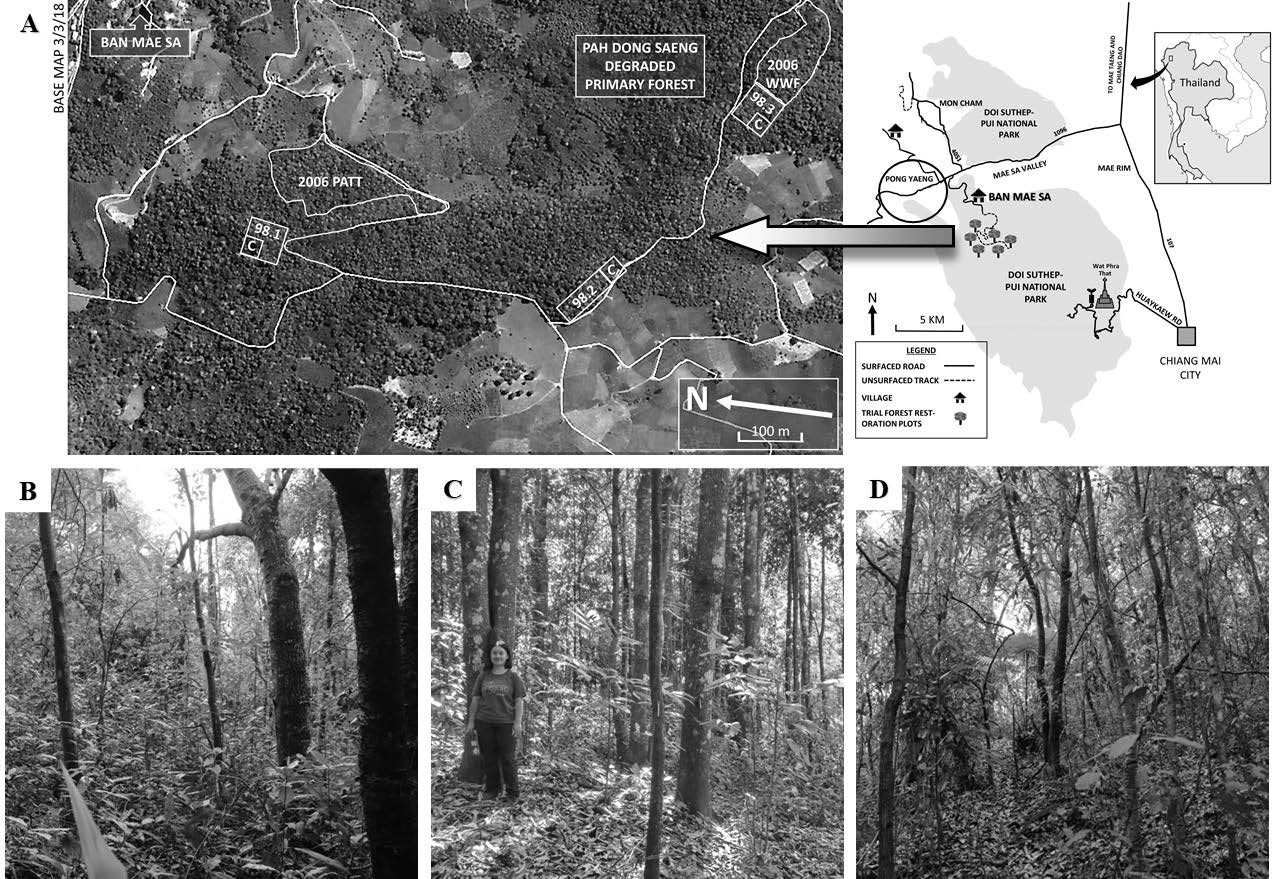
Figure 1. (A) Study site location, showing configuration of restoration trial plots (planted in 1998 and 2006) and old-growth evergreen forest (Pah Dong Saeng) in the upper Mae Sa Valley (“C” indicates non-planted control plots). (B-D) Habitat of 2006 plot, 1998 plot and Pah Dong Saeng, respectively. These plots are abbreviated to R98, R06 and PDS in the text.
The study area has two main seasons: the wet season (May–October) and the dry season (mean monthly rainfall below 100 mm, November–April). The dry season is subdivided into the cool-dry season (November–January) and the hot-dry season (February–April). Average annual rainfall, recorded at the weather station nearest to the study site at a similar altitude (Kog-Ma Watershed Research Station), was 1,736 mm (Figure 2). Extreme temperatures ranged from a minimum of 4.5 °C in December to a maximum of 35.5 °C in March.
Originally, the trial plot system area had been “Primary, Evergreen, Seasonal Forest” (EGF, sensu Maxwell and Elliott, 2001) cleared from the 1950s to the early 80s to provide land for the cultivation of cabbages, potatoes, and other cash crops. The original condition of the area was stage-3 degradation (sensu Elliott et al., 2013, Chapter 3), i.e., regenerants (remnant mature seed trees, live tree stumps capable of coppicing, tree saplings, and tree seedlings, taller than 50 cm.) at densities lower than that needed to initiate canopy closure within 2 years (<3,100/ha), mostly suppressed by dominant weeds, including Pteridium aquilinum (L.) Kuhn (Dennstaedtiaceae); Bidens pilosa L. var. minor (Bl.) Sherf; Ageratum conyzoides L.; Chromolaena odorata (L.) R.M.King & H.Rob. and Ageratina adenophora (Spreng.) R.M.King & H.Rob. (all Asteraceae); Commelina diffusa Burm. f. (Commelinaceae); and grasses, e.g., Phragmites karka (Retz.) Trin. ex Steud. (Poaceae), Imperata cylindrica (L.) Raeusch., and Thysanolaena latifolia (Roxb. ex Hornem.) Honda (all Poaceae). The nearest remnant forest, “Pah Dong Saeng” (PDS), was located 2–3 km from the plots (disturbed primary EGF, regenerating after opium poppy cultivation in small patches during the 1950–60).
Surveys of epiphytic bryophytes were carried out in June 2019 in restoration plots planted in 1998 (R98) and 2006 (R06) (21 and 13 years old, respectively, at the time of the study) and in old-growth Dong Saeng Forest (PDS) (Figure 1).
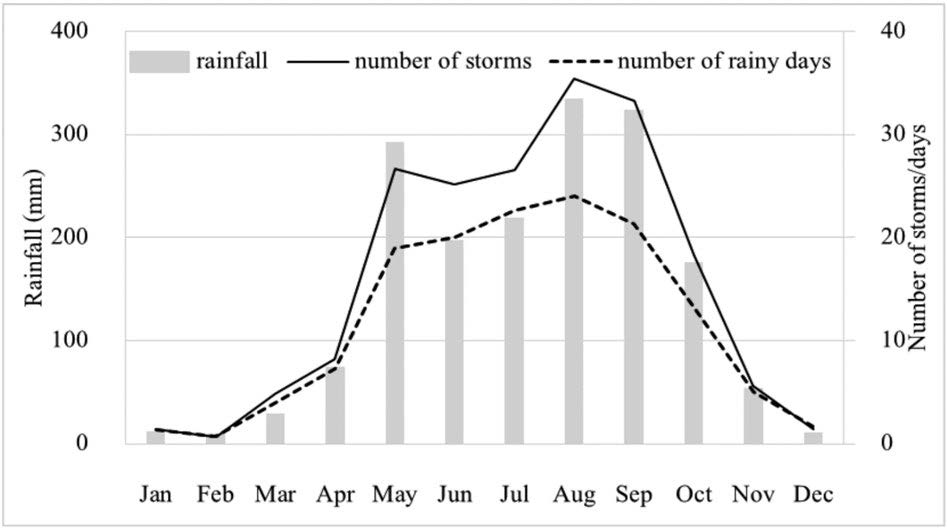
Figure 2. Mean monthly rainfall data for 1997–2013 (three tipping bucket automatic recording rain gauges at Huai Kog-Ma Watershed Research Station, Chiang Mai Province, 1,400 m a.s.l., 9 km away from the study site) (Glomvinya et al., 2016).
Methods
Epiphytic bryophyte specimens were collected from the bark of three tree species, which grew in all three locations: Archidendron clypearia (Jack) I.C.Nielsen (Fabaceae, Thai name: Mah Kham Pae), Erythrina subumbrans (Hassk.) Merr. (Fabaceae, Thai name: Tawng Lahng Bah) and Sarcosperma arboreum Hook.f. (Sapotaceae, Thai name: Mah Yang). The tree species had been originally identified by botanist J.F. Maxwell during restoration monitoring and tagged by FORRU-CMU staff. The numbered tree tags were therefore matched with FORRU-CMU’s monitoring database. In each plot, the 3 largest trees of each species were located for bryophyte sampling.
Epiphytic bryophytes were sampled on the tree trunks at the height above ground where bryophyte coverage was maximum, by placing a square frame quadrat 10 x 10 cm (with 100 1 x 1 cm cells) at each of the four cardinal compass points (north, east, south, and west). N therefore totalled 108, across the whole study (4 quadrats on each of 3 trees of 3 species across 3 forest types). The numbers of 1 x 1 cm cells, in which each bryophyte species occurred in each quadrat were also recorded and used to calculate per cent cover.
% cover per quadrat= No. cells containing bryophyte species X
% cover per plot= No. cells containing bryophyte species X x 100
3,600
Per cent frequency was calculated as followed:
% frequency per plot=No. quadrats in which species X occurred x 100
36
Physical and biological data were also recorded: temperature, relative humidity, altitude, GPS coordinates, canopy closure (%), canopy height, canopy diameter and GBH. Bark roughness was estimated, using the method of Song et al. (2015): “low” = very smooth to smooth but with fissures; “medium” = shallowly furrowed and “high” = deeply fissured to abundant crevices across the surface. The life form of all bryophytes present was recorded, using the classification of Bates (1998).
Specimens of all species were identified in the laboratory, using dichotomous keys, following Goffinet and Shaw (2008). All specimens were verified by comparison with specimens at CMUB herbarium and at Department of Biology, Faculty of Science, Naresuan University (PNU herbarium, Chawengkul 19-001 to 19-049).
The significance of differences among means of altitude, canopy diameter, canopy height, GBH and grid height among the 3 tree species, in each of the 3 plots was determined, using one-way ANOVA with Tukey’s post-hoc in PAST 3.26. Indices of bryophyte species diversity were calculated and compared using Microsoft Excel version 16.0 and PAST 3.26 programs, including: species richness (S), Simpson’s diversity index (1-D) (Simpson, 1943), Shannon-Weiner index (H) (Magurran, 1988) and Sørensen’s similarity coefficient (Sørensen, 1948). When calculating diversity indices, per cent cover was used as a measure of species abundance, because due to their small size individual bryophytes cannot be counted (Jiang et al., 2018; Printarakul, 2015).
RESULTS
Physical and biological data of all three tree species in the study and by plot, are presented in Table 1; bark roughness is illustrated in Figure 3. Trees of all three species in the restoration plots had already attained a similar size to those in old-growth forest by 13 years. Differences in mean canopy diameter, canopy height and GBH of each species among plots were insignificant (except for Sarcosperma arboreum canopy diameter, which was significantly larger in PDS). Among the tree species, differences in the same variables were also insignificant (one-way ANOVA, P>0.05). However, maximum bryophyte cover (which determined grid height) occurred significantly higher on the trees in PDS than on the younger trees in both R98 and R06 (P<0.05).
Table 1. Characteristics of 3 tree species, sampled for epiphytic bryophytes, across three study plots (N = 3 trees per species per plot).
|
Tree species |
Study plots |
||
|
R06 |
R98 |
PDS |
|
|
Archidendron clypearia (Jack) I.C.Nielsen |
|||
|
Altitude |
1247b |
1302a |
1219b |
|
Canopy diameter (m) |
4.19a |
4.90a |
3.72a |
|
Canopy height (m) |
16a |
17a |
11a |
|
GBH (cm) |
53a |
130a |
58a |
|
Grid height (cm) |
20ab |
10b |
71a |
|
Bark roughness |
low |
low |
low |
|
Erythrina subumbrans (Hassk.) Merr. |
|||
|
Altitude |
1237b |
1305a |
1224c |
|
Canopy diameter (m) |
5.38a |
2.78a |
5.73a |
|
Canopy height (m) |
20a |
15a |
26a |
|
GBH (cm) |
118a |
77a |
127a |
|
Grid height (cm) |
15b |
26b |
150a |
|
Bark roughness |
high |
high |
high |
|
Sarcosperma arboreum Hook.f. |
|||
|
Altitude |
1240ab |
1300a |
1177b |
|
Canopy diameter (m) |
4.03b |
4.81b |
9.59a |
|
Canopy height (m) |
12a |
13a |
16a |
|
GBH (cm) |
65a |
67a |
109a |
|
Grid height (cm) |
0b |
17b |
96a |
|
Bark roughness |
medium |
medium |
medium |
|
All tree species |
|||
|
Altitude |
1242b |
1302a |
1206c |
|
Canopy diameter (m) |
4.52a |
4.30a |
6.45a |
|
Canopy height (m) |
16a |
15a |
17a |
|
GBH (cm) |
77a |
97a |
97a |
|
Grid height (cm) |
12b |
16b |
99a |
|
Canopy closure (%) |
95a |
97a |
99a |
|
Relative humidity (%) |
97a |
98a |
98a |
|
Temperature(°C) |
26a |
24a |
24a |
Note: Data are means (n=3). Data within rows, not sharing the same superscript, are significantly different between study plots (P<0.05)
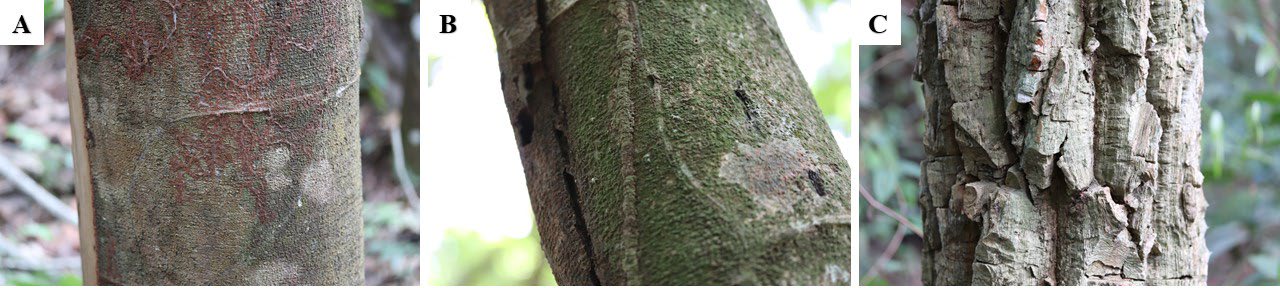
Figure 3. Bark roughness of sampled tree species: (A) Low; Archidendron clypearia, (B) Medium; Sarcosperma arboreum, and (C) High; Erythrina subumbrans.
In terms of species composition, fifteen epiphytic bryophyte species, representing 14 genera and 12 families were recorded, including 4 acrocarpous moss species, 5 pleurocarpous moss species and 6 leafy liverwort species (Table 2, Figure 4).
Table 2. Lists of all bryophyte species found in the study area and their life forms.
|
Group |
Scientific name |
Family |
Life form |
|
Acrocarpous mosses
|
Fissidens hollianus Dozy & Molk. |
Fissidentaceae |
Fans |
|
Fissidens zollingeri Mont. |
Fissidentaceae |
Fans |
|
|
Leucobryum aduncum var. scalare (Müll. Hal. ex M. Fleisch.) A. Eddy |
Dicranaceae |
Turfs |
|
|
Octoblepharum benitotanii N. Salazar & Chantanaorr. |
Calymperaceae |
Turfs |
|
|
Pleurocarpous mosses |
Entodontopsis anceps (Bosch & Sande Lac.) W.R. Buck & Ireland |
Stereophyllaceae |
Mats |
|
Isopterygium lignicola (Mitt.) A. Jaeger |
Hypnaceae |
Mats |
|
|
Pelekium gratum (P. Beauv.) Touw |
Thuidiaceae |
Wefts |
|
|
Racopilum orthocarpum Wilson ex Mitt. |
Racopilaceae |
Mats |
|
|
Trichosteleum stigmosum Mitt. |
Sematophyllaceae |
Mats |
|
|
Leafy liverworts
|
Cephalozia hamatiloba Steph. |
Cephaloziaceae |
Mats |
|
Chiloscyphus kurzii (Sande Lac.) J.J. Engel & R.M. Schust. |
Lophocoleaceae |
Mats |
|
|
Cololejeunea planissima (Mitt.) Abeyw. |
Lejeuneaceae |
Mats |
|
|
Frullania shanensis Svihla |
Frullaniaceae |
Mats |
|
|
Lejeunea tuberculosa Steph. |
Lejeuneaceae |
Mats |
|
|
Plagiochila junghuhniana Sande Lac. |
Plagiochilaceae |
Fans |
Per cent cover and per cent frequency data are presented in Table 3.
The three most abundant bryophyte species (highest per cent cover) in PDS were Fr. shanensis (4.83%), Ch. kurzii (2.83%) and Pe. gratum (2.61%); in R98 were O. benitotanii (11.17%), Lej. tuberculosa (4.83%) and I. lignicola (3.81%) and in R06 were Pe. gratum (3.33%), O. benitotanii (2.25%) and I. lignicola (1.08%).
The most frequent bryophyte species in PDS were Fr. shanensis (19.44%), I. lignicola (13.89%), O. benitotanii, Ch. kurzii, and Lej. tuberculosa (each species: 8.33%); in R98 were O. benitotanii (27.78%), I. lignicola (25.00%) and Lej. tuberculosa (16.67%) and in R06 were O. benitotanii (13.89%), E. anceps, Pe. gratum, Lej. tuberculosa (each species: 8.33%).
The species richness was 9, 8 and 9 in PDS, R98 and R06 respectively. Diversity indices are presented in Table 4. Species richness and diversity of epiphytic bryophytes did not vary greatly or consistently across the plots.
Overall per cent cover and frequency of all epiphytic bryophytes combined exceeded natural forest levels at some time between 13 and 21 years after initiating restoration (see Table 3).
Table 3. Percent cover and per cent frequency of all epiphytic bryophyte species on all host species in R06, R98, and PDS (N = 36 quadrats across all trees per plot).
|
%Cover |
%Frequency |
|||||
|
Plots |
R06 |
R98 |
PDS |
R06 |
R98 |
PDS |
|
Species |
|
|
|
|
|
|
|
Acrocarpous mosses |
|
|
|
|
|
|
|
Fi. hollianus |
0.00 |
0.00 |
0.25 |
0.00 |
0.00 |
2.78 |
|
Fi. zollingeri |
0.42 |
0.00 |
0.00 |
5.56 |
0.00 |
0.00 |
|
Leu. aduncum var. scalare |
0.31 |
0.33 |
0.00 |
2.78 |
8.33 |
0.00 |
|
O. benitotanii |
2.25 |
11.17 |
0.78 |
13.89 |
27.78 |
8.33 |
|
Pleurocarpous mosses |
|
|
|
|
|
|
|
E. anceps |
0.75 |
3.58 |
0.00 |
8.33 |
8.33 |
0.00 |
|
I. lignicola |
1.08 |
3.81 |
2.33 |
5.56 |
25.00 |
13.89 |
|
Pe. gratum |
3.33 |
0.97 |
2.61 |
8.33 |
2.78 |
5.56 |
|
R. orthocarpum |
0.17 |
0.00 |
0.00 |
2.78 |
0.00 |
0.00 |
|
T. stigmosum |
0.00 |
1.31 |
0.00 |
0.00 |
5.56 |
0.00 |
|
Leafy liverworts |
|
|
|
|
|
|
|
Ce. hamatiloba |
0.69 |
0.00 |
0.00 |
5.56 |
0.00 |
0.00 |
|
Ch. kurzii |
0.00 |
0.00 |
2.83 |
0.00 |
0.00 |
8.33 |
|
Co. planissima |
0.00 |
0.00 |
0.03 |
0.00 |
0.00 |
2.78 |
|
Fr. shanensis |
0.00 |
1.53 |
4.83 |
0.00 |
8.33 |
19.44 |
|
Lej. tuberculosa |
0.97 |
4.83 |
2.17 |
8.33 |
16.67 |
8.33 |
|
Pl. junghuhniana |
0.00 |
0.00 |
0.67 |
0.00 |
0.00 |
5.56 |
|
Total |
9.97 |
27.53 |
16.50 |
4.07 |
6.85 |
5.00 |
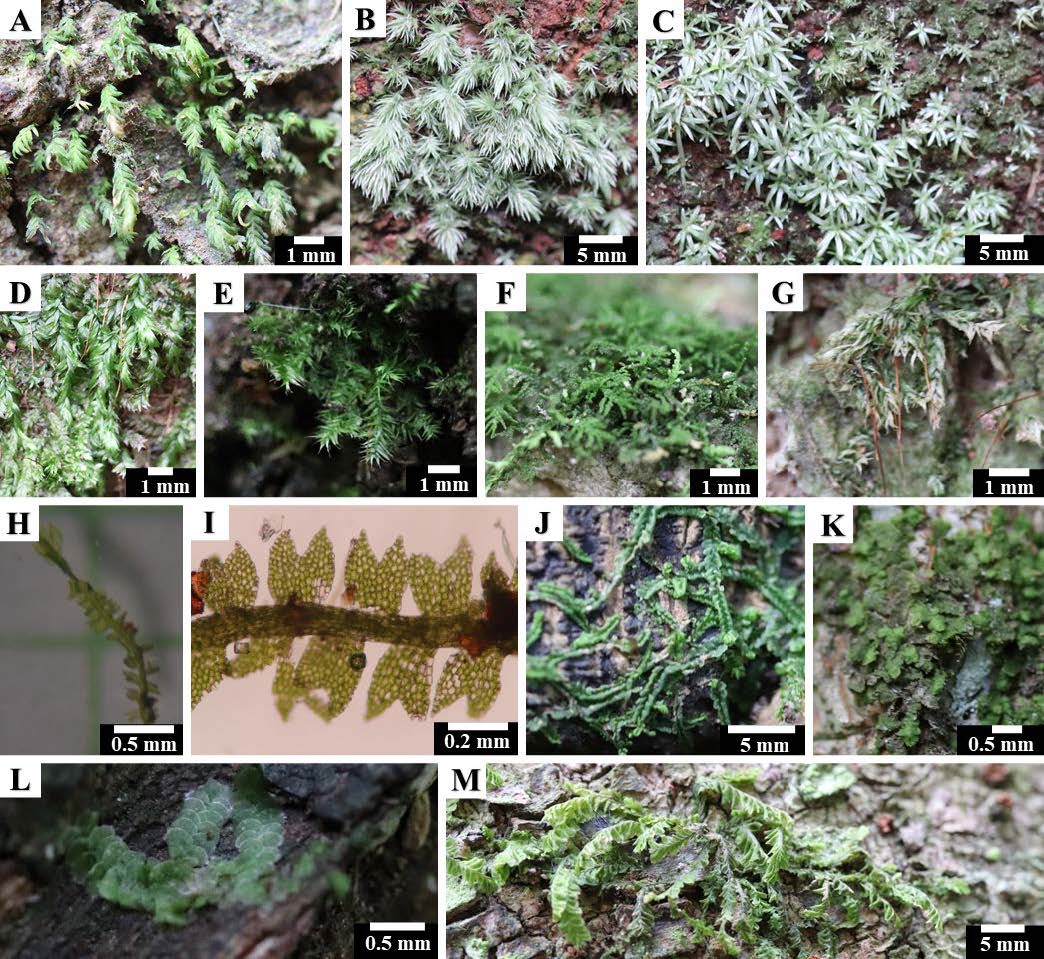
Figure 4. Epiphytic bryophytes in the study area. Acrocarpous mosses: (A) Fissidens hollianus, (B) Leucobryum aduncum var. scalare, (C) Octoblepharum benitotanii; Pleurocarpous mosses: (D) Entodontopsis anceps, (E) Isopterygium lignicola, (F) Pelekium gratum, (G) Trichosteleum stigmosum. Leafy liverworts: (H-I) Cephalozia hamatiloba, (J) Chiloscyphus kurzii, (K) Frullania shanensis, (L) Lejeunea tuberculosa and (M) Plagiochila junghuhniana.
Table 4. Epiphytic bryophyte species richness and diversity in restoration plots and old-growth forest (PDS) (N = 36 quadrats across all trees per plot).
|
Diversity indices |
Forest plots |
||
|
R06 |
R98 |
PDS |
|
|
Species richness (S) |
9.00 |
8.00 |
9.00 |
|
Simpson’s diversity index (1-D) |
0.89 |
0.79 |
0.87 |
|
Shannon-Weiner index (H) |
2.25 |
1.81 |
2.08 |
Table 5 shows that bryophyte community species composition was highly similar between the R98 and R06 plots. The bryophyte community species composition of both restoration plots was moderately similar to that of old growth forest, with the older plot being more so than the younger one.
Table 5. Numbers of shared species (upper right) and Sørensen’s similarity coefficient (lower left) between the forest plots.
|
Plot |
PDS |
R98 |
R06 |
|
Number of shared species |
|||
|
PDS |
- |
5 |
4 |
|
R98 |
0.588 |
- |
6 |
|
R06 |
0.444 |
0.706 |
- |
|
Sørensen’s similarity coefficient |
|||
Four out of a total of 15 bryophyte species recorded bryophyte species were found in all three plots. More than half (5 of 9) of the species recorded in old-growth forest had successfully recolonized the restoration plots; the remainder were recorded uniquely in old-growth forest. Furthermore, 3 of the 9 species recorded in the youngest restoration plot, were recorded uniquely there, whereas only one of 8 species in the older restoration plot was recorded uniquely there (Figure 5).
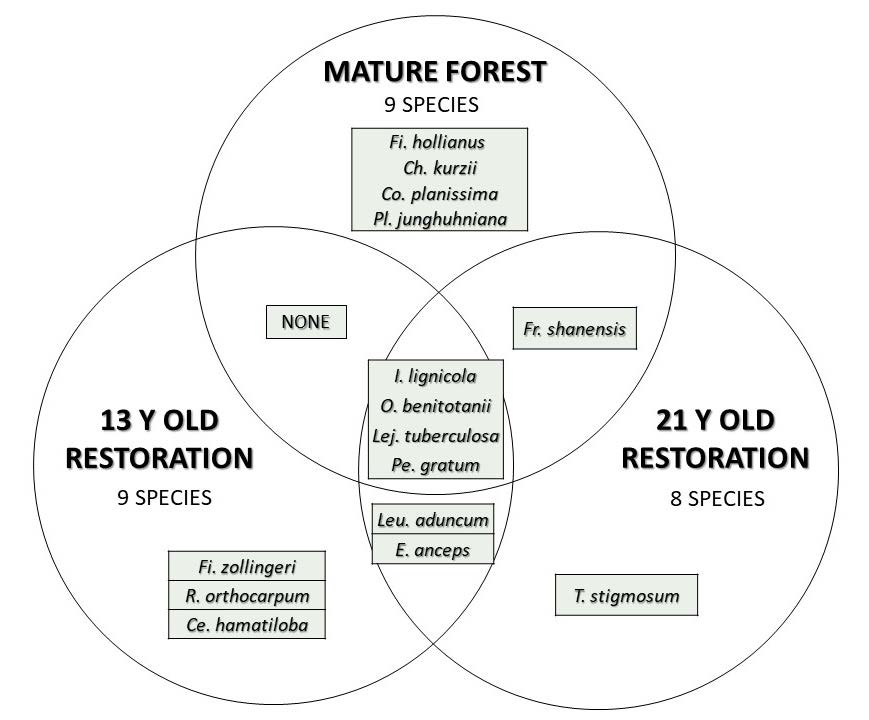
Figure 5. Distribution of the 15 recorded bryophyte species among the three plots.
Some bryophyte species were recorded on only one of the tree species included in the study (Table 6), whereas others were widespread on all three. For example, Leu. aduncum var. scalare was recorded only on Archidendron clypearia (smooth bark); Fi. hollianus, R. orthocarpum, T. stigmosum and Ce. hamatiloba only on Sarcosperma arboreum (medium bark roughness) and Co. planissima only on Erythrina subumbrans (high bark roughness). In contrast E. anceps and I. lignicola were recorded on all three tree species, whilst Ch. kurzii, Fi. zollingeri, Fr. shanensis, O. benitotanii, Pe. gratum, and Pl. junghuhniana were found on only 2 tree species.
Table 6. Epiphytic bryophyte species on three host species.
|
Epiphytic bryophyte species |
Host species |
||
|
Archidendron clypearia |
Sarcosperma arboreum |
Erythrina subumbrans |
|
|
Bark roughness of hosts |
Low |
Medium |
High |
|
Acrocarpous mosses |
|
|
|
|
Fi. hollianus |
|
ü |
|
|
Fi. zollingeri |
|
ü |
ü |
|
Leu. aduncum var. scalare |
ü |
|
|
|
O. benitotanii |
ü |
ü |
|
|
Pleurocarpous mosses |
|
|
|
|
E. anceps |
ü |
ü |
ü |
|
I. lignicola |
ü |
ü |
ü |
|
Pe. gratum |
|
ü |
ü |
|
R. orthocarpum |
|
ü |
|
|
T. stigmosum |
|
ü |
|
|
Leafy liverworts |
|
|
|
|
Ce. hamatiloba |
|
ü |
|
|
Ch. kurzii |
ü |
ü |
|
|
Co. planissima |
|
|
ü |
|
Fr. shanensis |
|
ü |
ü |
|
Lej. tuberculosa |
ü |
ü |
ü |
|
Pl. junghuhniana |
ü |
ü |
|
|
Total |
7 |
13 |
7 |
DISCUSSION
Recolonization of forest restoration plots by bryophytes is limited by two main factors: i) environmental conditions and ii) spore dispersal.
Table 1 shows that within 13 years after initiating restoration, temperature and humidity in both restoration plots had already become statistically indistinguishable from those of mature forest, and that the planted trees had grown to about the same size as those in mature forest. Furthermore, almost all the bryophytes in this study grew as mats, flattened against the substrate (Table 2). Mat life forms are associated with deeply shaded habitats (Bates, 1998). Thus, their prevalence indicated that, within 13 years, restoration had achieved similar shade levels as those prevalent in mature forest. Epiphytic bryophyte life strategies have been classified as “colonists” with high reproductive effort and short life spans and more persistent “perennials” with lower reproductive effort, longer life spans and high competitiveness (Glime, 2017; Kürschner, 2004). None of the species recorded in this study could be classified as colonists, suggesting that the early successional phase of bryophyte community development had been concluded well before 13 years after restoration initiation. This adds further weight to the argument that environmental conditions in the restored plots were similar to those of mature forest and thus it is unlikely that bryophyte community recovery during restoration was limited by inadequate environmental conditions.
Considering spore dispersal, the 5 PDS bryophyte species, which successfully dispersed to and recolonized the restoration plot (Figure 5), tended to be the more abundant and widespread ones in the sources habitat. Their mean cover and frequency values in PDS were 2.5 and 11.1 respectively, compared with 0.9 and 4.9 respectively for the 4 PDS species that did not recolonize the restoration plots (derived from Table 3). This suggests that the abundance of spore sources might influence re-establishment of bryophyte during restoration more than gross environmental factors. Although the failure of the other four PDS species (Fi. hollianus, Ch. kurzii, Co. planissima, and Pl. junghuhniana) to recolonize the restoration plots might be explained by their relative rarity in PDS, other factors might also be involved, such as the development of specific microclimatic conditions over a long time-span of relative stability, which is only possible in old-growth forest. Ho (2015) and Printarakul (2015) reported that both of the leafy liverworts, Ch. kurzii and Co. planissima are old-growth forest species. Thus, it is likely that all four non-colonizing species may be specialized, advanced, old-growth forest species. This hypothesis should be investigated by further research, such as transplant experiments. If the hypothesis is validated, the return of such species to restoration plots could be considered as an indicator of more advanced restoration progress. F. shanensis, the most abundant and frequent species in PDS, was also found in the R98 plot, but not in R06. Therefore, increasing coverage of this species may also be considered as an indicator of forest restoration progress. Consequently, study of its distribution on a wider range of tree species is recommended.
In contrast, the 3 species that were recorded uniquely in the younger restoration plot (Figure 5) might be considered as lingering remnants of a previous earlier successional bryophyte community, not yet fully extirpated, as the forest ecosystem transitioned towards more mature-forest conditions, although they are not regarded as “colonists” (Glime, 2017; Kürschner, 2004). This hypothesis is partially supported by the fact all 3 were relatively rare, with mean cover and frequency values of 0.4 and 4.6 respectively, compared with 1.4 and 7.9 respectively for the remaining six R06 bryophyte species, which were also recorded in R98 and PDS (derived from Table 3). To validate this hypothesis, successive surveys that show declining populations of these 3 species in R06 would be needed.
Species least useful as indicators of forest restoration progress are the four that were common to all plots (Figure 5) as apparently, they can thrive under a wide range of environmental conditions. Consequently, they tended to be the commoner species in all habitats, with mean per cent cover values ranging from 1.14 to 4.1 times higher than other species in each habitat and mean percent frequency values 1.2 to 2.4 times higher (derived from Table 3). Two of them (Pe. gratum and O. benitotanii) are reported to be widespread across Southeast Asia, including Thailand, growing frequently on tree trunks, branches and rotten wood (Allen and Chantanaorrapint, 2018; Tan and Printarakul 2018).
The fact, that the abundance of all epiphytic bryophytes combined surpassed natural forest levels between 13 and 21 years after initiating restoration (Table 3) is a remarkable result and further indicates that the restoration method applied created excellent habitat conditions for bryophyte proliferation. This is further supported by the fact that species richness and diversity of bryophytes did not vary greatly or consistently among the plots (Table 4), indicating that conditions for species accumulation in the restoration plots had recovered to levels similar to those of old-growth forest within 13 years. The greater similarity of bryophyte communities between R98 and PDS than between R06 and PDS (Table 5) may be explained simply by the fact that the older trees in R98 had had more time to become colonized by bryophyte propagules from PDS.
Considering differences in bryophyte community composition among the tree species included in this study, several authors have reported that bark characteristics, particularly roughness are most influential in this regard (González-Mancebo et al., 2003; Song et al., 2015; Shen et al., 2018), although further research is needed to elucidate the mechanisms by which bark roughness has its effects on bryophytes. In this study Sarcosperma arboreum supported the highest bryophyte species richness (13 species) with bark of medium roughness (Figure 3B).
The fact that maximum bryophyte cover (grid height) occurred higher on the mature trees in PDS than on the younger trees in both R98 and R06 (Table 1) is unlikely to have been due to differences in environmental conditions between the restoration plots and old-growth forest, since such differences were insignificant. Therefore, it is more likely to have been due to time, as bryophyte communities had had a much longer time span to grow up tree trunks on the older trees in PDS compared with the younger trees in the restoration plots. This is in agreement with the observations of Fritz (2009), who also reported that vertical distribution of bryophytes on tree trunks was related to tree age.
CONCLUSION
In conclusion, the framework species method of forest restoration rapidly re-established habitat conditions that were highly conducive for the proliferation of epiphytic bryophytes on tree trunks in 13-21 years. It returned bryophyte species richness and diversity to levels similar to those of natural forest within 13 years and gradually directed community composition towards that of mature forest, with more than half of bryophyte species recorded in old-growth forest having recolonized the restoration plots within 21 years.
With regard to the potential use of bryophytes as indicator species of restoration progress, the results were more equivocal. Whilst four ubiquitous species can probably be rejected as potential indicators (I. lignicola, O. benitotanii, Lej. Tuberculosa and Pe. Gratum), further research is needed to determine the potential of 5 others as indicators of advanced restoration (Fi. hollianus, Ch. kurzii, Co. planissima, Pl. junghuhniana and Fr. shanensis) and 3 others as indicators of early succession (Fi. zollingeri, R. orthocarpum and Ce. hamatiloba).
ACKNOWLEDGEMENTS
The authors thank Asst. Prof. Dr. Anupan Kongbangkerd and Dr. Supatcharee Tanasarnpaiboon for their helpful suggestions, as well as Asst. Prof. Dr. Kanjana Thananoppakun and Dr. Narin Printarakul for help with identifying bryophyte species. We also thank FORRU-CMU field officers for help with field work. Chiang Mai University supported the involvement of SE in the project and his time spent working on the manuscript.
AUTHOR CONTRIBUTIONS
The study was designed by all authors. The article was written by all authors. All authors have read and approved the final manuscript.
CONFLICT OF INTEREST
The authors declare no conflicting interests.
REFERENCES
Allen, N.S., and Chantanaorrapint, S. 2018. Octoblepharum benitotanii (Octoblepharaceae) a new species from the Old-World Tropics. Philippine Journal of Systematic Biology. 12: 58-66.
Bates, J.W. 1998. Is "life-form" a useful concept in bryophyte ecology? Oikos. 82: 223-237.
Elliott, S., Blakesley, D., and Hardwick, K. 2013. Restoring tropical forests: A practical guide. Royal Botanic Gardens, Kew. p. 344.
Elliott, S., Chairuangsri, S., Kuaraksa, C., Sangkum, S., Sinhaseni, K., Shannon, D., Nippanon, P., and Manohan, B. 2019. Collaboration and conflict—developing forest restoration techniques for northern Thailand’s upper watersheds whilst meeting the needs of science and communities. Forests. 10: 732.
Forest Restoration Research Unit. 2005. How to Plant a Forest: The Principles and Practice of Restoring Tropical Forests. Biology Department, Science Faculty, Chiang Mai University. Thailand.
Frego, K.A. 2007. Bryophytes as potential indicators of forest integrity. Forest Ecology and Management. 242: 65-75.
Fritz, Ö. 2009. Vertical distribution of epiphytic bryophytes and lichens emphasizes the importance of old beeches in conservation. Biodiversity and Conservation. 18: 289-304.
Glime, J.M. 2017. Adaptive strategies: Life cycles. In J. M. Glime (Ed.), Bryophyte Ecology (Vol. 1). https://digitalcommons.mtu.edu/bryophyte-ecology/
Glomvinya, S., Tantasirin, C., Tongdeenok, P., and Tanaka, N. 2016. Changes in rainfall characteristics at Huai Kog-Ma watershed, Chiang Mai province. Thai Journal of Forestry. 35: 66-77.
Goffinet, B., and Shaw, A.J. 2008. Bryophyte Biology (2nd ed.). Cambridge University Press.
González-Mancebo, J.M., Losada-Lima, A., and Clister, S. 2003. Host specificity of epiphytic bryophyte communities of a laurel forest on Tenerife (Canary Islands, Spain). Bryologist. 106: 383-394.
Goosem, S.P., and Tucker, N.I.J. 1995. Repairing the rainforest– Theory and Practice of Rainforest Re-establishment in North Queensland’s Wet Tropics (Vol. 76).
Ho, B.C., Tan, B.C., and Luong, T.T. 2015. Guide to the bryophytes in the limestone glass house of the queen Sirikit botanic garden. ASEAN Centre for Biodiversity & the Japan – ASEAN Integration Fund. Los Baños, Philippines.
Jiang, T., Yang, X., Zhong, Y., Tang, Q., Liu, Y., and Su, Z. 2018. Species composition and diversity of ground bryophytes across a forest edge-to-interior gradient. Scientific Reports. 8: 11868.
Kürschner, H. 2004. Life strategies and adaptations in bryophytes from the near and middle east. Turkish Journal of Botany. 28: 73-84.
Magurran, A.E. 1988. Ecological diversity and its measurement. Princeton University Press.
Maxwell, J. F. and S. Elliott, 2001. Vegetation and vascular flora of Doi Sutep-Pui national park, Chiang Mai province, Thailand. Thai Studies in Biodiversity 5. Biodiversity Research and Training Programme, Bangkok. 205 pp.
McDonald, T., Gann, G.D., Jonson, J., and Dixon, K.W. 2016. International principles & standards for the practice of ecological restoration, 2nd edition. https://www.ser.org/page/SERStandards
Mizuno, T., Momohara, A., and Okitsu, S. 2015. The effects of bryophyte communities on the establishment and survival of an epiphytic fern. Folia Geobotanica. 50: 331-337.
Oishi, Y. 2012. Decreased epiphytic bryophyte diversity on Mt. Odaigahara, Japan: causes and implications. Biodiversity Enrichment in a Diverse World. 154-170.
Printarakul, N. 2015. Bryophyte flora of Doi Suthep-Pui national park, Chiang Mai, Thailand. Ph.D. dissertation. Chiang Mai University, Chiang Mai, Thailand.
Shen, T., Corlett, R.T., Song, L., Ma, W.Z., Guo, X.L., Song, Y., and Wu, Y. 2018. Vertical gradient in bryophyte diversity and species composition in tropical and subtropical forests in Yunnan, SW China. Journal of Vegetation Science. 29: 1075-1087.
Simpson, G.G. 1943. Mammals and the nature of continents. American Journal of Science. 241: 1-31.
Song, L., Ma, W.Z., Yao, Y.L., Liu, W.Y., Li, S., Chen, K., Lu, H.Z., Cao, M., Sun, Z.H., Tan, Z.H., and Nakamura, A. 2015. Bole bryophyte diversity and distribution patterns along three altitudinal gradients in Yunnan, China. Journal of Vegetation Science. 26: 576-587.
Sørensen, T. 1948. A method of establishing groups of equal amplitude in plant sociology based on similarity. Kongelige Danske Videnskabernes Selskab, Biologiske Skrifter. 5: 1-34.
Tan, B.C., and Printarakul, N. 2018. A small collection of Thai mosses made by J. F. Maxwell at the herbarium of California Academy of Sciences in United States. Natural History Bulletin of the Siam Society. 63: 41-45.
OPEN access freely available online
Natural and Life Sciences Communications
Chiang Mai University, Thailand.
Puwadol Chawengkul1, Pranee Nangngam1 and Stephen Elliott2,*
1 Department of Biology, Faculty of Science, Naresuan University, Phitsanulok 65000, Thailand
2 Forest Restoration Research Unit and Environmental Science Research Centre, Biology Department, Faculty of Science, Chiang Mai University, Chiang Mai 50200, Thailand.
Corresponding author: Stephen Elliott, E-mail: stephen_elliott1@yahoo.com
Total Article Views
Editor: Wasu Pathom-aree,
Chiang Mai University, Thailand
Article history:
Received: July 19, 2022;
Revised: December 16, 2022;
Accepted: December 26, 2022;
Published online: January 16, 2023