 ISSN: 2822-0838 Online

Environmental and Industrial Impact on the Biological Systems of Living Organisms
Kulzipa Dakieva*, Gulnaz Sadykanova, Anatoliy Tsyganov, Anatoliy Chursin, Anargul Sharipkhanova, and Anna EgorinaPublished Date : 2023-01-05
DOI : https://doi.org/10.12982/NLSC.2023.015
Journal Issues : Number 1, January-March 2023
Abstract The purpose of this work is to establish the adaptive, stress and compensatory responses in people employed in titanium production and in laboratory animals kept at the Ust-Kamenogorsk Titanium and Magnesium Plant. It focused on the adaptive responses of mice (a total of 28 individuals in the experimental and control groups). The population of human participants consisted of 430 workers in the main workshops and 100 office workers (control group) employed at the plant. Morbidity and working conditions were analyzed. Urinary and blood biochemistry was evaluated. Changes in nitrogen metabolism were observed. The level of urea increased by 22%, creatinine – by 19%, and hydroxyproline – by 71% after a 2-week exposure to titanium and its compounds. Changes in carbohydrate metabolism were found. The level of glucose increased by 44% and the level of lactic acid increased by 65% after a 4- and 12-week exposure. As to animals, the study confirmed that there was a 41% increase in the concentration of lactic acid, a 38% increase in glucose, and a 50% increase in hydroxyproline following a 2-week exposure. Creatinine increased by 20%, indicating kidney damage in animals. The adaptive changes observed in workers can be markers in risk assessment.
Keywords: Titanium, Pollution, Manufacturing plant, Toxins, Adaptive changes, Creatinine, Hydroproline
Funding: This research received no specific grant from any funding agency in the public, commercial, or not-for-profit sectors.
Citation: Dakieva, K., Sadykanova, G., Tsyganov, A., Chursin, A., Sharipkhanova, A., and Egorina, A. 2023. Environmental and industrial impact on the biological systems of living organisms. Nat. Life Sci. Commun. 22(1): e2023015.
INTRODUCTION
As the leading global providers of highly sophisticated alloys for rocket engineering, prosthetic and other advanced applications, titanium production and magnesium production are one of the most highly demanded sectors in modern metallurgy (Khan et al., 2019). Workers employed in those sectors are required to wear protective clothing for additional protection (Manke et al., 2013). Meantime, the developing countries (especially the post-Soviet republics) are less invested in preventive healthcare at the workplace. Such negligence results in an increased occupational morbidity. As known, the main production-related hazards are dust and different harmful compounds released during metallurgical processes (Iavicoli et al., 2012).
Available literature concerning the health risks of titanium production mostly elucidates the damage caused to the respiratory system of titanium plant workers, for respiratory diseases rank first in the morbidity profile (Saehana et al., 2011; Manke et al., 2013; Iavicoli et al., 2012; Koedrith et al., 2018). The clinical signs of respiratory damage are known to be not obvious. The personnel of titanium plants come in contact with titanium and associated harmful substances, such as vanadium, chromium, and manganese. Dusts containing more elements besides titanium are called complex and, consequently, are considered more toxic (Sungur, 2020). Previous studies found a relation between clinical changes in the respiratory function and exposure to the toxic chemicals released during production (Ali et al., 2018; Dakieva et al., 2020). These include titanium dioxide, titanium metal powder, titanium tetrachloride, chlorine, hydrogen chloride, and phosgene (Ali et al., 2018; Dakieva et al., 2020).
The combined action of titanium tetrachloride hydrolysis products causes, among other things, chronic lung diseases. Individuals who were exposed to it showed infiltrated and fibrotic changes in the lungs and lesions of the nervous system (Stepanov et al., 2013).
In such working conditions, workers often experience acute respiratory infections, chronic bronchitis, etc. (Ali et al., 2018). The retention rate of chlorine anion-containing compounds (e.g., chlorine, hydrogen chloride, titanium tetrachloride, phosgene, magnesium dichloride) was relatively high and ranged from 39 to 85% (Toyooka et al., 2012).
Evidence from experiments involving albino mice suggests that exposure to titanium tetrachloride (TiCl4) has consequences associated with the action of not only TiCl4 itself but also the products of its hydrolysis – hydrogen chloride and titanium compounds powders (Magdolenova et al., 2012). Literature contains limited information on the effect of titanium and its compounds on individual organs and body systems. It is known that insoluble titanium compounds trigger changes in the respiratory tract (Hsiao and Huang, 2011). There were also cases of pneumoconiosis among workers exposed to titanium and titanium carbide at their workplace (Landsiedel et al., 2010).
Given the negative consequences of working at titanium production plant, it is better to detect diseases in their earliest stages to prevent progression (Shi et al., 2013; Dakieva et al., 2018). More studies are needed to define the effects of harmful factors and their role in health deterioration. These studies can lay the groundwork for health precautions aimed at improving health and performance at the titanium production plant (Zhang et al., 2012).
The literature is mainly devoted to the effect of titanium and its compounds on a single organ system – respiratory, digestive or cardiovascular system (Landsiedel et al., 2010; Lv et al., 2019; Tang et al., 2019). However, it is important to know the basic biochemical parameters of blood and urine in order to detect the early symptoms of a disease. Such tests can be helpful in early diagnostics and are cost-friendly. There are very few papers addressing blood biochemistry of workers employed in the titanium industry (Baranowska-Wójcik et al., 2020). This study aim is to narrow this gap.
This study contributes information about the dangers of working under titanium production conditions. The present findings can be used to develop safety measures needed for making titanium production safe for human health.
The authors of the present paper are the first to report the urinary and blood test results from workers and laboratory animals placed in different environments and discuss the adverse factors (dust size, toxicant content) in detail. Hypothetically, serious disorders of carbohydrate and nitrogen metabolism would be evident with blood and urine tests performed on animals and plant workers (Ventsova and Safonov, 2021; Safonov, 2022). The results will make it possible to discover the effect of titanium and its compounds on metabolic processes running in the body of laboratory animals and humans. Moreover, thanks to the titanium exposition research, it will be possible to standardize working conditions.
The purpose of this work is to study the adaptive, stress and compensatory responses in people employed in titanium production and laboratory animals kept at the titanium metallurgical plant. The objectives of the study are: a) to investigate the adaptive responses and metabolic processes in laboratory animals placed under conditions of the plant; b) to study the adaptive responses and metabolic processes occurring in the body of plant workers having different length of service; c) to assess the concentration of pollutants in the body of plant workers.
Limitations of the study are associated with the study location. All participants were employed in titanium production. Those employed in other branches of metallurgical industry may show different results.
MATERIALS AND METHODS
Study design
In-house research consists of two parts: (1) an experiment on sexually mature Wister albino mice and (2) an examination of human participants who work in the main workshops at the Ust-Kamenogorsk Titanium and Magnesium Plant (UK TMP, JSC) in Kazakhstan. The Plant mainly produces titanium ingots and titanium sponge. It is the world's leading supplier in the aerospace industry. The Plant was founded in 1954 and still runs today with 2689 people employed. One of its hazards is the landfill of chlorine-containing wastes. By 2020, the Plant managed to reduce the amount of pollution from 3 tons per year per Ust-Kamenogorsk resident to 650 kg. Dumps and landfills are in process of being reclaimed.
In Soviet times, despite the existing labor standards, pollution prevention was not carried out adequately. There were no treatment facilities and workers did not always receive bonus payments for difficult production conditions and overalls. So far, these shortcomings have been corrected and the Plant has undergone modernization, primarily in relation to treatment facilities.
The nature of pathological changes in the body of animals exposed to a combination of toxic gases and dust (titanium dioxide powder, titanium metal dust, titanium tetrachloride and its hydrolysis products, chlorine and phosgene) was determined experimentally. The studies took place directly in titanium and magnesium workshops. In the researchers’ opinion, the field study approach creates the most advantageous experimental model, which enables comprehensive comparison of the clinical and experimental data.
Sample
Experimental animals were placed inside the three main workshops (workshops No. 1, 2, and 3) of UK TMP, JSC. They were kept in specially tailored cages, each housing 25-26 animals. The cages were installed at the level of the human respiratory organs. The control group (28 animals) was kept on the premises of the plant in a separate, clean, well-ventilated room. Both experimental and control animals were killed after 2, 4 and 12 weeks of exposure.
A total of 430 workers in the main workshops at the UK TMP, JSC were examined. The control group consisted of 100 workers in the administrative and economic department, where no occupational hazards were present. The participating workers were full-time employees, who signed an agreement with the Plant where the Plant obligated to provide safe working conditions. All workers were randomly selected and informed that their participation is voluntary. Each individual received the opportunity to familiarize with the research protocol and signed an informed consent to participate in the study. The study was carried out in accordance with international standards. The anonymity and confidentiality of the data were guaranteed to the participants and respected. The study was approved by the Ethical Committee of the Kazakhstan Academy of Sciences (Protocol No. 2231).
The workers were divided into four groups based on their length of service (Table 1): those who have been working at the plant for less than 3 years, 3 to 5 years, 6 to 10 years and more than 10 years.
Table 1. Distribution of the examined workers by the length of service (as a percentage and absolute number).
|
No. |
Examined groups |
Length of service |
Total |
||||||||||||
|
Up to 3 years |
3-5 years |
6-10 years |
More than 10 years |
|
|||||||||||
|
abs |
% |
abs |
% |
abs |
% |
abs |
% |
abs |
% |
|
|||||
|
1 |
Control group |
29 |
29 |
25 |
25 |
24 |
24 |
22 |
22 |
100 |
100 |
|
|||
|
2 |
Experimental group |
125 |
29 |
116 |
27 |
99 |
23.1 |
90 |
20.9 |
430 |
100 |
|
|||
Study sample consisted of workers holding the following main positions: chlorinator operators, electrolysis operators, machine operators in titanium production, smelters, cutters, mill operators, furnace operators, and chlorine distillation operators (Table 2).
Table 2. Distribution of workers by positions (UK TMP, JSC)
|
|
Positions |
||||||||
|
Chlorinator operators |
Electrolysis operators |
Machine operators in titanium production |
Smelters |
Cutters |
Mill operators |
Furnace operators |
Chlorine distillation operators |
Total |
|
|
abs. |
67 |
69 |
43 |
44 |
56 |
44 |
54 |
53 |
430 |
|
% |
15.6 |
16.1 |
10.0 |
10.2 |
13.0 |
10.2 |
12.6 |
12.3 |
100 |
Workers were employed at the following main workshops (Table 3): magnesium production workshop or workshop No. 1; titanium tetrachloride production workshop or workshop No. 2; and titanium sponge production workshop or workshop No. 3.
Table 3. Distribution of workers by workshops (UK TMP, JSC).
|
Hazardous production workshops |
|
||||||||
|
Workshop No. 1 |
Workshop No. 2 |
Workshop No. 3 |
Total |
||||||
|
abs. |
% |
abs. |
% |
abs. |
% |
abs. |
% |
||
|
134 |
31.2 |
143 |
33.2 |
153 |
35.6 |
430 |
100 |
||
Research methods
Non-protein nitrogen compounds in blood. The content of urea was determined by the diacetyl monoxime method (Fearon’s reaction).
Residual nitrogen was determined by colorimetry. The method mineralizes the protein-free filtrate obtained after blood protein precipitation when heated with concentrated sulfuric acid in the presence of a catalyst.
The levels of serum creatinine were assessed according to Popper et al. The principle of the method is the following: in alkaline medium, creatinine forms a complex with picric acid. The intensity of its color is proportional to the amount of creatinine. The wavelength was 530 nm.
Indicators of connective tissue metabolism
The content of hydroxyproline (Hyp) was determined by studying the excretions in 24-hour urine samples. The results were evaluated according to the calibration curve (Table 4).
Table 4. Determination of urinary hydroxyproline levels.
|
Tube No. |
Reference standard |
Distilled water |
Concentration |
|
|
A sample contains (µg) |
mL |
µg/mL |
µg/0.5 mL |
|
|
1 2 3 4 5 6 7 8 9 |
5 4 3 2.5 2 1 0.5 0.25 0.11 |
0 1 2 2.5 3 4 4.5 4.75 4.80 |
200 100 120 100 80 40 20 10
|
100 80 60 60 40 20 10 5 0.5 |
To plot the graph, a series of solutions was prepared. A certain amount of a hydroxyproline working standard was sequentially introduced into each prepared solution.
Carbohydrate metabolism
Determination of blood glucose was performed with an automatic biochemical analyzer Cobas integra-400 plus using reagent kits from Lachema. Determination was based on the Gultman method modified by Hivarinena-Nikkila.
Blood pyruvic acid was determined using the modified Umbright method. The content of lactic acid was measured enzymologically based on the amount of NAD·H2.
Statistical data analysis was carried out in Statistics 10. The Student's t-test was used to compare the values of the variables. Differences are considered significant at P ≤ 0.05.
RESULTS
Adaptive responses and metabolic processes in laboratory animals placed under conditions of the plant
The following nitrogen compounds were determined in blood: residual nitrogen, urea, and creatinine. Hydroxyproline was determined as an indicator of the connective tissue biochemistry.
In workshop No. 1, residual nitrogen increased moderately by 11% after 2 weeks, by 12% after 4 weeks, and by 11% after 12 weeks as compared to the control group. Thus, the levels of residual nitrogen reached 18.9 ± 0.5, 19.3 ± 0.5 and 20.1 ± 0.4 mmol/L in workshop No. 1, and 17.0 ± 0.4, 17.2 ± 0.3 and 18.1 ± 0.5 mmol/L in the control group (P < 0.05).
In workshops No. 2 and 3, residual nitrogen increased only by week 12 of the experiment. An increase of 8 and 9% was reported. The level of residual nitrogen increased to 19.6 ± 0.6 in workshop No. 2 and to 19.9 ± 0.6 in workshop No. 3 (P < 0.05).
The revealed increase in residual nitrogen in workshop No. 1 was caused by the accumulation of urea. The content of urea increased by 21, 30 and 26%, reaching 5.0 ± 0.3, 5.6 ± 0.4 and 5.8 ± 0.4 mmol/L as compared to the control values of 4.1 ± 0.1, 4.3 ± 0.2 and 4.6 ± 0.3 mmol/L (P < 0.05).
In workshop No. 2, an increase in urea was identified only by week 12. At this time point, the level of urea was 5.4 ± 0.3 mmol/L. It exceeded the level reported for the control group by 17% (P < 0.05). In workshop No. 3, the level of urea also increased only by week 12 (a 13% increase, P < 0.05).
Blood creatinine in workshop No. 1 increased to 70 ± 3.2, 78 ± 5.1 and 86 ± 5.5 µmol/L, indicating a moderate change of 19, 13 and 26%. In the control group, the levels of creatinine were 58.9 ± 1.2, 62.4 ± 1.5 and 68.4 ± 1.9 µmol/L (P < 0.05). Changes in animals that were kept inside workshops No. 2 and 3 were also within the moderate range. An increase was seen only at 12 weeks. The levels of creatinine reached 82 ± 4.0 µmol/L in workshop No. 2 (a 10% increase as compared to the control group) and 81 ± 4.7 µmol/L in workshop No. 3 (an 18% increase as compared to the control group) (Table 5).
Table 5. Nitrogen metabolism and hydroxyproline excretion in animals kept inside the workshops at UK TMP, JSC.
|
No. |
Parameters
Animal groups |
n |
Blood tests |
Hyp, μg/24 hours |
|||
|
Residual nitrogen |
Urea |
Creatinine |
|||||
|
mmol/L |
µmol/L |
||||||
|
1 |
Control group: 2 weeks |
10 |
17.0 ± 0.4 |
4.1 ± 0.1 |
58.9 ± 1.2 |
18.7 ± 0.5 |
|
|
4 weeks |
9 |
17.2 ± 0.3 |
4.3 ± 0.2 |
62.4 ± 1.5 |
21.2 ± 0.8 |
|
|
|
12 weeks |
9 |
18.1 ± 0.5 |
4.6 ± 0.3 |
68.4 ± 1.9 |
29.4 ± 0.7 |
|
|
|
2 |
Workshop No. 1: 2 weeks |
9 |
18.9 ± 0.5х |
5.0 ± 0.3х |
70 ± 3.2х |
32 ± 2.3ххх |
|
|
4 weeks |
8 |
19.3 ± 0.5х |
5.6 ± 0.4х |
78 ± 5.1х |
35 ± 3.1ххх |
|
|
|
|
12 weeks |
8 |
20.1 ± 0.4х |
5.8 ± 0.4х |
86 ± 5.5х |
42 ± 4.2ххх |
|
|
3 |
Workshop No. 2: 2 weeks |
10 |
18.0 ± 0.5 |
4.7 ± 0.3 |
66.1 ± 5.0 |
28 ± 3.3ххх |
|
|
4 weeks |
9 |
18.8 ± 0.6 |
5.0 ± 0.4 |
74 ± 6.0 |
30 ± 3.1ххх |
|
|
|
|
12 weeks |
9 |
19.6 ± 0.6х |
5.4 ± 0.3х |
82 ± 4.0хх |
35 ± 2.0хх |
|
|
4 |
Workshop No. 3: 2 weeks |
10 |
17.5 ± 0.5 |
4.5 ± 0.3 |
65 ± 3.1 |
26 ± 3.2хх |
|
|
4 weeks |
9 |
18.1 ± 0.7 |
4.8 ± 0.4 |
72 ± 4.5 |
29 ± 2.4ххх |
|
|
|
|
12 weeks |
9 |
19.9 ± 0.6х |
5.2 ± 0.2х |
81 ± 4.7хх |
32 ± 1.1хх |
|
Note: х – Р < 0.05; хх – Р < 0.01; ххх – Р < 0.001
Hydroxyproline excretion is indicative of the degradation of collagen, which is a protein present in the connective tissue. In the 24-hour urine of animals kept inside workshop No. 1, hydroxyproline excretion increased by 71, 65 and 43%, reaching 32 ± 2.3, 35 ± 3.1 and 42 ± 4.2 μg/24 hours (P < 0.001). These values were higher than the control ones at all time points (18.7 ± 0.5 at 2 weeks, 21.2 ± 0.8 at 4 weeks and 29.4 ± 0.7 μg/24 hours at 12 weeks) (Figure 1).
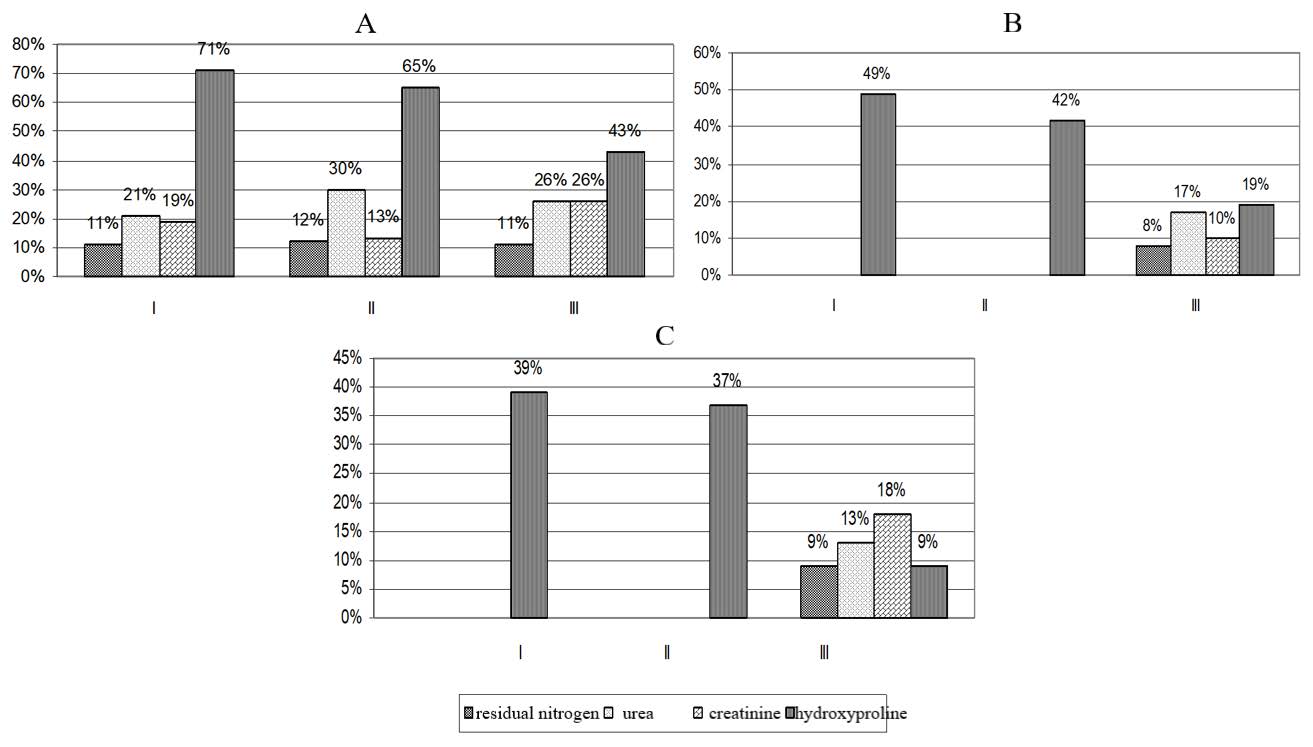
Figure 1. Increase (+) in nitrogen metabolism and hydroxyproline excretion in animals kept inside the workshops at UK TMP, JSC. Experiment time points: І – 2 weeks, ІІ – 4 weeks, ІІІ – 12weeks. Workshops: А – workshop No.1, В – workshop No. 2, С – workshop No. 3.
In animals placed inside workshop No.2, the changes were less drastic. Hydroxyproline excretion changed by 49, 42 and 19%, reaching 28 ± 3.3, 30 ± 3.1 and 35 ± 2.0 μg/24 hours.
In animals that were staying inside workshop No. 3, hydroxyproline exertion increased by 39% after 2 weeks (26 ± 3.2 μg/24 hours, P < 0.01), by 37% after 4 weeks (29 ± 2.4 μg/24 hours, P < 0.001), and by 9% after 12 weeks (32 ± 1.1 μg/24 hours, P < 0.01) as compared to the control group.
These data indicate that soluble forms were responsible for an increase in hydroxyproline at the beginning of the experiment. Hydroxyproline levels decreased by the 12th week due to formation of an insoluble form of hydroxyproline. In other words, hydroxyproline decreases when fibrous tissue lines internal organs and replaces functional elements (in the liver, lungs, and kidneys).
Regarding carbohydrate metabolism, blood glucose and the end products of glycolysis – pyruvic and lactic acids – were determined. In a blood glucose test, animals in workshop No. 1 showed an increase of 40%, 50% and 40% at weeks 2, 4 and 12, respectively, with variables reaching 7.2 ± 0.3; 8.4 ± 0.2 and 9.1 ± 0.4 mmol/L (P < 0.001). In the control group, the following blood glucose levels were registered at the given time points: 5.0 ± 0.2, 5.6 ± 0.6 and 6.5 ± 0.7 mmol/L (Table 6).
Table 6. Carbohydrate metabolism in experimental animals kept inside the workshops at UK TMP, JSC.
|
No. |
Parameters Animal groups |
n |
Glucose, mmol/L |
Pyruvic |
Lactic |
|
acids, μmol/L |
|||||
|
1 |
Control group: 2 weeks |
10 |
5.0 ± 0.2 |
111 ± 3.0 |
2.06 ± 0.1 |
|
4 weeks |
9 |
5.6 ± 0.6 |
136 ± 2.5 |
2.5 ± 0.2 |
|
|
12 weeks |
9 |
6.5 ± 0.7 |
142 ± 3.1 |
3.2 ± 0.1 |
|
|
2 |
Workshop No. 1: 2 weeks |
9 |
7.2 ± 0.3ххх |
126 ± 2.0ххх |
3.4 ± 0.1ххх |
|
4 weeks |
8 |
8.4 ± 0.2ххх |
149 ± 3.0ххх |
4.6 ± 0.1ххх |
|
|
12 weeks |
7 |
9.1 ± 0.4ххх |
164 ± 3.5ххх |
5.8 ± 0.3ххх |
|
|
3 |
Workshop No. 2: 2 weeks |
9 |
6.9 ± 0.1ххх |
121 ± 2.0хх |
2.9 ± 0.2ххх |
|
4 weeks |
8 |
7.2 ± 0.4хх |
139 ± 3.0 |
3.6 ± 0.1ххх |
|
|
12 weeks |
8 |
8.1 ± 0.4хх |
158 ± 3.0ххх |
3.9 ± 0.2х |
|
|
4 |
Workshop No. 3: 2 weeks |
9 |
6.6 ± 0.2ххх |
129 ± 1.0ххх |
3.6 ± 0.2ххх |
|
4 weeks |
8 |
7.4 ± 0.2ххх |
135 ± 1.5 |
2.9 ± 0.1х |
|
|
12 weeks |
8 |
8.5 ± 0.3хх |
151 ± 2.0хх |
4.2 ± 0.4хх |
|
Note: х – Р < 0.05; хх – Р < 0.01; ххх – Р < 0.001
Blood glucose levels measured in animals placed in workshop No. 2 exceeded those in the control group by 40, 30 and 20% (6.9 ± 0.1 at P < 0.001, 7.2 ± 0.4 and 8.1 ± 0.4 at P < 0.01). In animals kept in workshop No. 3, blood glucose levels increased by 30% at week 2 and then maintained at this level at weeks 4 and 12 (6.6 ± 0.2, 7.4 ± 0.2 and 8.5 ± 0.3 mmol/L) (Figure 2).
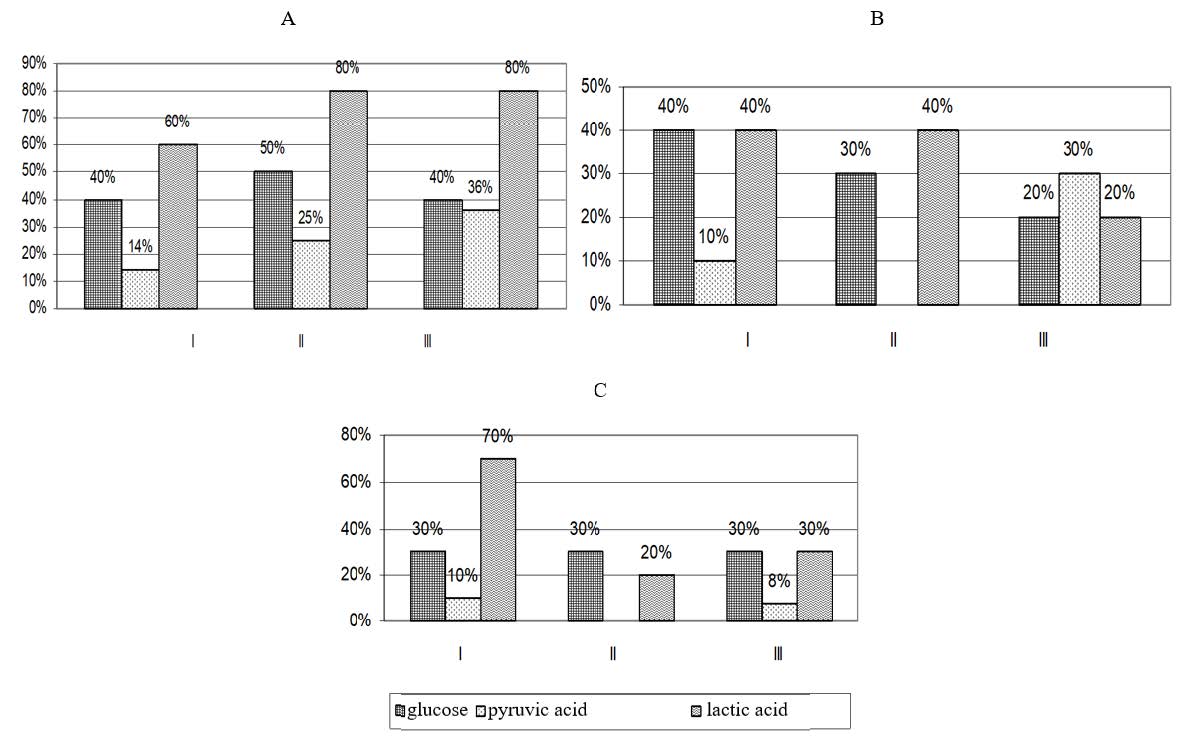
Figure 2. Increase (+) in carbohydrate metabolism in experimental animals kept inside the workshops at UK TMP, JSC. Experiment time points: І – 2 weeks, ІІ – 4 weeks, ІІІ – 12 weeks
Workshops: А – workshop No. 1, В – workshop No. 2, С – workshop No. 3Blood lactic acid measured in animals in workshop No. 1 increased by 60% after 2 weeks (to 3.4 ± 0.1 μmol/L at P < 0.001) and by 80% after 4 and 12 weeks (to 4.6 ± 0.1 and 5.8 ± 0.3 at P < 0.001) as compared to the control group (2.06 ± 0.1, 2.5 ± 0.2 and 3.2 ± 0.1 μmol/L). In animals in workshop No. 2, blood lactic acid content increased by 40% at weeks 2 and 4 (2.9 ± 0.2 and 3.6 ± 0.1, P < 0.001), and by 20% at week 12 (3.9 ± 0.2, P < 0.05). In animals staying inside workshop No. 3, the levels of lactic acid increased sharply by 70% after 2 weeks (to 3.6 ± 0.2 at P < 0.001). Further, lactic acid slightly increased by 20 and 30% at weeks 4 and 12 (to 2.9 ± 0.1 at P < 0.05 and 4.2 ± 0.4 μmol/L at P < 0.01). The levels of lactic acid tended to increase across all time points.
After 2 weeks of the experiment, blood pyruvic acid in animals in workshop No. 1 increased by 14% as compared to the control group (126 ± 2.0 vs. 111 ± 3.0, P < 0.001). At weeks 4 and 12, the blood content of pyruvic acid increased significantly, by 25 and 36% (149 ± 3.0 and 164 ± 3.5, respectively). At the same time points, the levels of pyruvic acid in the control group were 136 ± 2.5, 142 ± 3.1 (P < 0.001). Blood pyruvic acid in animals in workshop No. 2 increased by 10% at week 2 (121 ± 2.0 μmol/L, P < 0.01); at week 12, it reached 158 ± 3.0 (P < 0.001). In animals that were staying inside workshop No. 3, blood pyruvic acid increased to 129 ± 1.0 (P < 0.001) at week 2 and 151 ± 2.0 (P < 0.01) at week 12. Thus, the levels of pyruvic acid in animals kept inside the workshops at UK TMP, JSC tended to increase across all time points.
Adaptive responses and metabolic processes occurring in the body of plant workers having different length of service
Nitrogen metabolism and hydroxyproline excretion tests were performed on 196 workers holding the main positions at UK TMP, JSC and 100 people in the control group. Nitrogen metabolism was assessed based on the residual non-protein nitrogen, urea, and creatinine data, whereas the state of connective tissue components was assessed by measuring hydroxyproline excretion (a specific protein amino acid).
Nitrogen metabolism showed a general statistically significant tendency to creatinine increase with a change of 9% (87.1 ± 1.3 μmol/L) as compared to the control group (80.1 ± 0.8 μmol/L), P < 0.05. At the same time, there was a significant increase of 44% in hydroxyproline excretion as compared to the control values (29.2 ± 1.4 vs 20.23 ± 0.58 μg/24 hours). The variables are shown in Tables 7 and 8.
People with the length of service of up to 3 years had a 51% increase in Hyp (Figure 3). Workers having the length of service of 3-5 years experienced an increase in both blood creatinine and Hyp excretion levels (10 and 44% increase, respectively). Workers with the length of service of 6-10 years had a 12% increase in blood creatinine (significant change) and a 37% increase in the levels of Hyp excretion as compared to the control values.
A slight decrease in hydroxyproline across individuals with the length of service of more than 3 years is apparently related to a slight decrease in soluble collagen fraction. The latter occurs due to development of internal organs fibrosis, i.e., transition of soluble collagen fractions into insoluble ones.
Table 7. Nitrogen metabolism and 24-hour urinary Hyp excretion in workers depending on the length of service.
|
No. |
Years of service |
n |
Blood tests |
Hyp, μg/24 hours |
||
|
Residual nitrogen |
Urea |
Creatinine |
||||
|
mmol/L |
μmol/L |
|||||
|
1 |
Up to 3 years |
30 |
19.8 ± 0.2 |
4.8 ± 0.11 |
82.4 ± 1.4 |
30 ± 1.2ххх |
|
2 |
3-5 years |
30 |
20.3 ± 0.6 |
4.6 ± 0.13 |
86.2 ± 1.2х |
32.3 ± 1.0ххх |
|
3 |
6-10 years |
22 |
21.2 ± 0.3 |
4.9 ± 0.10 |
88.6 ± 1.5ххх |
28.2 ± 1.2ххх |
|
4 |
More than 10 years |
20 |
21.9 ± 0.4 |
4.7 ± 0.12 |
92.2 ± 1.1ххх |
26.4 ± 1.5ххх |
|
Total, mean ± standard deviation |
102 |
20.7 ± 0.3 |
4.9 ± 0.10 |
87.1 ± 1.3х +9% |
29.2 ± 1.4ххх +44% |
|
Note: х – р < 0.05; ххх – р < 0.001 as compared to the control group (Table 8)
Table 8. Nitrogen metabolism and 24-hour urinary Hyp excretion in the control group workers depending on the length of service.
|
No. |
Years of service |
n |
Blood tests |
Hyp, μg/24 hours |
||
|
Residual nitrogen |
Urea |
Creatinine |
||||
|
mmol/L |
μmol/L |
|||||
|
1 |
Up to 3 years |
29 |
19.8 ± 0.3 |
4.8 ± 0.11 |
80.9 ± 1.1 |
19.9 ± 0.6 |
|
2 |
3-5 years |
25 |
20.2 ± 0.2 |
4.9 ± 0.2 |
78.6 ± 1.0 |
22.4 ± 0.6 |
|
3 |
6-10 years |
24 |
21.4 ± 0.3 |
4.7 ± 0.2 |
79.2 ± 1.2 |
20.6 ± 0.9 |
|
4 |
More than 10 years |
22 |
19.4 ± 0.2 |
5.0 ± 0.1 |
81.6 ± 1.3 |
18.0 ± 0.3 |
|
Total, mean ± standard deviation |
100 |
20.2 ± 0.24 |
4.85 ± 0.14 |
80.1 ± 0.8 |
20.23 ± 0.58 |
|
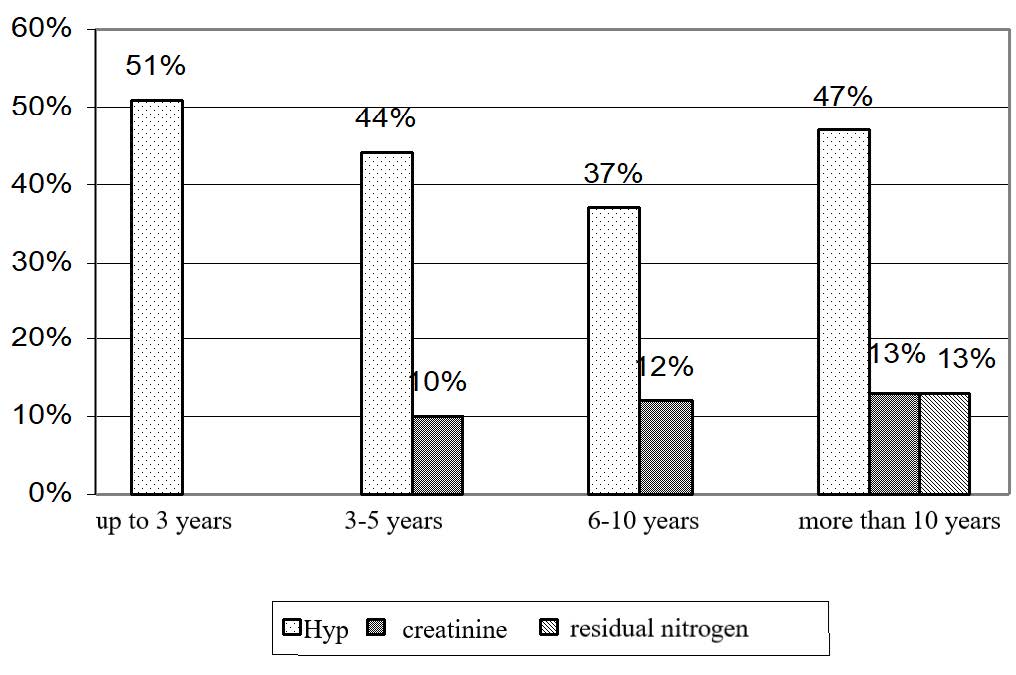
Figure 3. Increase and decrease (+, -) in nitrogen metabolism and 24-hour urinary Hyp excretion in workers employed at UK TMP, JSC depending on the length of service.
People working at the plant for more than 10 years demonstrated significant changes in residual non-protein nitrogen (13% higher than the control values), creatinine (13% higher than the control values) and Hyp excretion (47% higher than the control values). The results obtained correlated with those obtained in the experiment with inhalation of titanium slag dust. The quantitative differences can be explained by a more sophisticated human regulation system.
Apparently, the plant workers did not experience any special changes in the composition of blood residual nitrogen and urea. Blood content of creatinine, which is one of the end products of nitrogen metabolism, increased moderately, especially in people having the length of service of up to 3 years and 3-5 years. It is worth mentioning that increased creatinine indicates decreased kidney function.
The level of 24-hour urinary Hyp excretion may clearly indicate the dysfunction of the connective tissue components. Due to unfavorable production factors, especially dust and gases, this dysfunction develops into fibrosis.
The tests for nitrogen metabolism and 24-hour urinary hydroxyproline excretion yielded ambiguous results for workers employed at different workshops. The most drastic changes in blood creatinine and urinary hydroxyproline were observed in workshop No. 1 (magnesium production): creatinine and hydroxyproline increased by 15% (P < 0.01) and 74% (P< 0.001), respectively, as compared to the control group (Table 9).
Table 9. Nitrogen metabolism and 24-hour urinary Hyp excretion in workers holding the main positions at UK TMP, JSC.
|
No. |
Years of service |
n |
Blood tests |
Hyp μg/24 hours |
||
|
Residual nitrogen |
Urea |
Creatinine |
||||
|
mmol/L |
μmol/L |
|||||
|
1 |
Workshop No. 1 |
52 |
21.0 ± 0.3 |
4.75 ± 0.11 |
91.8 ± 1.1хх |
35.1 ± 1.0ххх |
|
2 |
Workshop No. 2 |
66 |
21.0 ± 0.2 |
4.8 ± 0.12 |
87.8 ± 1.3хх |
27.4 ± 1.0ххх |
|
3 |
Workshop No. 3 |
78 |
20.5 ± 0.6 |
4.61 ± 0.12 |
85.9 ± 1.2х |
29 ± 0.2ххх |
Note: х – р < 0.05; хх – р < 0.01; ххх – р < 0.001 as compared to the control group (Table 8)
Changes in the contents of creatinine and Hyp in workshops No. 2 and 3 were less pronounced: creatinine increased by 10% and 7% (P < 0.01 and P < 0.05), and hydroxyproline excretion increased by 35% and 43%, respectively. The results obtained correlated with those obtained in the animal experiment described above (Figure 4).
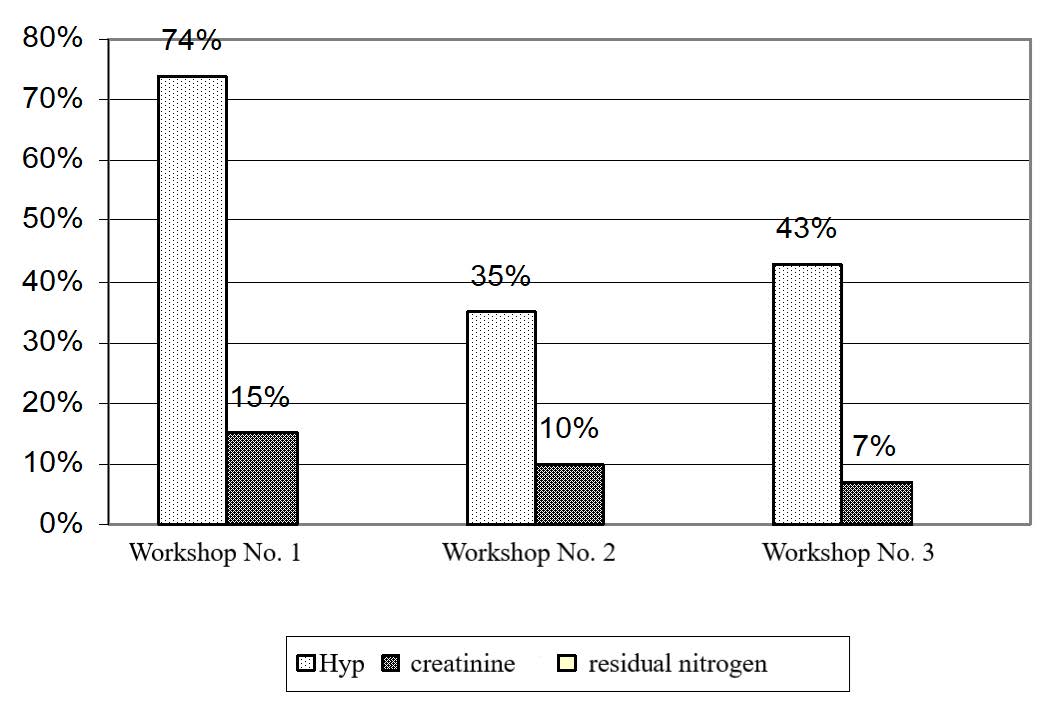
Figure 4. Increase and decrease (+, -) in nitrogen metabolism and 24-hour urinary Hyp excretion in workers holding the main positions at UK TMP, JSC.
Thus, workers holding the main positions at UK TMP, JSC had significant changes in their levels of creatinine and hydroxyproline excretion. This parameter objectively characterizes the exacerbation of sclerosis involving internal organs induced by a number of production factors.
The concentration of pollutants (fine dust, titanium oxide, and titanium chloride) in the body of plant workers
Carbohydrate metabolism (the levels of glucose, pyruvic and lactic acids) was assessed for 187 workers holding the main positions at UK TMP, JSC and for 100 individuals in the control group. Glucose levels tended to increase insignificantly up to 4.5 ± 0.5 mmol/L as compared to the control group (4.1 ± 0.6 mmol/L). Details are given in Tables 10 and 11. Blood concentration of pyruvic acid (pyruvate) increased in plant workers by 25% as compared to the control group and reached 113 ± 2.6 μmol/L (P < 0.001). Blood content of lactic acid (lactate) in workers holding the main positions at UK TMP, JSC increased by 54% as compared to that in the control group (P < 0.001).
Finally, blood glucose levels were insignificantly elevated among the workers with the length of service of up to 3 years, 6-10 years and more than 10 years. The levels of pyruvate generated from the primary carbohydrate metabolites were significantly increased in all experience groups.
Table 10. Carbohydrate metabolism in workers holding the main positions at UK TMP, JSC depending on the length of service.
|
No. |
Years of service |
n |
Blood tests |
||
|
Glucose |
acid |
||||
|
pyruvic |
lactic |
||||
|
mmol/L μmol/L |
|||||
|
1 |
Up to 3 years |
29 |
3.6 ± 0.5 |
115 ± 2.1ххх |
1.72 ± 0.02ххх |
|
2 |
3-5 years |
32 |
3.7 ± 0.4ооо |
106 ± 1.4ххх |
1.94 ± 0.03ххх |
|
3 |
6-10 years |
23 |
4.8 ± 0.5 |
114 ± 2.0ххх |
1.86 ± 0.01ххх |
|
4 |
More than 10 years |
21 |
5.9 ± 0.6оо |
121 ± 2.9ххх |
1.94 ± 0.04ххх |
|
Total, mean ± standard deviation |
100 |
4.5 ± 0.5 |
113 ± 2.6ххх |
1.87 ± 0.02ххх |
|
The levels of pyruvic acid in workers having the length of service of up to 3 years, 6-10 years and more than 10 years increased stably and significantly (Figure 5). The increase was 22, 28 and 31%, respectively (P < 0.001), as compared to the control group. In people with the length of service of 3-5 years, the content of pyruvic acid increased by 10% as compared to people in the control group having the same length of service. It should be mentioned that an increase in pyruvic acid can become more apparent in people with vitamin B deficiency, liver hypoxia, and pituitary adrenal system adaptive rearrangements.
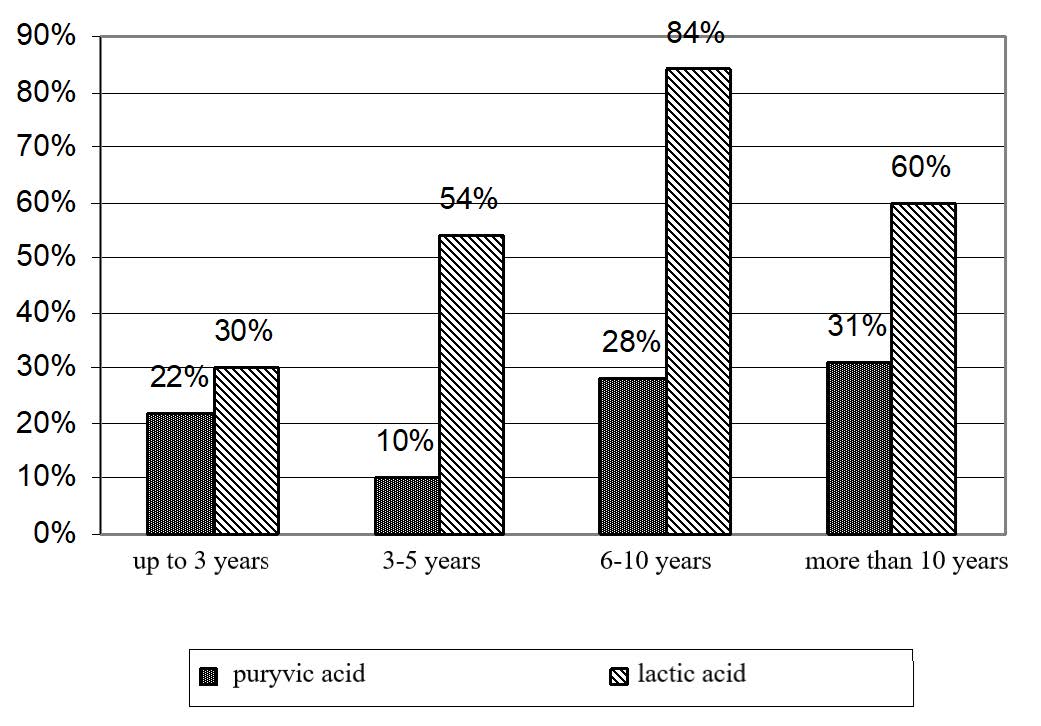
Figure 5. Increase and decrease (+, -) in carbohydrate metabolism in workers employed at UK TMP, JSC depending on the length of service.
Blood tests for lactic acid, which is the end product of glycolysis and glycogenolysis, revealed the biggest increase in workers having the length of service of 6-10 years. The resulting values exceeded the control values obtained for people with the same length of service by 84% (Table 11).
Table 11. Carbohydrate metabolism in the control group workers depending on the length of service.
|
No. |
Years of service |
N |
Blood tests |
||
|
Glucose |
acid |
||||
|
pyruvic |
lactic |
||||
|
mmol/L μmol/L |
|||||
|
1 |
Up to 3 years |
30 |
3.4 ± 0.6 |
94.2 ± 1.4 |
1.32 ± 0.04 |
|
2 |
3-5 years |
26 |
3.8 ± 0.5 |
95.8 ± 1.6 |
1.26 ± 0.03 |
|
3 |
6-10 years |
25 |
4.2 ± 0.6 |
89.2 ± 1.1 |
1.01 ± 0.025 |
|
4 |
Up to 10 years |
21 |
5.1 ± 0.7 |
92.3 ± 1.3 |
1.21 ± 0.05 |
|
Total, mean ± standard deviation |
100 |
4.1 ± 0.6 |
90.4 ± 1.5 |
1.21 ± 0.036 |
|
The smallest increase in lactic acid was observed in workers with the length of service of up to 3 years. The resulting value was 30% higher than for the control group (P < 0.001). In people having the length of service of 3-5 years and more than 10 years, the contents of lactic acid increased by 54 and 60% as compared to the control group.
Evidence shows that accumulation of lactic acid is caused by strenuous work. In addition, lactic acid accumulates under hypoxic conditions, which develop due to unfavorable production factors. In these circumstances, the breakdown of glucose and glycogen switches to anaerobic glycolysis and glycogenolysis. The latter causes an increase in lactic acid.
Carbohydrate metabolism tests on workers holding the main positions at UK TMP, JSC (Table 12 and Figure 6) demonstrated that glucose levels were within the normal range. In contrast to the control group, there was an insignificant increasing tendency among workers in workshop No. 1 and an insignificant decreasing tendency among workers in workshops No. 2 and 3.
Table 12. Carbohydrate metabolism in workers holding the main positions at UK TMP, JSC (distribution by workshops).
|
No. |
Workers |
N |
Blood tests |
||
|
Glucose |
acid |
||||
|
pyruvic |
lactic |
||||
|
mmol/L μmol/L |
|||||
|
1 |
Workshop No. 1 |
50 |
4.7 ± 0.4 |
120 ± 2.5ххх |
2.0 ± 0.03ххх |
|
2 |
Workshop No. 2 |
65 |
3.9 ± 0.1оо |
115 ± 2.0ххх |
1.96 ± 0.02ххх |
|
3 |
Workshop No. 3 |
72 |
3.8 ± 0.3 |
105 ± 1.2хх |
1.88 ± 0.01ххх |
|
4 |
Control group |
100 |
4.1 ± 0.6 |
90.4 ± 1.5 |
1.21 ± 0.036 |
Note: хх – р < 0.01; ххх – р < 0.001 as compared to the control group (Table 12); оо – p < 0.01, intergroup comparison
The blood levels of pyruvic acid were significantly increased in workers in all workshops. However, the biggest increase was reported for workshop No. 1, where pyruvic acid increased by 32% (P < 0.001) as compared to the control group (90.4 ± 1.5 μmol/L). The increase in blood pyruvate levels was more moderate in workers in workshop No. 2 (by 27%) and the most modest in workers in workshop No. 3 (by 16%) as compared to the control group (P < 0.001 and P < 0.01).
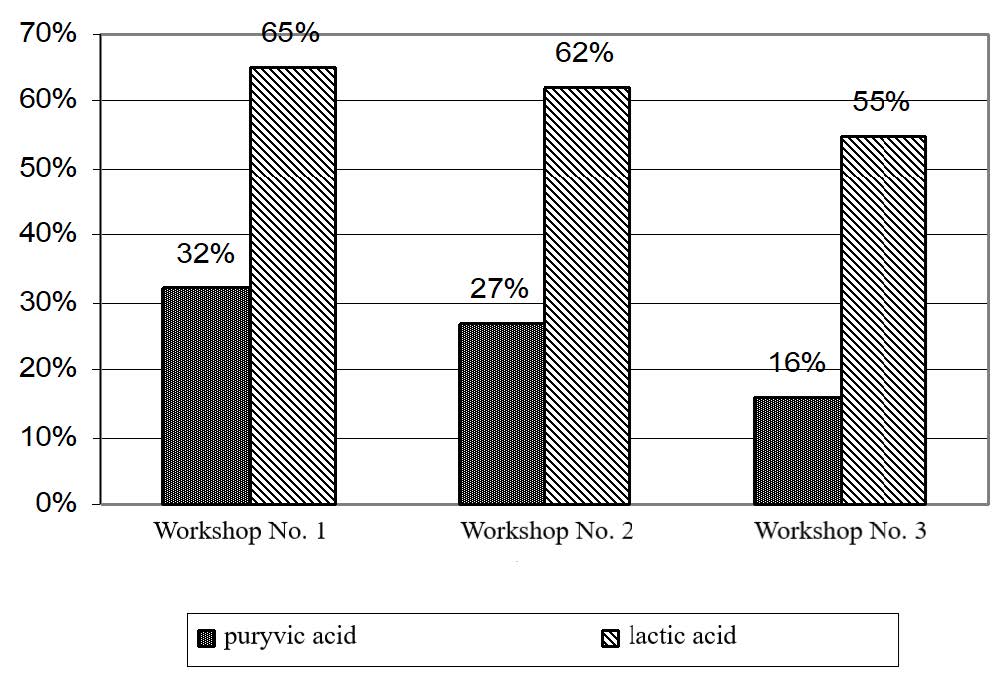
Figure 6. Increase and decrease (+, -) in carbohydrate metabolism in workers holding the main positions at UK TMP, JSC (distribution by workshops).
The blood contents of lactic acid were significantly increased in workers in all workshops. Workshops No. 1 and 2 had a 65 and 62% increase as compared to the control group, and workshop No. 3 had a 55% increase.
DISCUSSION
The morbidity pattern of titanium production workers often includes such diseases as bronchitis, pneumonia, laryngotracheitis, myositis, skin and subcutaneous tissue diseases, nervous system diseases (Hou et al., 2019; Liu et al., 2010; Acar et al., 2015). Chronic dust bronchitis and pneumoconiosis have been diagnosed in workers who are exposed to TiO2 dust and Ti. Exposition to toxic chemicals (TiC14, НС1, Cl2, etc.) leads to chronic toxic pneumosclerosis caused by chronic bronchitis (Coccini et al., 2015; Lammel et al., 2019). The results allowed the researchers to identify the changes occurring at the level of biochemical processes, carbohydrate and nitrogen metabolism. These changes were irreversible. The results obtained in this study correlate closely with those of other scholars who concluded that titanium oxide and other metals (indium, tin) oxides used in nanomaterial development can cause significant oxidative DNA damage (Liou et al., 2017).
Investigators are aware of the fact that titanium mono- and disulfide have weak fibrogenic and systemic toxic effects (Biola-Clier et al., 2020). After intratracheal delivery of sulfides, the experimental animals demonstrated an increase in the activity of serum and liver aminotransferases, an increase in the activity of blood cholinesterase, a change in the liver content of nucleic acids, and a change in the kidneys and serum contents of urea (Behnam et al., 2018; Fujiwara et al., 2015).
Pathomorphological changes in the internal organs were characterized by the signs of liver and kidneys parenchymal dystrophy (Leppänen et al., 2011; Wu et al., 2021). A moderate inflammatory proliferative response occurred within the interalveolar septa, at the sites of dust particles localization (Ermakov et al., 2021). The results of the experiment designed to identify impaired lipid oxidation among 80 workers (who were involved in the production of nanomaterials from titanium dioxide, silicon, carbon tubes) and members of the control group (office workers) showed that the most toxic effect was produced by titanium dioxide. An increased urine content of toxicants was recorded. The above was confirmed by the data obtained in the described experiment for a group of laboratory animals and for workers involved in titanium production.
The experiment performed on rabbits suggests that titanium dioxide causes dysfunction of various organs and systems. Besides, it changes the activities of multiple enzymes, such as aldolase, cholinesterase, alkaline phosphatase, aspartate aminotransferase, and alanine aminotransferase. These effects were seen when rabbits were exposed to titanium dioxide alone and in combination with other elements (zinc, lead, iron, arsenic, antimony, copper, fluorine, cadmium) (Fujiwara et al., 2015).
The experiment on animals indicates that titanium dioxide and titanium metal dust can cause changes both in the lung tissue and bronchial lymph nodes. 6-8 months after intratracheal delivery of titanium dioxide dust, white rats exerted a proliferative cellular response at the sites of dust accumulations and hyperplastic lymphoid follicles around the bronchi. These data coincide with previous findings – other scholars have reported changes in carbohydrate metabolism induced by titanium oxide (Shabbir et al., 2021). This study has supplemented the available nitrogen metabolism data, as nitrogen metabolism was also seriously impaired in laboratory animals.
The authors of this article found that workers holding the main positions at UK TMP, JSC had their levels of glucose fluctuating within the control range. The data obtained enabled the researchers to characterize the changes in carbohydrate metabolism related to a number of production factors. At the same time, the study is limited to titanium production, which is not the same as the production of other metals, technologically. Therefore, the present findings cannot be applied to other types of metallurgy.
CONCLUSION
The experiment involving titanium and magnesium production operators revealed that the first changes in nitrogen metabolism occur after 2 weeks of exposure. Changes in carbohydrate metabolism were identified and confirmed. Significant changes in nitrogen and carbohydrate metabolism were recorded at weeks 4 and 12. All these changes were indicative of the toxic production.
Increased nitrogen metabolism (a 20% increase in creatinine) suggests kidney damage. Highest priority tests for adaptive changes performed among workers at UK TMP can be recommended as instruments for routine check-ups. They will help identify risk groups and develop early measures (hygienic and medical) for disease prevention. The present findings are universal and can be used for comparison in studies investigating the impact of titanium and its compounds in other regions. Future research may focus on the effects of other toxic metals used in nanomaterial production on human health. In addition, it is interesting to compare the effects of titanium and its compounds at a metallurgical plant and at a plant specialized in nanomaterial production. It is possible that keeping a group of laboratory animals and assessing their state can be a reliable marker of the contamination levels at a metallurgical enterprise.
AUTHOR CONTRIBUTIONS
All authors contributed to the study conception and design. Material preparation, data collection and analysis were performed by KD, GS, AT, AS and AS. The first draft of the manuscript was written by AE. All authors read and approved the final manuscript.
CONFLICT OF INTEREST
The authors declare that there are no conflicts of interest related to this article.
ETHICS APPROVAL
The research was conducted ethically in accordance with the World Medical Association Declaration of Helsinki. The research was approved by the local ethics committees of Non-Commercial Joint-Stock Company East Kazakhstan University named after Sarsen Amanzholov.
REFERENCES
Acar, M., Bulut, Z., Ateş, A., Nami, B., Koçak, N., and Yıldız, B. 2015. Titanium dioxide nanoparticles induce cytotoxicity and reduce mitotic index in human amniotic fluid-derived cells. Human & Experimental Toxicology. 34: 74–82.
Ali, I., Suhail, M., Alothman, Z.A., and Alwarthan, A. 2018. Recent advances in syntheses, properties and applications of TiO2 nanostructures. RSC Advances. 8: 30125–30147.
Baranowska-Wójcik, E., Szwajgier, D., Oleszczuk, P., and Winiarska-Mieczan, A. 2020. Effects of titanium dioxide nanoparticles exposure on human health—A review. Biological Trace Element Research. 193: 118–129.
Behnam, M.A., Emami, F., Sobhani, Z., Dehghanian, A.R., 2018. The application of titanium dioxide (TiO2) nanoparticles in the photo-thermal therapy of melanoma cancer model. Iranian Journal of Basic Medical Sciences. 21: 1133-1139.
Biola-Clier, M., Gaillard, J.-C., Rabilloud, T., Armengaud, J., and Carriere, M. 2020. Titanium dioxide nanoparticles alter the cellular phosphoproteome in A549 cells. Nanomaterials. 10: 185.
Coccini, T., Grandi, S., Lonati, D., Locatelli, C., and De Simone, U., 2015. Comparative cellular toxicity of titanium dioxide nanoparticles on human astrocyte and neuronal cells after acute and prolonged exposure. Neurotoxicology. 48: 77–89.
Dakieva, K.Z., Tsyganov, A.P., Egorina, A.V., Sharipkhanova, A.S., Sedelev, V.A., Sadykanova, G.E., and Chursin, A.S., 2020. The effect of work environment on the biochemical profile of workers operating at the ust-kamenogorsk titanium and magnesium plant. Toxicology and Industrial Health. 36: 591-603.
Dakieva, K.Z., Tusupova, Z.B., Zhautikova, S.B., Loseva, I.V., Dzhangozina, D.N., Beysembaeva, R.S., Idrisheva, Z.K., and Zhamanbaeva, M.K. 2018. Studying the benefits of green wworkplace environment on health promotion in sympathoadrenal and kallikrein-kinin systems. Ekoloji. 27: 1087-1097.
Ermakov, V., Safonov, V., and Dogadkin, D. 2021. Characteristic features of molybdenum, copper, tungsten and rhenium accumulation in the environment. Innovative Infrastructure Solutions. 6: 104.
Fujiwara, R., Luo, Y., Sasaki, T., Fujii, K., Ohmori, H., and Kuniyasu, H. 2015. Cancer therapeutic effects of titanium dioxide nanoparticles are associated with oxidative stress and cytokine induction. Pathobiology. 82: 243–251.
Hou, J., Wang, L., Wang, C., Zhang, S., Liu, H., Li, S., and Wang, X. 2019. Toxicity and mechanisms of action of titanium dioxide nanoparticles in living organisms. International Journal of Environmental Science and Technology 75: 40–53.
Hsiao, I.L. and Huang, Y.J., 2011. Effects of various physicochemical characteristics on the toxicities of Zno and TiO2 nanoparticles toward human lung epithelial cells. Science of the Total Environment. 409: 1219-1228.
Iavicoli, I., Leso, V., and Bergamaschi, A. 2012. Toxicological effects of titanium dioxide nanoparticles: A review of in vivo studies. Journal of Nanomaterials 2012: 5.
Khan, I., Saeed, K., and Khan, I. 2019. Nanoparticles: Properties, applications and toxicities. Arabian Journal of Chemistry. 12: 908-931.
Koedrith, P., Kim, Y.J., Kim, Y., Kang, J.-H., and Seo, Y.R. 2018. Intrinsic toxicity of stable nanosized titanium dioxide using polyacrylate in human keratinocytes. Molecular & Cellular Toxicology. 14: 273–282.
Lammel, T., Mackevica, A., Johansson, B.R., and Sturve, J. 2019. Endocytosis, intracellular fate, accumulation, and agglomeration of titanium dioxide (TiO2) nanoparticles in the rainbow trout liver cell line RTL-W1. Environmental Science and Pollution Research. 26: 15354–15372.
Landsiedel, R., Ma‐Hock, L., Kroll, A., Hahn, D., Schnekenburger, J., Wiench, K., and Wohlleben, W., 2010. Testing metal‐oxide nanomaterials for human safety. Advanced Materials. 22: 2601-2627.
Leppänen, M., Korpi, A., Miettinen, M., Leskinen, J., Torvela, T., Rossi, E.M., Vanhala, E., Wolff, H., Alenius, H., Kosma, V.-M., Joutsensaari, J., Jokiniemi, J., and Pasanen, P. 2011. Nanosized TiO2 caused minor airflow limitation in the murine airways. Archives of Toxicology. 85: 827–839.
Liou, S.H., Wu, W.T., Liao, H.Y., Chen, C.Y., Tsai, C.Y., Jung, W.T., and Lee, H.L. 2017. Global DNA methylation and oxidative stress biomarkers in workers exposed to metal oxide nanoparticles. Journal of Hazardous Materials. 331: 329-335.
Liu, R., Zhang, X., Pu, Y., Yin, L., Li, Y., Zhang, X., Liang, G., Li, X., and Zhang, J. 2010. Small-sized titanium dioxide nanoparticles mediate immune toxicity in rat pulmonary alveolar macrophages in vivo. Journal of Nanoscience and Nanotechnology. 10: 5161–5169.
Lv, J., Christie, P., and Zhang, S. 2019. Uptake, translocation, and transformation of metal-based nanoparticles in plants: Recent advances and methodological challenges. Environmental Science. 6: 41–59.
Magdolenova, Z., Bilaničová, D., Pojana, G., Fjellsbø, L.M., Hudecova, A., Hasplova, K., Marcomini, A., and Dusinska, M. 2012. Impact of agglomeration and different dispersions of titanium dioxide nanoparticles on the human related in vitro cytotoxicity and genotoxicity. Environmental Monitoring and Assessment. 14: 455-464.
Manke, A., Wang, L., and Rojanasakul, Y. 2013. Mechanisms of nanoparticle-induced oxidative stress and toxicity. BioMed Research International 2013: 942916.
Saehana, S., Prasetyowati, R., Hidayat, M.I., Arifin, P., and Khairurrijal, A. 2011. Efficiency improvement in TiO2-particle based solar cells after deposition of metal in spaces between particles. International Journal of Basic and Applied Sciences. 11: 15-28.
Safonov, V. 2022. Dependence of antioxidant and biochemical status on selenium content in the blood of animals. Advances in Animal and Veterinary Sciences. 10: 263–269.
Shabbir, S., Kulyar, M.F.E.A., Bhutta, Z.A., Boruah, P., and Asif, M. 2021. Toxicological consequences of titanium dioxide nanoparticles (TiO2 NPs) and their jeopardy to human population. Bionanoscience. 11: 621-632.
Shi, H., Magaye, R., Castranova, V., and Zhao, K. 2013. Titanium dioxide nanoparticles: A review of current toxicological data. Particle and Fibre Toxicology. 10: 15.
Stepanov, A.L., Xiao, X., and Ren, F. 2013. Implantation of titanium dioxide with transition metal ions. In Prafulla, K.J., ed., titanium dioxide: Applications, synthesis and toxicity (pp. 59–83). Nova Science Publishers, Inc.
Sungur, Ş. 2020. Titanium dioxide nanoparticles. I: Kharissova, O.V., Torres-Martínez, L.M., Kharisov, B.I., eds., Handbook of nanomaterials and nanocomposites for energy and environmental applications (pp. 713–730). Springer.
Tang, T., Zhang, Z., and Zhu, X. 2019. Toxic effects of TiO2 NPs on zebrafish. International Journal of Environmental Research and Public Health. 16: 523.
Toyooka, T., Amano, T., and Ibuki, Y. 2012. Titanium dioxide particles phosphorylate histone H2AX independent of ROS production. Mutation Research/Genetic Toxicology and Environmental Mutagenesis. 742: 84–91.
Ventsova, I., and Safonov, V. 2021. Biochemical criteria for the development mechanisms of various reproduction disorders in dairy cows. Biodiversitas Journal of Biological Diversity. 22: 4997–5002.
Wu, W.T., Jung, W.T., and Lee, H.L. 2021. Lipid peroxidation metabolites associated with biomarkers of inflammation and oxidation stress in workers handling carbon nanotubes and metal oxide nanoparticles. Nanotoxicology. 15: 577–587.
Zhang, R., Bai, Y., Zhang, B., Chen, L., and Yan, B. 2012. The potential health risk of titania nanoparticles. Journal of Hazardous Materials. 211: 404–413.
OPEN access freely available online
Natural and Life Sciences Communications
Chiang Mai University, Thailand.
Kulzipa Dakieva1, *, Gulnaz Sadykanova2, Anatoliy Tsyganov1, Anatoliy Chursin1, Anargul Sharipkhanova2, and Anna Egorina1
1 Department of Ecology and Geography, Non-Commercial Joint-Stock Company East Kazakhstan University named after Sarsen Amanzholov, Ust-Kamenogorsk, Kazakhstan.
2 Department of Biology, Non-Commercial Joint-Stock Company East Kazakhstan University named after Sarsen Amanzholov, Ust-Kamenogorsk, Kazakhstan.
*Corresponding author: Kulzipa Dakieva, E-mail: dakieva_k@rambler.ru
Total Article Views
Editor: Veerasak Punyapornwithaya,
Chiang Mai University, Thailand
Article history:
Received: June 10, 2022;
Revised: November 18, 2022;
Accepted: November 22, 2022;
Published online: November 30, 2022