 ISSN: 2822-0838 Online

A Bibliometric Analysis of Indonesia Biodiversity Identification through DNA Barcoding Research from 2004-2021
Dwi Sendi Priyono, Fajar Sofyantoro, Wahyu Aristyaning Putri, Nur Indah Septriani, Annas Rabbani, and Tuty Arisuryanti*Published Date : 2023-01-05
DOI : https://doi.org/10.12982/NLSC.2023.006
Journal Issues : Number 1, January-March 2023
Abstract Indonesia is well-known for having a vast and rich endowment of unique and genetically diverse biodiversity resources. Currently, initiatives are taking place around the world to generate DNA barcode libraries to make these data available to better understand biodiversity. The objectives of this study are to document DNA barcode research trends and detect the extent to which its application has evolved in Indonesia. The analysis was investigated using a compilation of 446 published papers, obtained from Harzing's Publish or Perish 8. The number of DNA barcode publication records has increased by a geometric average of 15.4/year. The number of studies involving molecular identification (30.1%), species and genetic diversity (10%), and evolutionary or phylogenetic studies (10%) appears to have driven much of the publication activity. The top three taxa studied include fishes (32.7%), plants (24.8%), and invertebrates (12.5%; except insects). We discovered that using a single molecular marker is still dominant (62.8%). We conclude that the practices of DNA barcoding data are likely to become a valuable resource in many sectors and focuses. However, the number of Indonesian DNA barcode records in public databases is relatively lower than in other mega biodiversity countries. The establishment of DNA barcoding initiatives and a national DNA barcode reference library in Indonesia would promote DNA barcoding applications to help conserve Indonesia biodiversity.
Keywords: Biodiversity, DNA barcode, Indonesia, Research trends
Citation: Priyono, D.S., Sofyantoro,F., Putri, W.A., Septriani, N.I., Rabbani, A., and Arisuryanti, T. 2023. A bibliometric analysis of indonesia biodiversity identification through DNA barcoding research from 2004-2021. Nat. Life Sci. Commun. 22(1): e2023006.
INTRODUCTION
Indonesia is labeled as one of the mega biodiversity countries in the world. The 17,000 islands comprising the Indonesian archipelago foster the development of diverse biogeographic and ecological factors allowing the establishment of various types of habitats and a high number of endemic species (Lohman et al., 2011; De Bruyn et al., 2014). In terms of biodiversity, second only to the Amazon rain forests, Indonesia hosts a large number of indigenous plants with high potential for medicinal and pharmaceutical opportunities (Elfahmi et al., 2014). For the fauna diversity, around 16% of the world’s reptiles, 12% of the total species of mammals, and 17% of identified birds occur in Indonesia (von Rintelen et al., 2017). However, environmental changes and human activities put Indonesia’s megadiverse fauna and flora under a constant threat of extinction. Therefore, the biodiversity crisis in Indonesia raises an urgent need for comprehensive biodiversity assessments to accelerate scientific exploration and conservatory efforts (Dubois 2010; von Rintelen et al., 2017).
Biodiversity inventories, which have typically been based on morphological techniques, are a crucial component of the biogeographic study (Ashfaq et al., 2017). The traditional approach to taxonomy relying on morphological characteristics is hindered by various factors, including the difficulties in obtaining specimens, decreasing number of taxonomists, and possible bias of specimens’ descriptions (Hebert and Gregory 2005). Molecular analysis has the advantage of revealing patterns of regional genetic divergence as well as allowing comparisons of biodiversity at broader geographical and taxonomic levels (Murray et al., 2016). DNA barcoding is widely used for specimen identification and species discovery (Goldstein and DeSalle 2011). Throughout its development, DNA barcoding contributes to various applications in conservation and biodiversity, including elucidation of cryptic species and establishing taxonomic relations between immature larvae and adults.
In recent years, the growing library of DNA barcodes for various taxon allows for more swift and precise assignment of newly identified species. Early reports utilizing the DNA barcoding techniques were generally acknowledged as additional data from a molecular perspective that supports the well-established taxonomic system. The clear advantage of DNA barcoding techniques relies on the low percentage of conflicts between the molecular and morphological data. Therefore, in recent years, DNA barcodes emerged as a critical player in integrative taxonomy that helps to unify the morphological, behavioral, and ecological aspects of specimens. The DNA barcode approach has proven to be quite helpful in resolving taxonomic issues for endemic Indonesian species such as the anoa (Priyono et al., 2018), freshwater fishes (Hubert et al., 2016), Halmahera walking shark (Maduppa et al., 2020), Rasbora group (Muchlisin et al., 2012), and medicinal plants species from Indonesia (Amandita et al., 2019).
The rapid growth of DNA barcodes as biodiversity exploration tools invites a systematic examination of their application in the conservation efforts of biodiversity in Indonesia. Our study aims to document DNA barcode research trends and detect the extent to which its application has evolved in Indonesia. We use a bibliometric analysis approach to uncover valuable patterns and insights in DNA barcode research in Indonesia, as has been done in many biodiversity studies (e.g. Stork and Astrin 2014; Sofyantoro et al., 2022; Tan et al., 2022; Yu et al., 2022). This insight allows us to assess any novel patterns or trends for practical purposes, particular taxa in the identification of biodiversity, as well as the limitations of DNA barcode research in Indonesia. We have also highlighted potential future directions for Indonesian barcoding research.
MATERIALS AND METHODS
Indonesia DNA barcode records in Barcode of Life Data (BoLD) System
To assess Indonesia's amount of barcode data collected and shared, the current number of records and related species were obtained from BoLD, one of the world's most authoritative online barcode databases, using the keyword "Indonesia." At the same time, the coordinates of those records were downloaded so that their geographic distribution could be visualized. We have acquired the coordinate data acquired from the public data portal from https://www.boldsystems.org/. For comparison, barcode data from the nine countries with the highest National Biodiversity Index (NBI) based on the Convention on Biological Diversity (CBD) were downloaded: Indonesia, Colombia, Mexico, Brazil, Ecuador, Australia, Venezuela, Peru, and China.
Data collection for DNA barcode research in Indonesia
Data on DNA barcode research in Indonesia was collected using Harzing's Publish or Perish 8 (Harzing 2010). The program is free and allows users to quickly obtain Bibliometrics data easily. It can also be connected to Google Scholar. This research ghatered data by collecting all publications containing the phrase "DNA barcode", “DNA barcoding”, “Indonesia”, or the name of each province in Indonesia in titles, abstracts, and keywords. The publications data used in this study were downloaded from the Google scholar databases with a range from 2004 (1 January 2004) to 2021 (31 December 2021). The database from Google scholar is a leading bibliographic database and could be used alone for systematic reviews (Gehanno et al., 2013). Peer-reviewed journal articles and theses were the publication's target data. General magazines and books were excluded. The collected data was used to create a corpus of texts that included abstracts, titles, keywords, published years, and journal names. All documents were downloaded in January 2022. For subsequent analyses, we manually removed duplicate records.
Analysis of the collected data
The information from each publication was then listed, covering taxonomic groups, research focus, molecular marker, and journal to highlight the challenges and potential future directions of DNA barcoding research in Indonesia. We categorize the focus research from the DNA barcode collected publications into nine categories: molecular identification, species or genetic diversity, evolutionary or phylogenetic, species discovery, population genetics, taxonomic knowledge, conservation, developing methods, and medical. Molecular identification has the main focus only on molecular characterization of an organism without any effect on environment or development or physiological state of the organism. Species or genetic diversity focuses on determining genetic variation within or between species. The research of evolutionary history of a species or group, particularly regarding lines of descent and relationships among broad groups of organisms, is categorized as evolutionary or phylogenetic. The term of species discovery uses DNA barcode data to support the description of a newly discovered species. The term population genetics focuses on the variations in the DNA barcodes found within groups of individuals on a population or biogeographical level. Taxonomic knowledge term is used to categorize research that focuses on naming, arranging, classifying, and describing organisms into groups and classes using DNA barcodes. The term conservation refers to research that uses DNA barcode information to assist biodiversity conservation management. Developing methods term is research that focuses on the development of steps, primers, methods, or analysis to obtain DNA barcode data. The medical term is used for studies that use DNA barcode information for medical purposes to improve the health and well-being of people.
In addition, based on the markers utilized, we want to map out the implications of DNA barcode research in Indonesia. We categorize the use of markers into three types: 1) Single molecular marker, the DNA barcode research that only uses one molecular marker; 2) Multi molecular marker, the DNA barcode research that uses more than one molecular marker, and; 3) Combination, the DNA barcode research that combines molecular markers with other markers (such as morphology, bioacoustics, behavior, etc.).
Science mapping is an important bibliometrics approach (Powell et al., 2016). It can indicate the discipline situation as well as the phase of development (Garousi and Mäntylä 2016). There are many software programs available for bibliometrics study. In this paper, VOSviewer (Van Eck and Waltman 2010) was used to generate visualization mapping. The keywords of the co-occurrence network of DNA barcode studies in Indonesia were analyzed using the VosViewer program. The R statistics program was used for several analyses(version 2022.02.0+443) (Rstudio Team, 2021), such as geometric average trend and alluvial plot analysis using ggplot2 package (Wickham et al., 2016).
RESULTS
Indonesia DNA barcode records in Barcode of Life Data (BoLD) System
According to survey results from the global DNA barcode library BoLD system, published DNA barcodes from Indonesia comprise 55,350 records with a total of 7,825 species, forming 9,095 BINs (clusters), and deposited in 167 institutions, as of January 2022. The top 5 orders most stored in the database include Coleoptera (10,450), Lepidoptera (9,402), Hymenoptera (3,572), Perciformes (1,699), and Cypriniformes (1,451). From Convention Biological Diversity (CBD) data, Indonesia has the highest NBI value globally (1.00). Although Indonesia has the highest NBI, the number of species DNA barcodes recorded in the database is still lower than in other nations with high NBIs, such as Australia (365,051), China (133,282), Mexico (100,837), and Brazil (79,276) (Figure 1). DNA barcode data have been geographically distributed throughout almost all of Indonesia's regions (Figure 2). Although DNA barcode research appears to be concentrated regions, such as Java-Bali, Sumatra, and Papua.
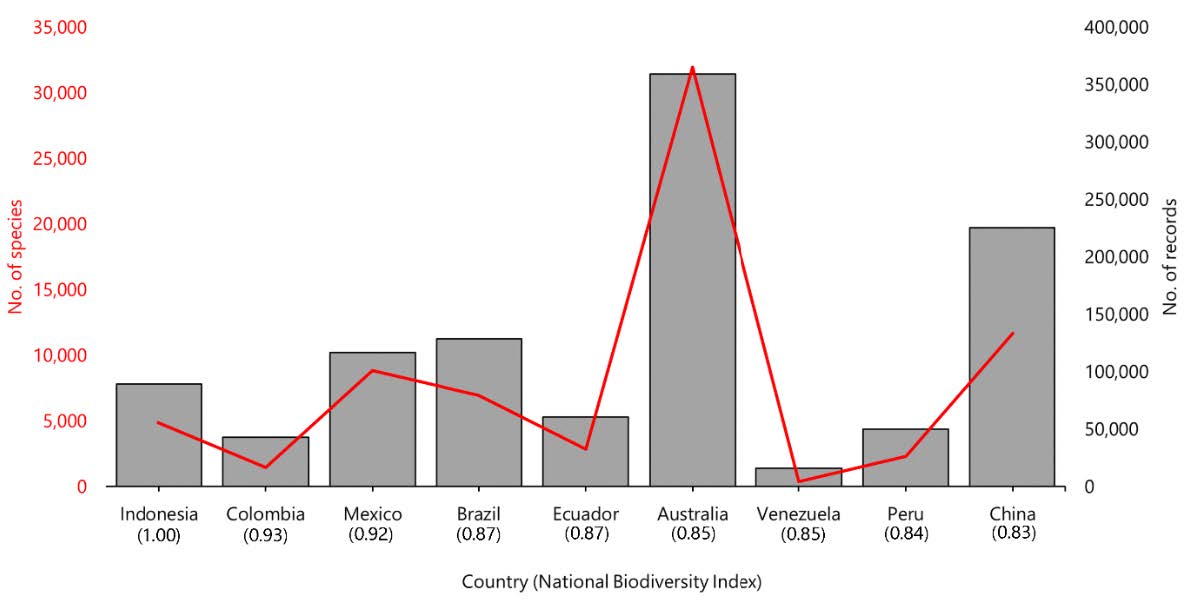
Figure 1. Total number of barcoding records from the nine countries with the highest NBI. On the X-axis, countries are shown, while the Y-axis indicates the number of barcode records (grey bar) and species (solid red line). The NBI is given under the country’s name.
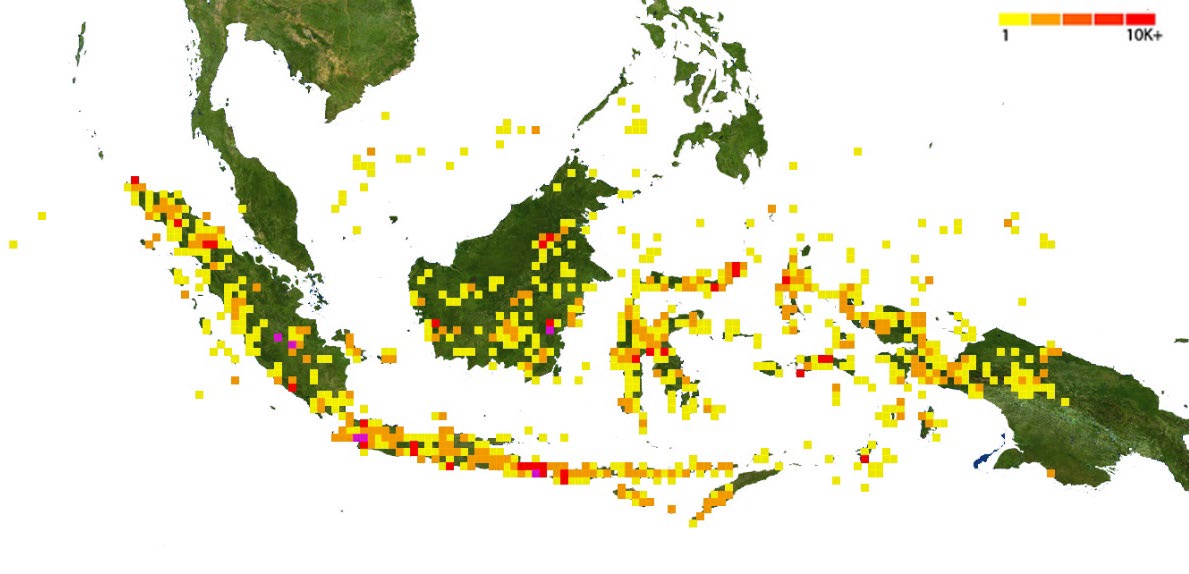
Figure 2. Geographic distribution of DNA barcodes in the BoLD. The yellow-red color indicates the number of barcodes recorded.
DNA barcode research trend in Indonesia
According to Google Scholar data mining, with years ranging between 2004 and 2021, 446 DNA barcode research articles from Indonesia were published. The first publication of DNA barcodes in Indonesia appeared in 2008. In the five years since the first article was published in 2008, DNA barcodes research has progressed slowly. DNA barcode publication records have increased by a geometric average of 15.4 per year. According to the data, the number of publications increased from the 2013s to 2021 (Figure 3). More than ten papers were published in 2013s. The number of publications abruptly increased in the 2021s, and more than 100 papers were published.
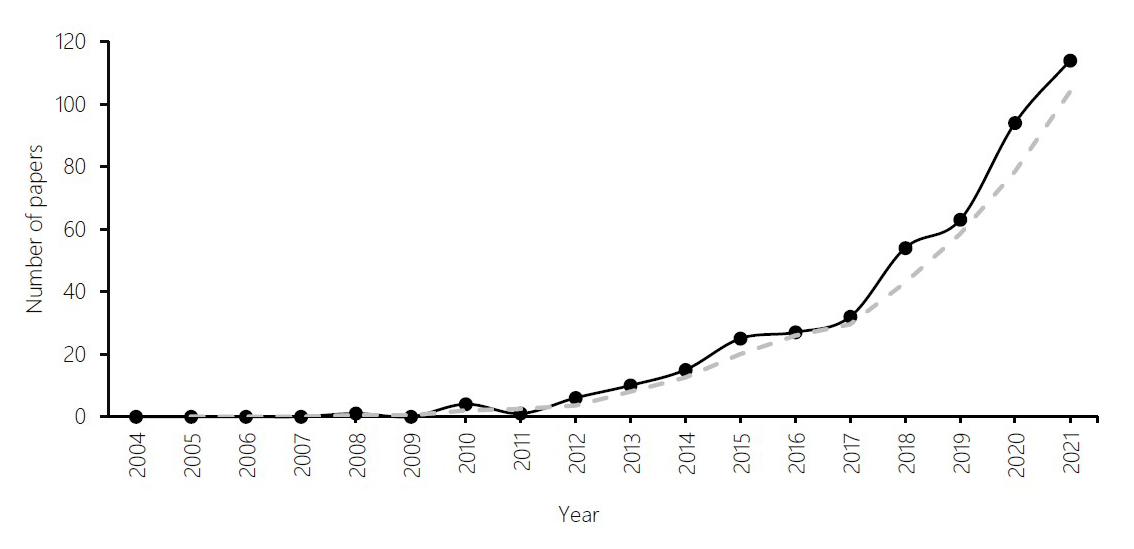
Figure 3. Change in the number of published papers about DNA Barcode in Indonesia since 2004.
Molecular identification has the most significant number of publications with a total of 173 papers accounting for 38.8%, followed by species or genetic diversity (64), evolutionary or phylogenetic (52), species discovery (49), population genetics (36), taxonomic knowledge (35), conservation (18), developing methods (16), and medical (3) (Figure 4). This study also found that single molecular markers were utilized in the majority of DNA barcode research in Indonesia (62.8%) rather than combinations of molecular markers and other biological markers (29.6%) or multiple molecular markers (7.6%). Although, almost all DNA barcoding research focuses in Indonesia were dominated by the use of single molecular markers, except for species discovery and taxonomic knowledge, which were dominated by the use of combinations between molecular and other biological markers (species discovery, 89.8%; taxonomic knowledge, 62.8%). In terms of the taxon, most studies examined fishes (146), followed by plants (111), invertebrates (except insects; 56), insects (51), microbes (22), mammals (22), aves (13), amphibian & reptiles (11), algae (7), and fungi (7) (Figure 5).
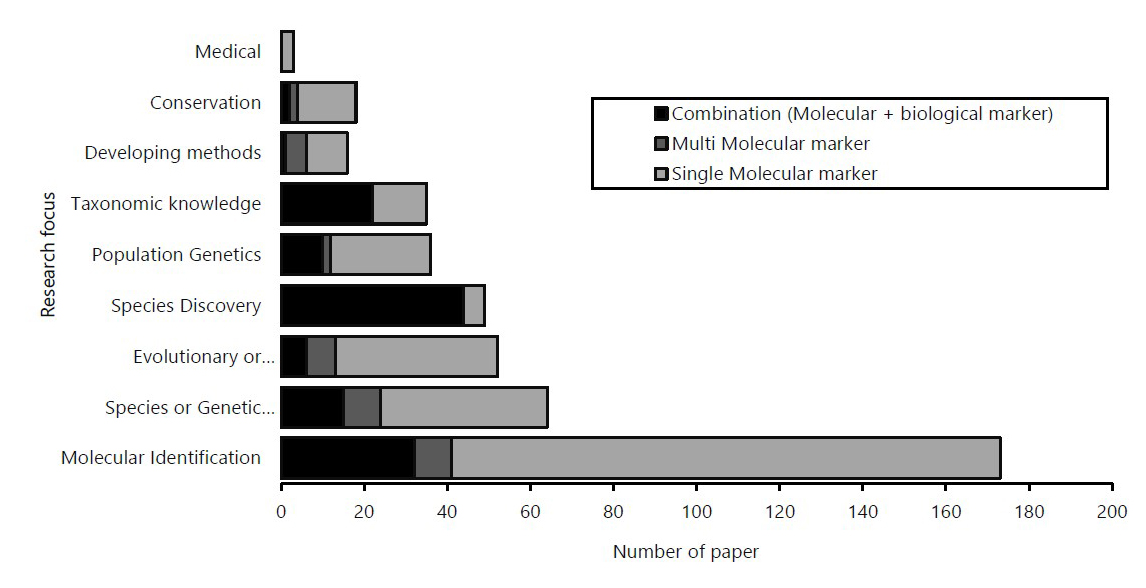
Figure 4. DNA barcode research focuses on Indonesia. The X-axis represents the number of papers, and the Y-axis represents the research focus. The color in the barplot shows the proportion of markers used.
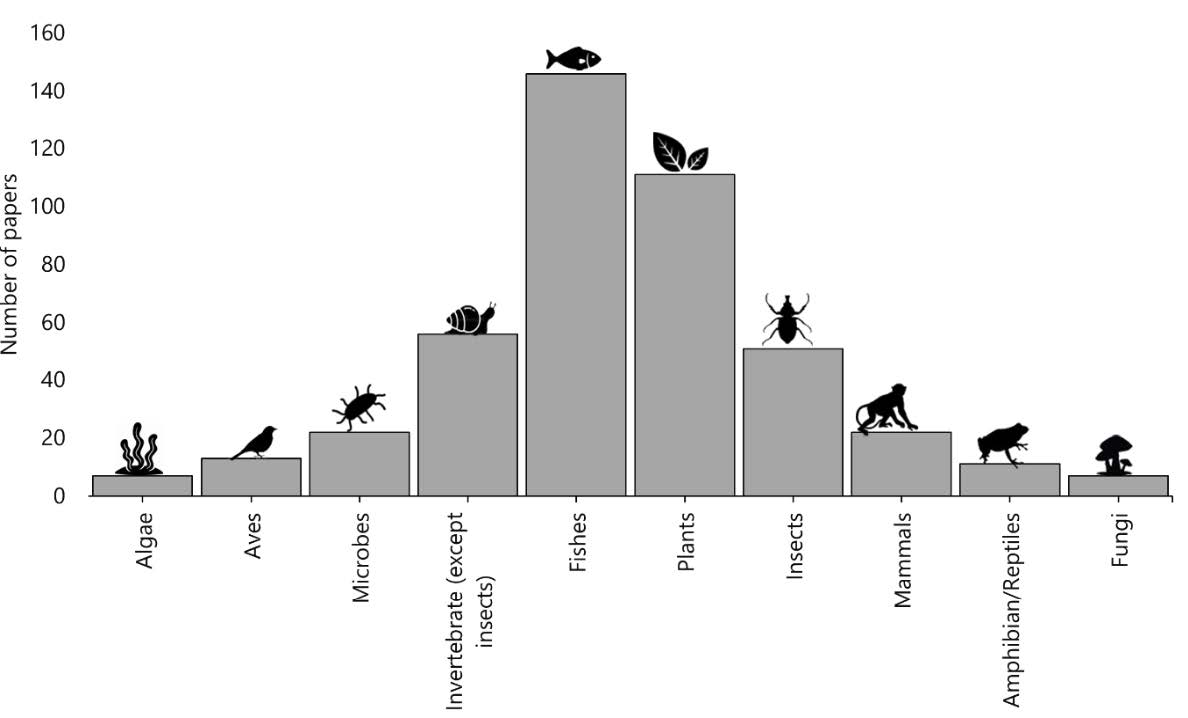
Figure 5. Total number of DNA barcode studies since 2004 grouped by taxon.
The VOSviewer program generated the keyword co-occurrence network of DNA barcode studies in Indonesia (Figure 6). The weights of the nodes are represented by the size of the nodes and words. The distance between two nodes represents the strength of a connection. A shorter distance indicates a stronger connection. The connection between the two terms denotes that they also existed together.The thicker the line, the more likely they are to appear together. A cluster is formed by nodes with the same color. VOSviewer classified the terms in the abstracts of Indonesia DNA barcode publications into six clusters. The most frequent occurrences of the term in the abstract of the DNA barcode studies were “DNA barcoding" (61), "taxonomy" (22), “phylogeny” (19), “COI” (19), “DNA” (16), “animals” (15). Visualization of an alluvial diagram that explains the correlation of several components between the taxon, research focus, and the molecular markers used indicates that each component is spread out with other components (Figure 7).
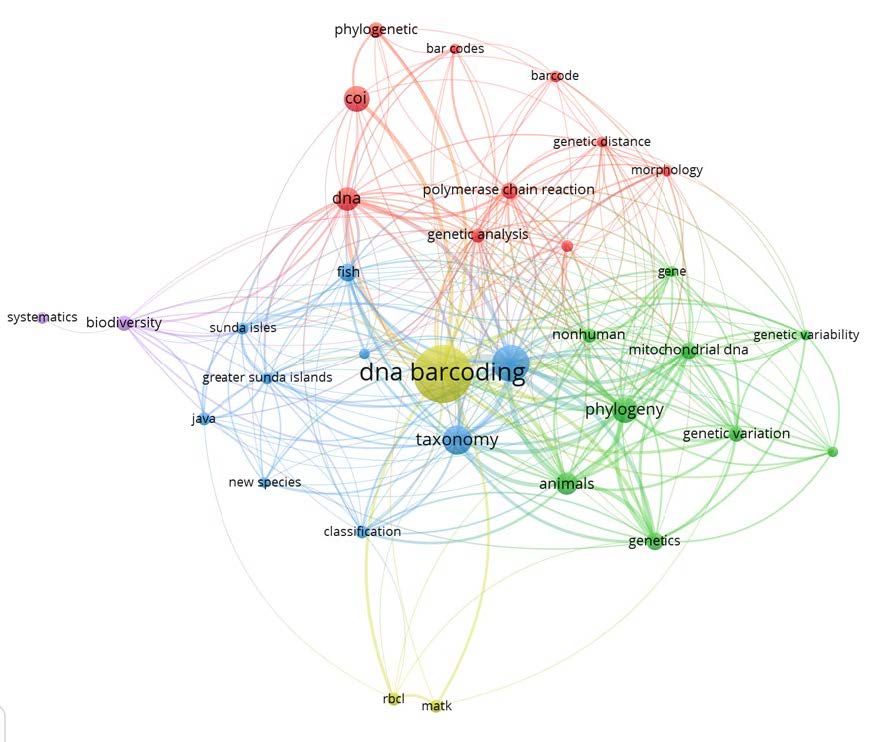
Figure 6. Network visualization map of most frequent terms in abstracts of the retrieved paper on DNA barcode studies in Indonesia (2004-2021).
DISCUSSION
The Indonesian DNA barcodes records
Indonesia is one of the top 25 biodiversity hotspots on the earth (Myers et al., 2000), with the highest NBI value globally (1.00). However, it appears that the number of DNA barcode records from Indonesia in the database is still relatively low compared to other countries, such as Australia, China, Mexico, and Brazil. We identify plausible reasons for the larger amount of DNA barcode records in these countries. These countries have DNA barcode research initiatives, so can adopt this technique more rapidly and more massively. For example, Australia immediately responded by adopting the DNA barcode technology method, and one of the initiators of DNA barcodes has collaborated on research to identify almost all fish species in Australia (Ward et al., 2005). In addition, earlier DNA barcode research initiatives and projects, such as the Australian Barcode of Life Network (ABOLN) and the DNA Barcoding Framework Data Initiative (Bioplatforms Australia), are developed in Australia. China researchers have also contributed significantly to the international community of DNA barcoding research. The "China Plant BOL (Barcode of Life) Group," for example, was established by 62 researchers from 19 research institutes and universities across the country to conduct an in-depth study on seed plant DNA barcoding. Mexico has also launched an initiative to establish the Mexican Barcode of Life (MEXBOL) (Elías-Gutiérrez and León-Regagnon 2013), a nationwide network whose main goals are to train students and promote interaction and collaborative work among researchers interested in this field (Elías-Gutiérrez and León-Regagnon 2013). These four higher countries (America, China, Brazil and Mexico) have been registered as nodes of the project by the International Barcode of Life Consortium (iBOL) (https://ibol.org/about/ibol-consortium). Nodes are iBOL-affiliated networks of leading researchers and organizations focusing on DNA barcoding and/or funding and advancing biodiversity science in a country or region. Unfortunately, Indonesia is not yet a member of this international consortium. The participation of Indonesian researchers in this consortium could help increase the biodiversity DNA barcode database. Many research programs have been launched in this consortium to better comprehend biodiversity, including BARCODE 500K in 2015 (https://ibol.org/programs/barcode-500k/) and BIOSCAN in 2019, which will reveal global biodiversity. Moreover, GenBank is a reliable resource for 21st-century biodiversity research with a wide range of applications, including environmental change studies (Leray et al., 2019), so Indonesian researcher needs to establish initiatives with this potential comprehensively.
Although it seems that the distribution of DNA barcode specimens is almost dispersed throughout Indonesia, some regions have a higher density. The Java-Bali, Sumatra, and Papua regions have high densities of DNA barcodes recorded in BoLD. These regions have long captured the attention of biologists, so studies have succeeded in documenting DNA barcodes and producing hundreds of DNA barcodes recorded in the BoLD, such as the study of ichthyodiversity in Java-Bali (Dahruddin et al., 2017; Hutama et al., 2017), vertebrate fauna in West Papua (Arida et al., 2021), and flowering plants in Sumatra (Amandita et al., 2019). However, the Kalimantan region requires an initiative to document DNA barcodes, particularly for endemic species. This initiative is essential since Kalimantan is one of the significant evolutionary hotspots for Southeast Asian biodiversity (De Bruyn et al., 2014), with many undescribed species and numerous species on the brink of extinction, owing to habitat loss (Curran et al.,2004; Takahashi et al.,2017; Verstegen et al.,2019). The potential of DNA barcode exploration for Kalimantan biodiversity would help many of these previously unknown species.
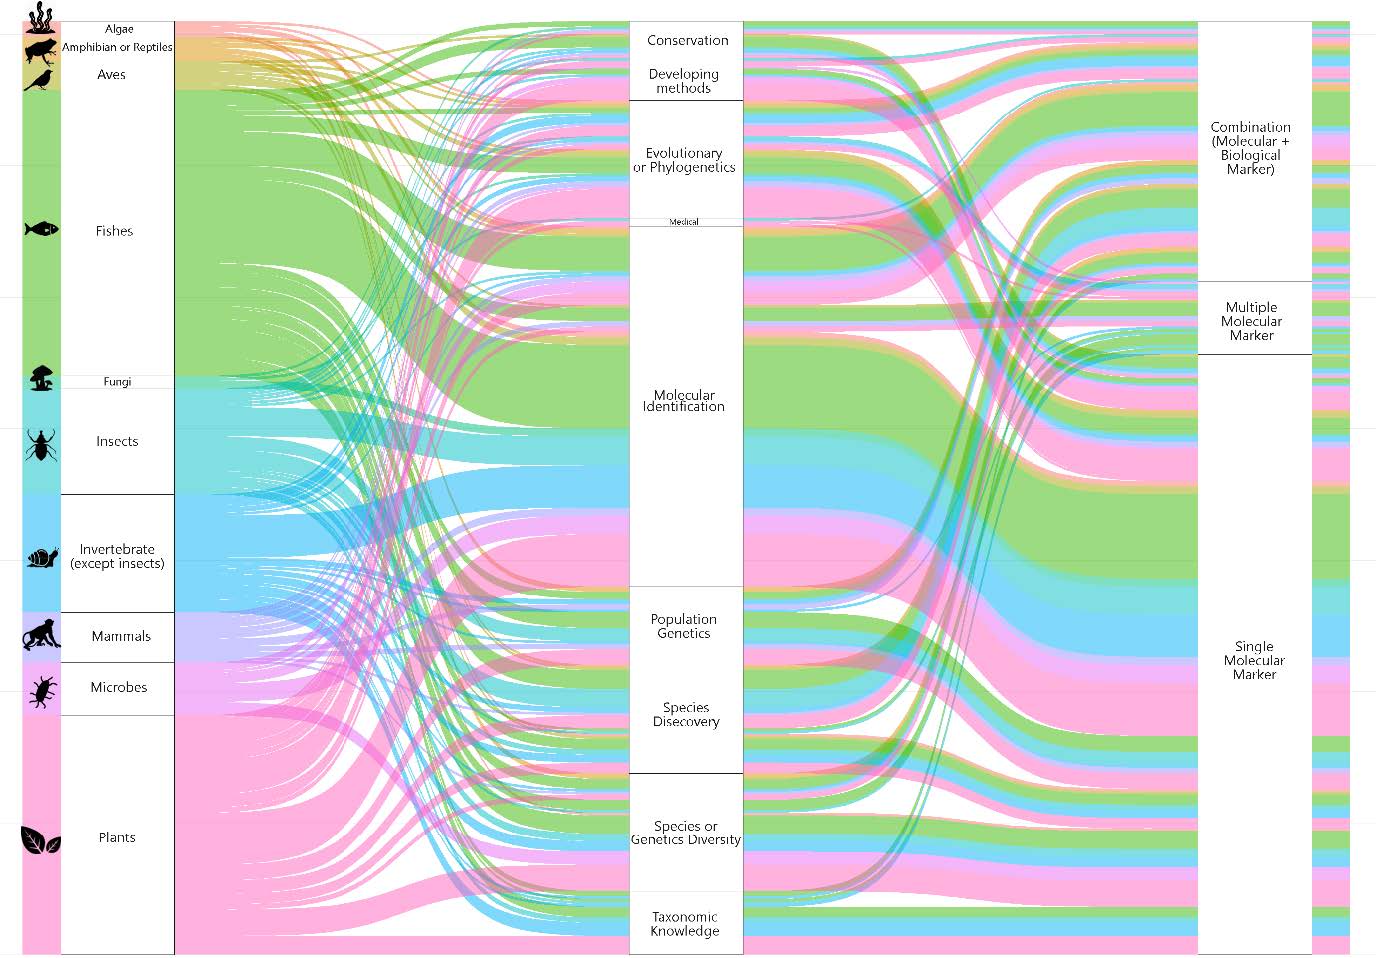
Figure 7. Alluvial diagram: the flow diagram shows on the left the taxon under study that composes each research focus (shown in the center) and the aggregation of the research focus into the molecular marker used. The dimension of rectangles on the right is proportional to the frequency. Colors indicate the taxon.
Indonesian DNA barcode research trend
The DNA barcode approach was introduced in 2003 (Hebert et al., 2003). Unfortunately, Indonesian researchers are a bit late to adopting DNA barcode research. A DNA barcode publication from Indonesia appeared in 2008. In 2007, LIPI researchers presented the Initiative DNA Barcoding Research in Indonesia at the Consortium Barcode of Life (CBOL) conference in Taiwan (Zein and Prawiradilaga 2013). In this decade, Indonesian researchers have well adopted DNA barcoding research for various biodiversity assessments. This trend has the potential to continue, especially since a large part of Indonesia's biodiversity remains unknown, and taxonomy knowledge is still incomplete and scattered in the scientific literature (Moura and Jetz 2021). The implications of DNA barcodes are also growing with various focuses on exploring biodiversity. The DNA barcoding concept has the potential to be expanded to other types of genomic data as a result of advances in next-generation sequencing technology and declining prices for genome sequencing. The active development and use of extended DNA barcodes via genome skimming is suggested by Coissac (et al., 2016) to supplement the standard barcoding method. In order to enhance and expand DNA barcodes, genome skimming is also important for exposing biodiversity, improving microbial, animal and plant systematics (Dodsworth 2015; Hotaling et al., 2021; Larsen et al., 2014; Straub et al., 2012). Thus, the genome skimming method is valuable as a scalable and movable bridge between conventional barcodes and genome sequencing.
Molecular identification is the most focused DNA barcode topic in Indonesia. DNA barcoding was first used to enable species taxonomic identification easier by providing a fast and accurate procedure that did not require taxonomic knowledge (Hebert and Gregory 2005). Recently, researchers have changed their focus from barcode technology exploration and verification to applications and solutions to practical problems in the taxonomic groups in which they specialize.
Researchers are increasingly employing single molecular markers for analysis because of the cost-effectiveness, availability of databases in Genbank, reduced time requirements, and more straightforward bioinformatics analysis. On the other hand, single-locus DNA barcoding results in successful species identification in most cases. For example, herpetofauna from Germany had a success rate of nearly 100% (Hawlitschek et al., 2016), Chinese rats had a success rate of more than 90% (Li et al., 2015), and mosquitoes in Singapore had a success rate of 100% (Chan et al., 2014). Unfortunately, the success rate of species identification was low for species complexes with gene flow or when species had recently diverged (van Velzen et al., 2012). This application intends to supplement genetic data, which has significant limitations when used alone for DNA barcode species identification. Indeed, because intra-specific differences are more important than inter-specific differences for the clades under investigation, one of the most common causes of barcoding failure is when demographic differences reduce the barcoding gap. To put it another way, two individuals could have the same barcoding sequence but be from two different species. Various species of spiders (Spasojevic et al., 2016), birds (Aliabadian et al., 2013), and fish (Mabragana et al., 2011) have been found to share haplotypes. When different species share haplotypes, single-locus barcoding is prone to misidentification. Currently, the discovery of many new species uses a combination of markers or genomics to obtain more detailed information (Hollingsworth et al., 2011; Anderson et al., 2013; Pante et al.,2015; Priyono et al.,2020) along with the progress in the genome sequencing era now enables the large-scale generation of reference genomes. We expect that as the cost of DNA sequencing declines, multilocus barcoding will displace existing single-locus DNA barcoding technologies as a way to understand life’s diversity better.
Fish has the highest number of DNA barcoding publications compared to another taxon in Indonesia. The abundance of fish species in Indonesia may have contributed to this value. Freshwater fish species densities in Indonesia are among the highest globally (i.e., 0.6 species per 1000 km2) (Hubert et al., 2015). DNA barcoding as a first step toward rapid species description using a combination of COI sequences, brief morphological observations, and high-resolution photographic imagery enables the description of a more significant number of species. Hubert et al., (2012) initiated the use of this method in the Indonesian ichthyofauna, demonstrating its utility by concurrently describing eight new rainbowfish species from Papua's bird head, depending on a species variation assessment using DNA barcodes. Furthermore, research on fish DNA barcoding intends to increase in Indonesia. Through the ministry of marine and fisheries, the government continues to provide support for fish genetic research. Recently, they have launched the Indonesian fish genetic bank application “e-Genetik Ikan Indonesia (e-Genetikan)” (http://103.80.239.77/pages/home.php), which currently records 2,186 fish genetic data from 835 total distributions. e-Genetikan integrates various data on Indonesian fish genetic resources spread across multiple institutions into a single system that allows easy access for stakeholders for various purposes. This effort is quite crucial in helping to uncover Indonesia's rich fish biodiversity, and it should be replicated in other taxonomic groups in Indonesia.
In Indonesia, the use of DNA barcoding technique in the identification of flowering and medicinal plants has been increasing in recent years (Amandita et al., 2019; Cahyaningsih et al., 2022). Tropical rainforests of Sumatra in Indonesia provide an abundance of vegetation and wildlife (Basyuni et al., 2019; Breidenbach et al., 2018; Rambey et al., 2021). With more than 300 indigenous species, Sumatra is reportedly one of the world's hubs for vascular plants (Barthlott, et al. 2005). The Sumatran forest, however, is currently experiencing significant forest degradation and deforestation (Lambert & Collar, 2002; Margono et al., 2012). Using two DNA chloroplast markers (matK and rbcL), a comprehensive study established DNA barcodes of flowering plant species in Sumatra (Amandita et al., 2019). This study found that the matK and rbcL markers can be used to identify the genus of flowering plant species in Sumatran forest (Amandita et al., 2019). In addition, Indonesia is also renowned for the variety of its medicinal plants and their traditional applications (Batubara & Prastya, 2020; Elfahmi, Woerdenbag, & Kayser, 2014). Various medicinal plants, in fresh or dried form, are commonly utilized to treat a wide variety of diseases (Elfahmi et al., 2014; Sholikhah, 2016). Therefore, in addition to improving the plant identification database, the DNA barcoding techniques has been well-employed to identify the biodiversity of medicinal plants in Indonesia. A group of researcher examined four distinct DNA barcoding regions—rbcL, ITS2, trnL, and matK—to identify 61 species of Indonesian medicinal plants, including two IUCN vulnerable (VU) species: the Aquilaria hirta and the Etlingera solaris (Cahyaningsih et al., 2022). Importantly, the results of this study also support the idea that DNA barcoding can be used to distinguish between pure extract of medicinal herbs compared to fake substitutes (Mishra et al., 2016). However, amidst the increasing trends of DNA barcoding, unlike in fishes, a specialized database for plants in Indonesia remains absent.
We discovered that DNA barcoding research is still a commonly used method for biological identification based on these findings. Fish is a keyword that is widely identified using DNA barcodes. These results support the previous finding for the abundance of fish DNA barcode sequences in the database. DNA barcodes should ideally meet the following requirements: (1) specificity – in the same species, the DNA fragment must be nearly identical, but different between species; (2) robustness – The marker should have conservative primer binding sites so that it can be amplified and sequenced from a wide number of different groups; (3) uniformity –The segment should be standardized (i.e., it should be used in all taxonomic categories) (Fišer Pečnikar and Buzan 2014). COI was observed to be employed in most all barcoding research in Indonesia, demonstrating that the COI area has been consistently crucial for the general use of DNA barcodes due to COI barcodes performing exceptionally well in most animal species (Ward et al., 2005).
DNA barcoding has the ability to reveal Indonesia's biodiversity. DNA barcoding research has a wide range of focus, such as evolutionary biologists. Understanding the origins of species and the mechanisms driving disparities in species richness in different biomes worldwide, particularly in Indonesia, is the main objective of evolutionary biologists and ecologists. In many cases, especially in the most biodiverse ecosystems, the whole richness of species in a given region is still unknown (Purvis and Hector 2000).
Looking ahead
The widespread adoption of DNA-based biodiversity assessments has opened up new opportunities in the inventory of earth's living organisms (Hubert and Hanner 2015). It has been demonstrated, in particular, through the use of DNA-based species inventories, that conventional methods to characterize biological diversity occur at a much slower rate than the rate of species extinction (Blaxter 2003). Monitoring biodiversity in Indonesia is essential as a part of mitigation strategies to tackle the impact of climate change. The contribution of DNA barcoding in biodiversity monitoring is pivotal in preventing the elevated rates of species extinction. This study found that the growing number of DNA barcoding research in Indonesia mainly focuses on species identification and revealing cryptic species identities. In addition to biodiversity monitoring, further applications of DNA barcoding in forensic science, disease management, food supply, and other fields should be highly encouraged and promoted in Indonesia.
A comprehensive and accurate public library, such as BoLD and Genbank, is essential to strengthen DNA barcoding as a taxonomical tool and promote biodiversity science development in Indonesia. Standardized protocols of DNA barcoding techniques have been established to prevent erroneous sequence data, mislabeling or misidentifications, ambiguous results due to cross-contamination, and other possible errors that might disrupt the downstream applications of DNA barcoding. Therefore, DNA barcoding initiatives in Indonesia require stringent quality control measures in the workflow of the research body itself and the data curation. If researchers in Indonesia are committed to providing well-curated sequence data, it will undeniably increase the confidence and trust of the academic community worldwide. Because the majority of current barcoding studies in Indonesia lack conceptual originality, Indonesian researchers should create comprehensive evolutionary and/or ecological programs integrating DNA barcoding. In general, Indonesian scientists did not propose the essential aspects and initiatives of DNA barcoding.
However, it is to be noted that limitations of DNA barcoding techniques in separating species or groups that have recently diverged also need to be carefully mitigated. Therefore, considering the high biodiversity index in Indonesia, the utilization of multiple markers and approaches is highly suggested. Furthermore, the possibility of universal primers that recognize non-specific sequences, leading to overestimation of species diversity and misidentifications, needs to be addressed as challenges in the application of DNA barcoding. Advanced innovations and de novo assigning algorithms for Next Generation Sequencing (NGS)-related DNA barcoding should be proposed by Indonesian researchers. In recent years, the concept of metabarcoding has widened considerably the potential scope of DNA barcoding applications (Taberlet et al., 2012).
Compared to traditional taxonomy, the DNA barcoding technique requires less expertise and has higher efficiency for the identification of novel species. However, the costs for generating barcode sequences vary depending on the location, the scale of the project, and the infrastructure. Most regions in Indonesia have limited access to the infrastructure required for DNA technology. Therefore, the establishment of barcoding hubs combining the resources of higher educational institutions and research centers might help in expanding the DNA barcoding initiatives in Indonesia. Indonesian researchers should start building a national DNA barcode reference library. Lastly, collaborative projects, data sharing, science initiatives for young researchers, and science-based policy design would promote DNA barcoding applications to help preserve Indonesia's biodiversity.
CONCLUSION
In Indonesia, the number of DNA barcode researchers is increasing, as is the focus of the research. Fishes have more records in the database, possibly as a result of researchers and the Indonesian government's support for the initiative to build a genetic library. In comparison to other mega biodiversity countries, Indonesia seems to be a little late in adopting the DNA barcoding technique. Because many species in Indonesia are unknown and undocumented, DNA barcode research enables researchers to understand more about the country's diverse biodiversity. These prospects and the promise of DNA barcodes require collaboration from a variety of parties, including the establishment of a national DNA barcode hub and library for Indonesian biodiversity. Furthermore, the transition from genetics to genomics needs to be the concern of Indonesian researchers in exploring biodiversity.
ACKNOWLEDGEMENTS
The authors are grateful to the editors and reviewers, whose comments have considerably improved the manuscript.
AUTHOR CONTRIBUTIONS
Dwi Sendi Priyono designed and conducted all of the publication data minning and wrote the manuscript. Fajar Sofyantoro, Wahyu Aristyaning Putri, Nur Indah Septriani, Annas Rabbani, Tuty Arisuryanti performed the statistical analysis and data visualization and wrote the manuscript. All authors have read and approved of the final manuscript.
CONFLICT OF INTEREST
The authors declare that they hold no competing interests.
REFERENCES
Aliabadian, M., Beentjes, K.K., Roselaar, H. van B., Nijman, V., and, Vonk, R. 2013. DNA barcoding of Dutch birds. Zookeys. 365: 25-48.
Amandita, F.Y., Rembold, K., Vornam, B., Rahayu, S., Siregar, I.Z., Kreft, H., and Finkeldey, R. 2019. DNA barcoding of flowering plants in Sumatra, Indonesia. Ecology and Evolution. 9: 1858–1868.
Anderson, A.M., Stur, E., and Ekrem, T. 2013. Molecular and morphological methods reveal cryptic diversity and three new species of Nearctic Micropsectra (Diptera: Chironomidae). Freshwater Science. 32: 892–921.
Arida, E., Ashari, H., Dahruddin, H., Fitriana, Y.S., Hamidy, A., Irham, M., Riyanto, A., Wiantoro, S., Zein, M.S.A., Hadiaty, R.K., et al. 2021. Exploring the vertebrate fauna of the Bird’s Head Peninsula (Indonesia, West Papua) through DNA barcodes. Molecular Ecology Resources. 21: 2369-2387.
Ashfaq, M., Akhtar, S., Rafi, M.A., Mansoor, S., and Hebert, P.D.N. 2017. Mapping global biodiversity connections with DNA barcodes: Lepidoptera of Pakistan. PLoS One. 12: e0174749.
Barthlott, W., Rafiqpoor, D., Kier, G., and Kreft, H. 2005. Global Centers of Vascular Plant Diversity. Nova Acta Leopoldina NF. 92: 61-83.
Basyuni, M., Slamet, B., Sulistiyono, N., Thoha, A.S., Bimantara, Y., and Widjaja, E.A. 2019. Species composition and plant diversity of logged-over forest in Sikundur, Gunung Leuser National Park, North Sumatra. IOP Conference Series: Earth and Environmental Science. 374:012051.
Batubara, I. and Prastya, M.E. 2020. Potential use of Indonesian medicinal plants for cosmetic and oral health: A review. Jurnal Kimia Valensi. 6: 120–134.
Blaxter, M. 2003. Counting angels with DNA. Nature. 421: 122–123.
Breidenbach, N., Rahayu, S., Siregar, I.Z., Siregar, U.J., Hamzah, and Finkeldey, R. 2018. Genetic diversity of dominant plant species in tropical land-use systems in Sumatra, Indonesia. Tropical Conservation Science. 11: 194008291881390.
Cahyaningsih, R., Compton, L.J., Rahayu, S., Magos Brehm, J., and Maxted, N. 2022. DNA barcoding medicinal plant species from Indonesia. Plants. 11: 1375.
Chan, A., Chiang, L-P., Hapuarachchi, H.C., Tan, C-H., Pang, S-C., Lee, R., Lee, K-S., Ng, L-C., and Lam-Phua, S-G. 2014. DNA barcoding: Complementing morphological identification of mosquito species in Singapore. Parasites & Vectors. 7: 1–12.
Coissac, E., Hollingsworth, P.M., Lavergne, S., and Taberlet, P. 2016. From barcodes to genomes: Extending the concept of DNA barcoding. Wiley Online Library.
Curran, L.M., Trigg, S.N., McDonald, A.K., Astiani, D., Hardiono, Y.M., Siregar, P., Caniago, I., and Kasischke, E. 2004. Lowland forest loss in protected areas of Indonesian Borneo. Science. 303: 1000–1003.
Dodsworth, S. 2015. Genome skimming for next-generation biodiversity analysis. Trends Plant Sci. 20: 525–527.
De Bruyn, M., Stelbrink, B., Morley, R.J., Hall, R., Carvalho, G.R., Cannon, C.H., van den Bergh, G., Meijaard, E., Metcalfe, I., and Boitani, L. 2014. Borneo and Indochina are major evolutionary hotspots for Southeast Asian biodiversity. Systematic Biology. 63: 879–901.
Dahruddin, H., Hutama, A., Busson, F., Sauri, S., Hanner, R., Keith, P., Hadiaty, R., and Hubert, N. 2017. Revisiting the ichthyodiversity of Java and Bali through DNA barcodes: Taxonomic coverage, identification accuracy, cryptic diversity and identification of exotic species. Molecular Ecology Resources. 17: 288–299.
Dubois, A. 2010. Zoological nomenclature in the century of extinctions: Priority vs. ‘usage.’ Organisms Diversity & Evolution. 10: 259–274.
Elfahmi, Woerdenbag, H.J., and Kayser, O. 2014. Jamu: Indonesian traditional herbal medicine towards rational phytopharmacological use. Journal of Herbal Medicine. 4: 51–73.
Elías-Gutiérrez, M. and León-Regagnon, V. 2013. DNA barcoding in Mexico: An introduction. Molecular Ecology Resources. 13: 1093–1096.
Fišer Pečnikar, Ž. and Buzan, E.V. 2014. 20 years since the introduction of DNA barcoding: From theory to application. Journal of Applied Genetics. 55: 43–52.
Garousi, V. and Mäntylä, M.V. 2016. Citations, research topics and active countries in software engineering: A bibliometrics study. Computer Science Review. 19: 56–77.
Gehanno, J-F., Rollin, L., and Darmoni, S. 2013. Is the coverage of Google Scholar enough to be used alone for systematic reviews. BMC Medical Informatics and Decision Making. 13: 1–5.
Goldstein, P.Z. and DeSalle, R. 2011. Integrating DNA barcode data and taxonomic practice: Determination, discovery, and description. Bioessays. 33: 135–147.
Harzing, A-W. 2010. The publish or perish book. Tarma Software Research Pty Limited Melbourne, Australia.
Hawlitschek, O., Morinière, J., Dunz, A., Franzen, M., Rödder, D., Glaw, F., and Haszprunar, G. 2016. Comprehensive DNA barcoding of the herpetofauna of Germany. Molecular Ecology Resources. 16(1): 242–253.
Hebert, P.D.N., Cywinska, A., Ball, S.L., and Jeremy, R. 2003. Biological identifications through DNA barcodes. Proceedings, Biological Sciences. 270: 313–321.
Hebert, P.D.N. and Gregory, T.R. 2005. The promise of DNA barcoding for taxonomy. Systematic Biology. 54: 852–859.
Hollingsworth, P.M., Graham, S.W., and Little, D.P. 2011. Choosing and using a plant DNA barcode. PLoS One. 6: e19254.
Hotaling, S., Kelley, J.L., and Frandsen, P.B. 2021. Toward a genome sequence for every animal: Where are we now? Proceedings of the National Academy of Sciences. 118: e2109019118.
Hubert, N., Hadiaty, R.K., Paradis, E., and Pouyaud, L. 2012. Cryptic diversity in Indo-Australian rainbowfishes revealed by DNA barcoding: Implications for conservation in a biodiversity hotspot candidate. PLoS One. 7: e40627.
Hubert, N. and Hanner, R. 2015. DNA barcoding, species delineation and taxonomy: A historical perspective. DNA Barcodes. 3: 44-58.
Hubert, N., Kadarusman, Wibowo, A., Busson, F., Caruso, D., Sulandari, S., Nafiqoh, N., Pouyaud, L., Rüber, L., Avarre J-C, et al., 2016. DNA Barcoding Indonesian freshwater fishes: challenges and prospects. DNA Barcodes. 3: 144–169.
Hubert, N., Wibowo, A., Busson, F., Caruso, D., Sulandari, S., Nafiqoh, N., Pouyaud, L., Rüber, L., Avarre, J-C., and Herder, F. 2015. DNA Barcoding Indonesian freshwater fishes: Challenges and prospects. DNA Barcodes. 3: 144–169.
Hutama, A., Dahruddin, H., Busson, F., Sauri, S., Keith, P., Hadiaty, R.K., Hanner, R., Suryobroto, B., and Hubert, N. 2017. Identifying spatially concordant evolutionary significant units across multiple species through DNA barcodes: Application to the conservation genetics of the freshwater fishes of Java and Bali. Global Ecology and Conservation. 12: 170–187.
Lambert, F.R. and Collar, N.J. 2002. The future for Sundaic lowland forest birds: long-term effects of commercial logging and fragmentation. Forktail. 12: 127–146.
Larsen, M.V., Cosentino, S., Lukjancenko, O., Saputra, D., Rasmussen, S., Hasman, H., Sicheritz-Pontén, T., Aarestrup, F.M., Ussery, D.W., and Lund, O. 2014. Benchmarking of methods for genomic taxonomy. Journal of Clinical Microbiology. 52: 1529–1539.
Leray, M., Knowlton, N., Ho, S.L., Nguyen, B.N., and Machida, R.J. 2019. GenBank is a reliable resource for 21st century biodiversity research. Proceedings of the National Academy of Sciences of the United States of America. 116: 22651–22656.
Li, J., Zheng, X., Cai, Y., Zhang, X., Yang, M., Yue, B., and Li, J. 2015. DNA barcoding of murinae (Rodentia: Muridae) and arvicolinae (Rodentia: Cricetidae) distributed in China. Molecular Ecology Resources. 15: 153–167.
Lohman, D.J., de Bruyn, M., Page, T., von Rintelen, K., Hall, R., Ng, P.K.L., Shih, H-T., Carvalho, G.R., and von Rintelen, T. 2011. Biogeography of the Indo-Australian Archipelago. Annual Review of Ecology, Evolution, and Systematics. 42: 205–226.
Mabragana, E., Díaz de Astarloa, J.M., Hanner, R., Zhang, J., and Gonzalez Castro, M. 2011. DNA barcoding identifies Argentine fishes from marine and brackish waters. PLoS One. 6: e28655.
Madduppa, H., Putri, Asp., Wicaksono, Rz., Subhan, B., Akbar, N., Ismail, F., Arafat, D., Prabuning, D., Muksin, Lmi., and Srimariana, Es. 2020. Morphometric and DNA Barcoding of endemic Halmaheran walking shark (Hemiscyllium halmahera, Allen, 2013) in North Maluku, Indonesia: Morphogenetic of endemic Halmaheran walking shark. Biodiversitas Journal of Biological Diversity. 21.
Margono, B.A., Turubanova, S., Zhuravleva, I., Potapov, P., Tyukavina, A., Baccini, A., Goetz, S., and Hansen, M.C. 2012. Mapping and monitoring deforestation and forest degradation in Sumatra (Indonesia) using Landsat time series data sets from 1990 to 2010. Environmental Research Letters. 7: 034010.
Mishra, P., Kumar, A., Nagireddy, A., Mani, D.N., Shukla, A.K., Tiwari, R., and Sundaresan, V. 2016. DNA barcoding: An efficient tool to overcome authentication challenges in the herbal market. Plant Biotechnology Journal. 14: 8–21.
Moura, M.R. and Jetz, W. 2021. Shortfalls and opportunities in terrestrial vertebrate species discovery. Nature Ecology and Evolution. 5: 631–639.
Muchlisin, Z.A., Fadli, N., and Siti-Azizah, M.N. 2012. Genetic variation and taxonomy of Rasbora group (Cyprinidae) from Lake Laut Tawar, Indonesia. Journal of Ichthyology. 52: 284–290.
Murray, G.G.R., Wang, F., Harrison, E.M., Paterson, G.K., Mather, A.E., Harris, S.R., Holmes, M.A., Rambaut, A., and Welch, J.J. 2016. The effect of genetic structure on molecular dating and tests for temporal signal. Methods in Ecology and Evolution. 7: 80–89.
Myers, N., Mittermeier, R.A., Mittermeier, C.G., da Fonseca, G.A.B., and Kent. J. 2000. Biodiversity hotspots for conservation priorities. Nature. 403: 853.
Pante, E., Schoelinck, C., and Puillandre, N. 2015. From integrative taxonomy to species description: One step beyond. Systematic Biology. 64(1): 152–160.
Powell, T.H., Kouropalatis, Y., Morgan, R.E., and Karhu, P. 2016. Mapping knowledge and innovation research themes: Using bibliometrics for classification, evolution, proliferation and determinism. International Journal of Entrepreneurship and Innovation Management. 20: 174–199.
Priyono, D.S., Solihin, D.D., Farajallah, A., Irawati, D., and Arini, D.W.I. 2018. Anoa, dwarf buffalo from Sulawesi, Indonesia : Identification based on DNA barcode. 19: 1985–1992.
Priyono, D.S., Solihin, D.D., Farajallah, A., and Purwantara, B. 2020. The first complete mitochondrial genome sequence of the endangered mountain anoa (Bubalus quarlesi) and phylogenetic analysis. Journal of Asia-Pacific Biodiversity. 13: 123-133.
Purvis, A. and Hector, A. 2000. Getting the measure of biodiversity. Nature. 405: 212–219.
Rambey, R., Susilowati, A., Rangkuti, A.B., Onrizal, O., Desrita, D., Ardi, R., and Hartanto, A. 2021. Plant diversity, structure and composition of vegetation around Barumun Watershed, North Sumatra, Indonesia. Biodiversitas Journal of Biological Diversity. 22: 28.
Sholikhah, E.N. 2016. Indonesian medicinal plants as sources of secondary metabolites for pharmaceutical industry. Journal of the Medical Sciences. 48: 226–239.
Sofyantoro, F., Yudha, D.S., Lischer, K., Nuringtyas, T.R., Putri, W.A., Kusuma, W.A., Purwestri, Y.A., and Swasono, R.T. 2022. Bibliometric analysis of literature in snake venom-related research worldwide (1933–2022). Animals. 12: 2058.
Stork, H. and Astrin, J.J. 2014. Trends in biodiversity research—a bibliometric assessment. Open Journal of Ecology. 4: 354-370.
Straub, S.C.K., Parks, M., Weitemier, K., Fishbein, M., Cronn, R.C., and Liston, A. 2012. Navigating the tip of the genomic iceberg: Next‐generation sequencing for plant systematics. American Journal of Botany. 99: 349–364.
Takahashi, A., Kumagai, T., Kanamori, H., Fujinami, H., Hiyama, T., and Hara, M. 2017. Impact of tropical deforestation and forest degradation on precipitation over Borneo Island. Journal Hydrometeorology. 18: 2907–2922.
Tan, Y.-L., Yiew, T.-H., Habibullah, M.S., Chen, J.-E., Mat Kamal, S.N.-I., and Saud, N.A. 2022. Research trends in biodiversity loss: A bibliometric analysis. Environmental Science and Pollution Research. 1–17.
Van Eck, N. and Waltman, L. 2010. Software survey: VOSviewer, a computer program for bibliometric mapping. Scientometrics. 84: 523–538.
von Rintelen, K., Arida, E., and Häuser, C. 2017. A review of biodiversity-related issues and challenges in megadiverse Indonesia and other Southeast Asian countries. Research Ideas and Outcomes. 3: e20860.
Verstegen, J.A., van der Laan, C., Dekker, S.C., Faaij, A.P.C., and Santos, M.J. 2019. Recent and projected impacts of land use and land cover changes on carbon stocks and biodiversity in East Kalimantan, Indonesia. Ecological Indicators. 103: 563–575.
Spasojevic, T., Kropf, C., Nentwig, W., and Lasut, L. 2016. Combining morphology, DNA sequences, and morphometrics: Revising closely related species in the orb-weaving spider genus Araniella (Araneae, Araneidae). Zootaxa. 4111: 448–470.
Taberlet, P., Coissac, E., Pompanon, F., Brochmann, C., and Willerslev, E. 2012. Towards next‐generation biodiversity assessment using DNA metabarcoding. Molecular Ecology. 21: 2045–2050.
Takahashi, A., Kumagai, T., Kanamori, H., Fujinami, H., Hiyama, T., and Hara, M. 2017. Impact of tropical deforestation and forest degradation on precipitation over Borneo Island. Journal of Hydrometeorology. 18: 2907–2922.
Team. Rs. 2021. RStudio: integrated development for R. RStudio, PBC, Boston, MA. 2020.
van Velzen, R., Weitschek, E., Felici, G., and Bakker, F.T. 2012. DNA barcoding of recently diverged species: relative performance of matching methods. PLoS One. 7: e30490.
Verstegen, J.A., van der Laan, C., Dekker, S.C., Faaij, A.P.C., and Santos, M.J. 2019. Recent and projected impacts of land use and land cover changes on carbon stocks and biodiversity in East Kalimantan, Indonesia. Ecological Indicators. 103: 563–575.
Ward, R.D., Zemlak, T.S., Innes, B.H., Last, P.R., Hebert, P.D.N. 2005. DNA barcoding Australia’ s fish species. September: 1847–1857.
Wickham, H., Chang, W., Wickham, M.H. 2016. Package ‘ggplot2.’ Creat elegant data Vis using Gramm Graph Version. 2: 1–189.
Yu, S., Cui, B., Xie, C., Man, Y., and Fu, J. 2022. Bibliometric review of biodiversity offsetting during 1992–2019. Chinese Geographical Science. 32: 189–203.
Zein, M.S.A. and Prawiradilaga, D.M. 2013. DNA barcode fauna indonesia. Prenada Media.
OPEN access freely available online
Natural and Life Sciences Communications
Chiang Mai University, Thailand.
Dwi Sendi Priyono1, 2, 3, Fajar Sofyantoro1, 2, Wahyu Aristyaning Putri1, Nur Indah Septriani1, Annas Rabbani1, and Tuty Arisuryanti1, *
1 Department of Tropical Biology, Faculty of Biology, Universitas Gadjah Mada, Jl. Teknika Selatan, Sinduadi. Mlati, Sleman, 55281, Special Region of Yogyakarta, Indonesia
2 Center for Tropical Biodiversity, Faculty of Biology, Universitas Gadjah Mada, Jl. Teknika Selatan, Sinduadi. Mlati, Sleman, 55281, Special Region of Yogyakarta, Indonesia
3 Wildlife Conservation Society – Indonesia Program, Jl. Malabar 1 No.11, Bogor, 16128, West Java, Indonesia.
Corresponding author: Tuty Arisuryanti, E-mail: tuty-arisuryanti@ugm.ac.id
Total Article Views
Editor: Pachara Sattayawat,
Chiang Mai University, Thailand
Article history:
Received: August 26, 2022;
Revised: October 13, 2022;
Accepted: October 21, 2022;
Published online: November 1, 2022