 ISSN: 2822-0838 Online

The Decrease in Spectrum Intensity of ESBL Spectra after Exposure to Clavulanic Acid in Nosocomial Urinary Tract Infected Escherichia coli Analysed by VITEK® MS
Pratchaya Wisutthithada, Thanathida Sirilueangtrakul, Ponkit Suwannapong, Rutjapong Nongmak, Phadungkiat Khamnoi, Thanapat Sastraruji, and Siriwoot Sookkhee*Published Date : 2022-10-18
DOI : https://doi.org/10.12982/CMUJNS.2022.061
Journal Issues : Number 4, October-December 2022
Abstract The present study aimed to investigate the influence of clavulanic acid on the spectrum intensity of Extended Spectrum β- Lactamase (ESBL) indicative spectra in the nosocomial urinary tract infected Escherichia coli. Two hundred nosocomial urinary tract infected E. coli isolates collected between 2017-2019 were recruited. Their antibiotic susceptibilities and ESBL productions were then determined. The effect of clavulanic acid contained in amoxicillin-clavulanic acid towards the change of spectra intensity after being exposed was also determined to identify their ESBL indicative spectra. Results revealed that these nosocomial isolates exhibited a low percent resistance after being tested to piperacillin-tazobactam, meropenem, doripenem, and gentamicin. VITEK® MS analysis demonstrated five E. coli species-specific spectra including 4363, 5097, 5381, 6255, and 9065 Dalton. After exposure to ceftazidime alone, and co-exposure to ceftazidime and amoxicillin-clavulanic acid, six ceftazidime-susceptible, and five ceftazidime-stress spectra, 5381, 6412, 7870, 8876,10139 and 10301 Dalton and 3578, 6226, 6316, 7274, and 8370 Dalton were significantly detected, respectively. Whereas two ceftazidime-resistant spectra, 4613 and 9715 Dalton, exhibited a significantly decreased intensity after determined in the high ESBL producing group after co-exposure to ceftazidime and clavulanic acid, respectively. In conclusion, an ESBL inhibitor or clavulanic acid could significantly decrease the spectrum intensity of two spectra 4613 and 9715 Dalton after being co-exposed to ceftazidime and clavulanic acid and these spectra were suspected as ESBL indicative spectra in the high ESBL producing nosocomial E. coli isolates.
Keywords: Extended spectrum β- Lactamase indicative spectra, clavulanic acid exposure, nosocomial urinary tract infection, Escherichia coli, VITEK® MS
Funding: The authors are thankful for the research funding provided by the Faculty of Medicine, Chiang Mai University, Chiang Mai, Thailand.
Citation: Wisutthithada, P., Sirilueangtrakul, T., Suwannapong, P., Nongmak, R., Khamnoi, P., Sastraruji, T., and Sookkhee, S. 2022. The decrease in spectrum intensity of esbl spectra after exposure to clavulanic acid in nosocomial urinary tract infected Escherichia coli analysed by VITEK® MS. CMUJ. Nat. Sci. 21(4): e2022061.
INTRODUCTION
Urinary tract infection (UTI) is one of the most prevalent bacterial infections worldwide commonly caused by Escherichia coli (Flores-Mireles et al., 2015; Marrs et al., 2005; Matsukawa et al., 2019). The disease affects many aspects of patient’s life, especially well-being, needing earlier and more accurate diagnosis and treatment. Prolonged use of antibiotics and inappropriate drug prescriptions are the main causes of antibiotic-resistance outbreaks. Escherichia coli is the most common community acquired, multidrug resistance causative agent of UTI (Singhavejsakul et al., 2022). Extended Spectrum β-Lactamase (ESBL) is mainly caused for their antibiotic resistance of UTI. β-lactam resistance has primarily been found as antibiotic resistance in UTIs and can cause complicated UTI and bloodstream infections. The rapid identification of causative agent and its resistance proteins are important for therapeutic decision.
β-lactamase can inactivate β-lactam drugs by making them unable to bind to their target site (Seenama et al., 2019). Extended-Spectrum β-Lactamase (ESBL) is the most common subtype of β- lactamase which can hydrolyze the oxyimino-side chain of the β-lactam group. However, the ESBL enzyme can be inhibited by a β-lactamase inhibitor such as clavulanic acid. The incidence of ESBL-producing E. coli is increasing globally. According to a study in Canada, the incidence increased from 3.7% in 2007 to 11.1% in 2016 (Denisuik et al., 2019). Similarly, a study in Thailand showed increasing incidence from 19-22% in 2008-2010 to 30% in 2011-2014 (Sawatwong et al., 2019). Antibiotics used without medical prescription and not following antimicrobial prescribing guidance plays a significant role in increasing antibiotic resistance (Apisarnthanarak et al., 2007).
Currently, the proteomic analysis applying Matrix-Assisted Laser Desorption/ Ionization Time of Flight Mass spectrometry (MALDI-TOF-MS) is performed as the more efficient routine diagnostic method in hospital for identifying species and drug sensitivity because of less processing time than the conventional method. However, other molecular techniques have high sensitivity and specificity, but these techniques consume time for diagnosis and require the specific primers for each pathogen. Myla® database has been performed to analyze the demonstrated spectra to identify the species and drug resistance effectively. In the present study, we aimed to investigate the E. coli specific spectra. Furthermore, we aimed to identify the decreased intensity affected from clavulanic acid of ESBL indicative spectra in the nosocomial infected urine isolates of E. coli which were collected in 2017-2019 after co-exposure to ceftazidime (CAZ) and amoxicillin-clavulanic acid (AMC). Results of this study may help the technician to report the drug susceptibility for the clinician’s decision of antibiotic appropriate use.
MATERIALS AND METHODS
Bacterial population
The resistant E. coli isolates from urine specimen of patients who admitted in Maharaj Nakorn Chiang Mai Hospital and presented with nosocomial infection after admission were provided by the Diagnostic Laboratory Unit, Maharaj Nakorn Chiang Mai Hospital, Faculty of Medicine, Chiang Mai University in 2017-2019. Two hundred selected isolates were stored at the Department of Microbiology, Faculty of Medicine as the frozen vials were at -80°C until used. These isolates were molten and cultured in Tryptic soy broth (TSB) at 37°C for 18-24 hours. Afterward, the bacteria grown in TSB were streaked on MacConkey’s agar and then incubated at 37°C for 18-24 hours. The pink colonies were picked to identify as E. coli by using Triple Sugar Iron (TSI) slant, motility, catalase test, indole production, methyl red test, Voges-Proskauer, urease test and utilization of citrate. E. coli ATCC 25922 was carried out as the reference strain in the present study. This present study was approved for biosafety by the Institutional Biosafety Committee of the Faculty of Medicine, Chiang Mai University. Thailand.
Antibiotic susceptibility tests
Agar disk diffusion
According to the CLSI guidelines, agar disk diffusion was performed to determine antibiotic susceptibility (National Committee for Clinical Laboratory Standards, 2018). Firstly, a colony of each isolate was dispersed into Mueller Hinton Broth (MHB) with the turbidity adjusted to McFarland No. 0.5, and then was swabbed on Muller-Hinton agar (MHA). Secondly, each disk of amoxicillin-clavulanic acid (AMC, 30/10 µg/ml), ampicillin (AMP, 30 µg/ml), imipenem (IPM, 30 µg/ml), cefoxitin (FOX, 30 µg/ml), ceftazidime (CAZ, 30 µg/ml, piperacillin/tazobactam (PTZ, 30/10 µg/ml), ciprofloxacin (CIP, 30 µg/ml), tetracycline (TE, 30 µg/ml), and cefotaxime (CTX, 30/10 µg/ml) was placed by an antibiotic dispenser. The plate was incubated at 37°C for 18-24 hours.
After incubation, clear zones were measured in millimeter units and compared to CLSI drug susceptibility (Kaur et al., 2013). Afterward, these isolates were divided into susceptible and resistant groups. The isolate that resisted more than three antibiotics was considered as a resistant group. E. coli ATCC 25922 was carried out as the reference strain in the present study.
Double disk synergy test
According to the CLSI guidelines, a double disk synergy test was performed to determine ESBL production (Kaur et al., 2013). Firstly, a colony of each isolate was dispersed into MHB with the turbidity adjusted to McFarland No. 0.5, and then was swabbed on Muller-Hinton agar (MHA). Secondly, a disk of CAZ was placed on the plate 20 millimeters apart from the AMC disk. The plate was incubated at 37°C for 18-24 hours. After incubation, the isolate that showed the diameter of clear zone shorter than 27 millimeters around the CAZ disk was considered as ESBL production. The keyhole phenomenon was also carried out to indicate ESBL production by observing the susceptible area between CAZ and AMC. E. coli ATCC 25922 was carried out as the reference strain in the present study.
ESBL Determination using e-strip test
After the isolates were confirmed for ESBL production, the ESBL-producing group was divided into high ESBL production and low ESBL production group using the E-strip test. Firstly, a colony of each isolate was dispersed into the suspension and then was swabbed on Muller-Hinton agar (MHA). An E-strip which contained CAZ on one end and ceftazidime plus clavulanic acid (CAZplusClav) on the opposite end, was placed in the middle of MHA. Then, the plate was incubated at 37°C for 18-24 hours. The isolates with MIC of CAZ per MIC of CAZplusClav (MICCAZ/MICCAZplusClav) > 250 folds, in a range of 8-250 fold, and < 8 fold were considered as a resistant strain with high, low, and non- ESBL production, respectively (Lananta et al., 2021).
VITEK® MS analysis of peptide spectra
A single colony of each isolate was separately smeared on each well of VITEK® MS-DS target slide (bioMérieux™, Marcy l' Etoile, France) using a 1-μL disposable inoculating loop (Nunc™, Roskilde, Denmark). A smear in each well recieved 1 μL of α-cyano-4-hydroxycinnamic acid (CHCA) matrix solution (bioMérieux™, Marcy l' Etoile, France) and air-dried at room temperature. After that, the VITEK® MS-DS target slide was placed into VITEK® MS Axima Assurance mass spectrometer (bioMérieux™, Marcy l' Etoile, France) at a laser frequency of 50 Hz with an acceleration voltage of 20 kV and an extraction delay time of 200 ns under the operation of the Acquisition Station software (VITEK® MS version 1.0.0) (Lee et al., 2015). For each spectrum, 500 shots in 5-shot steps from different positions of the target spot were collected. The obtained peptide mass spectra ranged from 2,000 to 20,000 Da of each sample were analyzed with the in vitro diagnostic (IVD) 1.1 database and MYLA® database algorithm. The species-specific peptide spectra were also determined from these isolates with 70% of obtained frequency. E. coli ATCC 8739 was used as the positive control for internal calibration. To prepare the sample for proteomic spectra analysis, double disk synergy was done for every colony of each isolate according to the description above. From Figure 1, the colonies which exposure to CAZ (point 1), and co-exposure to CAZ and AMC (point 2) from each isolate were collected and smeared on the VITEK® MS-DS target slide. Afterward, the VITEK® MS-DS target slide was placed into VITEK® MS Axima Assurance mass spectrometer, the mass spectrometry spectrum was generated from each spot. The obtained data from VITEK® MS are expressed in a form of protein molecular weight and protein intensity, and then rearranged by WebPlotDigitizer v4.4. Low, high and non-ESBL producers and susceptible isolates were classified according to their MICCAZ/MICCAZplusClav as described in E-strip testing. The intensity of spectra of tested producers was analyzed using the IBM SPSS program for determining their significant difference (P-value) of the intensity of these spectra after exposure to CAZ alone, and co-exposure to CAZ and AMC (Lananta et al., 2021). The significant difference at
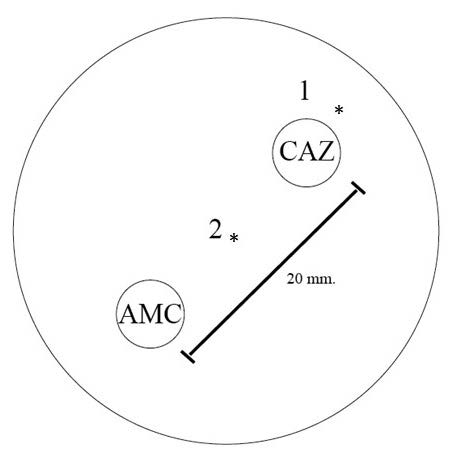
Figure 1. Double disk synergistic test showed CAZ and AMC disk positions, and the collected points. Point 1 represents the colonies after exposure to CAZ alone. Point 2 represents the colonies after co-exposure to CAZ and AMC.
RESULTS
Antibiotic susceptibility tests
Among urine bacteria kindly provided from Diagnostic Laboratory Unit, Maharaj Nakorn Chiang Mai Hospital, Faculty of Medicine, Chiang Mai University, Thailand, in 2017-2019, a total of 200 bacterial isolates were identified as E. coli by using the biochemically conventional methods and confirmed by using the proteomic analysis via VITEK® MS identification techniques. All tested E. coli isolates exhibited their antimicrobial susceptibility patterns towards 13 antibiotics as shown in Figure 2. The antimicrobial susceptibility results revealed that all the isolates were resistant to AMP. After being compared with AMC susceptibility, the % resistance of total E. coli isolates had significantly declined to 47%. Considering the resistance between subgroups, the resistant rates of the low ESBL producing group (13.6%) were dramatically decreased compared to the resistant rates of the high ESBL subgroup (84.7%) as seen in Figure 2. All of the isolates were susceptible to PTZ, suggesting that the combination of β-lactam with β-lactamase inhibitors could significantly improve the efficacy of the drug to eradicate the pathogens due to the action of β- lactamase inhibitors.
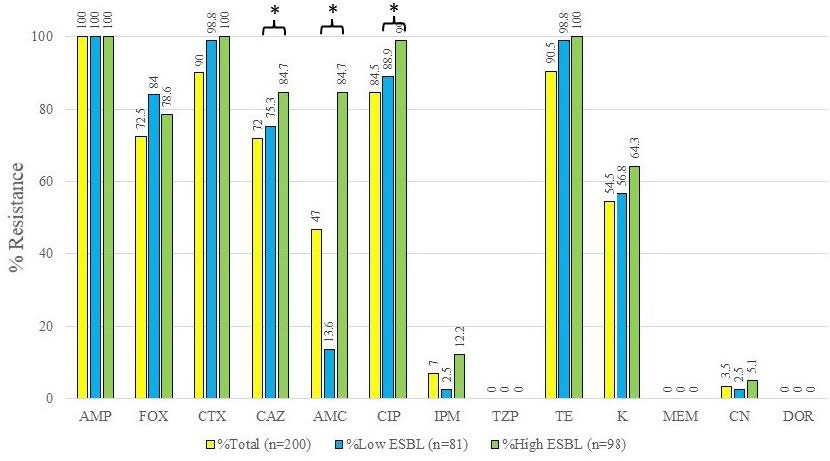
Figure 2. Antimicrobial susceptibility of 200 tested E. coli isolates toward 13 antibiotics. AMP, Ampicillin; FOX, Cefoxitin; CTX, Cefotaxime; CAZ, Ceftazidime; AMC, Amoxicillin-clavulanic acid; CIP, Ciprofloxacin; IPM, Imipenem; PTZ, Piperacillin-tazobactam; TE, Tetracycline; K, Kanamycin; MEM, Meropenem; CN, Gentamicin; DOR, Doripenem. *The significant difference of antibiotic resistance compared between the low- and high-ESBL producing groups at P < 0.05.
The antimicrobial susceptibility of three cephalosporins, including FOX, CAZ, and CTX, were demonstrated for confirming the enzyme responsible for cephalosporinase or ESBL action. Percent resistances toward FOX of all isolates, low, and high ESBL producers were 72.5, 84.0, and 78.6%, respectively. However, these percent resistances were not like the two other cephalosporins, CTX and CAZ. The percent resistance of all isolates, low, and high ESBL producing groups were 90.0, 98.8, 100% after being tested to CTX. The percent resistances of all isolates, low and high ESBL producing group were 72.0, 75.3, and 84.7% after testing to CAZ. Results revealed that high percent resistance was caused by the action of the ESBL enzyme.
Apart from ESBL substrates as described above, a non-ESBL substrate in the carbapenems family, IPM showed the resistance at 7.0, 2.5, and 12.2% after being tested in the groups of all isolates, low, and high ESBL producers. Nevertheless, all isolates were susceptible after being tested in both MEM and DOR. It may be implied that these ESBL isolates were still affected by carbapenems. However, it may be suggested that some other mechanisms caused the IPM resistance of some isolates.
Results revealed that other non-β-lactams also demonstrated different levels of resistance classified as high, moderate, and low percent resistance against all isolates. CIP exhibited high percent resistances of all isolates, low, and high ESBL producers at 84.5, 88.9, and 99.0%. TE also exhibited high percent resistances of all isolates, low, and high ESBL- producers at 90.5, 98.8 and 100%, respectively. KA and CN exhibited moderate, and low percent resistances of all isolates, low, and high ESBL producers were 54.5, 56.8, 64.3%, and 3.5, 2.5, and 5.1%, respectively.
VITEK® MS analysis of peptide spectra
Among 323 peptide spectra of all isolates demonstrated a range of 487 to 13005 Da, with their distribution as shown in Figure 3. The results from Figure 3 demonstrated the detected frequencies of each spectrum. It was found that 263, 28, 22, 5, and 5 peptide spectra exhibited the detected frequencies detected in the lowest (0-10%), low (10-30%), moderate (30-50%), high (50-70%), and the highest (70-100%) levels, respectively. Five spectra in the highest level were assumed to be the E. coli species-specific spectra and are shown in Table 1.
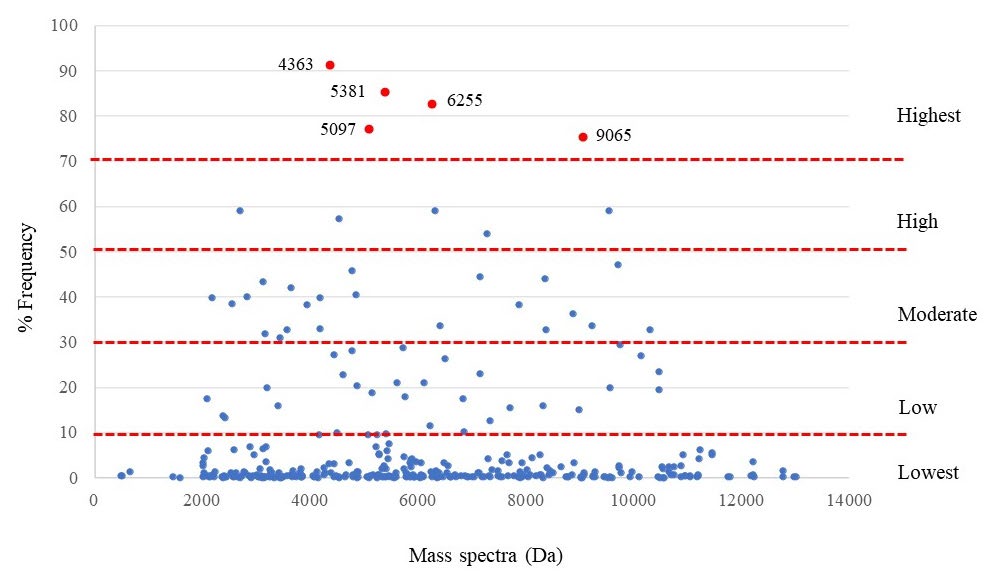
Figure 3. E. coli-specific spectra (red spot) are classified from the detected frequency of each spectrum.
Table 1. E. coli-specific spectra detected in each tested ESBL producing group.
|
Protein spectra (Da) |
Detected frequency (%) of spectra in each tested group |
|
|||
|
Low ESBL |
High ESBL |
Non-ESBL |
All isolates |
||
|
4363 |
89.86 |
89.86 |
94.74 |
91.25 |
|
|
5097 |
74.64 |
79.05 |
78.07 |
77.25 |
|
|
5381 |
82.61 |
83.78 |
90.35 |
85.25 |
|
|
6255 |
82.60 |
80.41 |
85.96 |
82.75 |
|
|
9065 |
79.71 |
72.30 |
74.56 |
75.25 |
|
Table 2 shows the percentage of detected frequency among low, high, and non-ESBL producing E. coli isolated in each year. It was found that the spectrum at 4363 Da was the most common in all groups of each year. It may be suggested that this spectrum was responsible for the conserved protein for E. coli. The other four spectra which are located at 5097, 5381, 6255, and 9065 Da were also detected in the high percent frequency level with a decrease of frequency in some year of each ESBL producing group.
Table 2. E. coli-specific spectra detected the frequency of ESBL producing groups in each year.
|
Protein spectra (Da) |
Spectra detected frequency (%) |
Total (n=400) |
||||||||
|
2017 |
2018 |
2019 |
||||||||
|
Low (n=46) |
High (n=46) |
Non (n=44) |
Low (n=24) |
High (n=30) |
Non (n=24) |
Low (n=68) |
High (n=72) |
Non (n=46) |
||
|
4363 |
93.65 (44) |
97.82 (45) |
97.73 (43) |
95.83 (23) |
96.67 (29) |
100.00 (24) |
83.83 (57) |
81.94 (59) |
89.13 (41) |
91.25 (365) |
|
5097 |
73.91 (34) |
84.78 (39) |
56.82 (25) |
83.33 (20) |
83.33 (25) |
87.50 (21) |
72.06 (49) |
73.61 (53) |
93.48 (43) |
77.25 (309) |
|
5381 |
91.30 (42) |
100.00 (46) |
95.45 (42) |
91.67 (22) |
96.67 (29) |
95.83 (23) |
73.53 (50) |
68.06* (49) |
82.61 (38) |
85.25 (341) |
|
6255 |
93.65 (44) |
97.82 (45) |
95.45 (42) |
95.83 (23) |
93.33 (28) |
91.67 (22) |
69.12* (47) |
63.89* (46) |
73.91 (34) |
82.75 (331) |
|
9065 |
63.04 (29) |
52.17* (24) |
63.64 (28) |
87.50 (21) |
90.00 (27) |
75.00 (18) |
86.96 (60) |
77.78 (56) |
82.61 (38) |
75.25 (301) |
Note: *Spectra detected frequency was less than 70%. n, the number of determined samples. Each isolate consisted of 2 samples including CAZ exposure alone, and CAZ and AMC co-exposure
Apart from E. coli-specific spectra, the P-values of the significant difference between the spectrum intensity after exposure to CAZ alone, and co-exposure to CAZ and AMC were shown in Table 3. Fifteen spectra exhibited significant differences. Due to the inability of ESBL production, six spectra including 5381, 6412, 7870, 8876, 10139, and 10301 Da showed a significant difference in the non-ESBL producing group. They may be called the susceptible spectra although some spectra were also significantly detected in low or high ESBL producing groups. The significant difference between the two spectra which were located at 3578 and 6226 Da only in the low ESBL producing group after co-exposure to CAZ and AMC were also detected. Four significant spectra located at 4613, 7274, 8370, and 9715 Da demonstrated significant differences only in the high ESBL producing group. Lastly, only one significant spectrum, 6316 Da was detected both in low and high ESBL producing groups.
In comparison between the exposure to CAZ towards the co-exposure to CAZ and AMC, the increasing intensity was demonstrated in three spectra located at 3578, 6226, and 6316 Da. These spectra exhibited a significant increase in the low ESBL producing group at P-value < 0.001, 0.001, and 0.001, respectively (Figure 4a). Whereas four spectra included 6316, 7274, 8370, and 10476 Da also demonstrated the significant increase in the high ESBL producing group at P-value 0.001, 0.001, 0.002, and 0.008, respectively (Figure 4b). The results showed that they were not ESBL spectra and were responsible for AMC resistance or stress condition.
On the other hand, the significant reduction in the low ESBL producing group was only detected at a spectrum 7153 Da (P-value = 0.01) (Figure 4a). Two spectra located at 4613, and 9715 Da demonstrated a significant reduction after co-exposure to CAZ and AMC in the high ESBL producing group at P-value 0.008 and <0.001, respectively (Figure 4b). The reduction of these spectra, 4613, 7153, and 9715 Da were suspected as ESBL indicative spectra of the nosocomial isolates of E. coli which were affected by clavulanic acid.
Figure 5 shows the comparison of spectrum intensity between ESBL indicative spectra at 4613 and 9715 Da of a high ESBL-producing isolate after exposure to CAZ alone (Figure 5a), and co-exposure to CAZ and AMC (Figure 5b).
Table 3. Comparison of the significant difference of spectra intensity after exposure to CAZ alone, and co-exposure of CAZ and AMC in each tested ESBL producing group. Data were shown as P-values.
|
Significant spectra (Da) |
P-values of the difference in each ESBL group |
||||
|
Low |
High |
Non |
|||
|
Non-ESBL group |
|
|
|
||
|
5381 |
0.322 |
0.024
|
0.006* |
||
|
6412 |
0.007* |
0.006* |
0.001** |
||
|
7870 |
0.002* |
0.263 |
<0.001** |
||
|
8876 |
<0.001** |
0.002* |
<0.001** |
||
|
10139 |
0.096 |
0.145 |
0.002* |
||
|
10301 |
0.389 |
0.009* |
0.004* |
||
|
Low ESBL group |
|
|
|
||
|
3578 |
0.001** |
0.111 |
0.043 |
||
|
6226 |
<0.001** |
ND |
ND |
||
|
Low and high ESBL group |
|
|
|
||
|
6316 |
0.002** |
0.001** |
0.029 |
||
|
High ESBL group |
|
|
|
||
|
4613 |
0.550 |
0.008* |
0.257 |
||
|
7274 |
0.328 |
0.001** |
0.019 |
||
|
8370 |
0.754 |
0.002* |
0.024 |
||
|
9715 |
0.290 |
<0.001** |
0.620 |
||
Note: *, P-value ≤ 0.01 ; **, P-value ≤ 0.001; ND, Not Done
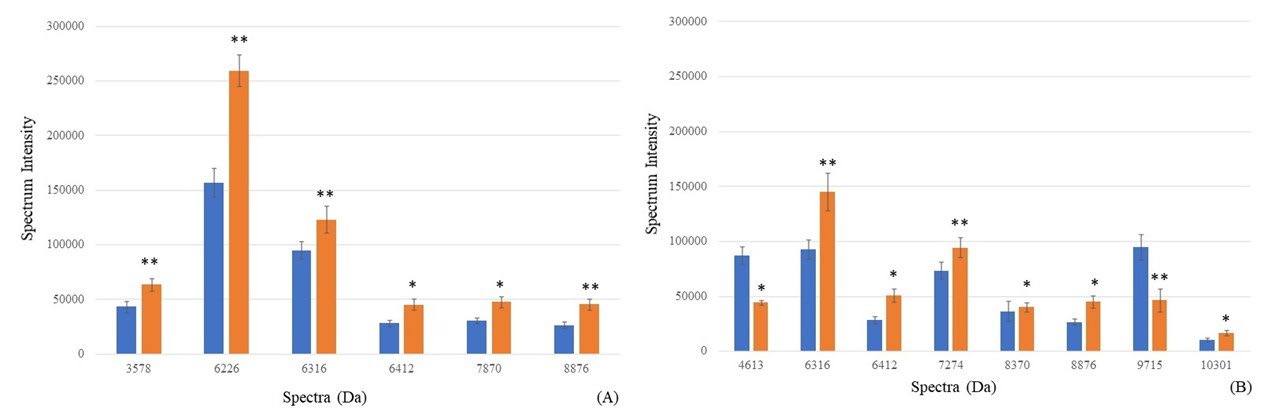
Figure 4. Spectrum intensity (mean ± SE) of each spectrum after exposure to CAZ (blue bar), and co-exposure to CAZ and AMC (orange bar). *Significant increase of intensity (P-value ≤0.01); **Significant decrease of intensity (P-value ≤0.001).
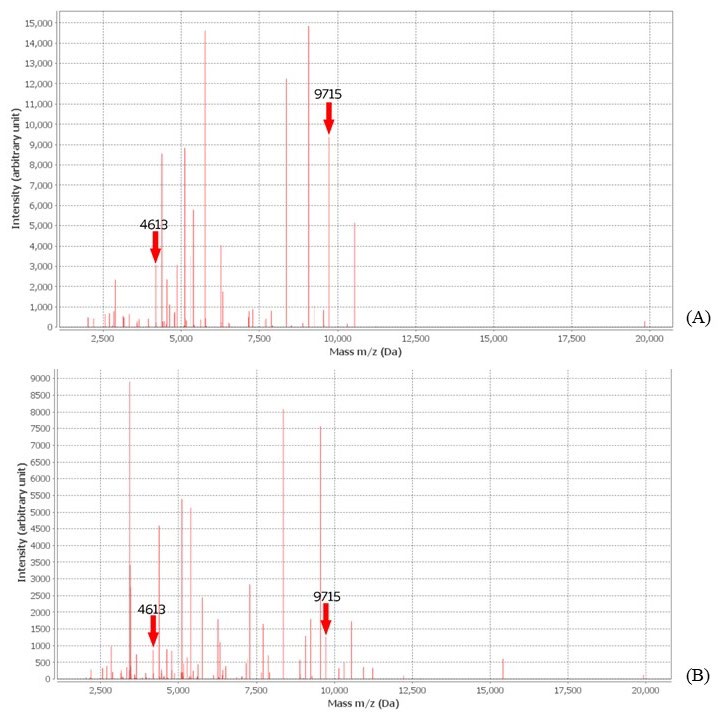
Figure 5. Significant decrease of ESBL indicative spectra intensity in high ESBL producing isolates after exposure to CAZ (A), and co-exposure to CAZ and AMC (B)
DISCUSSION
Although VITEK MS was carried out to identify E. coli and Shigella sp., it may provide some close peptide spectra and may result in poor discrimination (Martiny et al., 2012). Other biochemically conventional identification methods could be efficient for confirming E. coli identification (Khot et al., 2013; Richter et al., 2013) including Triple Sugar Iron (TSI) slant, motility, catalase test, indole production, methyl red test, Voges-Proskauer, urease test and citrate utilization. According to their antibiotic susceptibilities, the percentage of resistance in all isolates after being tested with AMC declined compared to AMP. Clavulanic acid contained in AMC could inhibit the degradation effect of β-lactamase, resulting in higher efficacy as shown in the reduction of its MIC. However, the resistance rates of low and high ESBL producing groups after being tested with AMC were similar to AMP. PTZ demonstrated a low percent of resistance in these tested groups, suggesting that tazobactam could help to inhibit β-lactamase. The differences of percent resistance after testing with to cephalosporins, including FOX, CTX, and CAZ, were also exhibited. It could be assumed that they may cause different ESBL specific activity towards each substrate. Due to oxyimino side chains contained in CTX and CAZ, but not in FOX, effects to antibiotic susceptibility was shown in the differences of percents of resistance in ESBL producing groups (Kumar et al., 2014). Apart from ESBL substrates and inhibitors, carbapenems and aminoglycoside, are still effective against ESBL producing E. coli. However, they may develop some mechanisms possible to eradicate the quinolone and tetracycline effects, for example, drug efflux pump (Thorrold et al., 2007). Hence, PTZ, carbapenem and aminoglycoside were also appropriate drugs for the treatment of nosocomial urinary tract infected E. coli.
Considering the significant spectra found in Table 3, the susceptible spectra could be detected after exposure to CAZ and AMC in the non-ESBL producing group. They may play a role as the responsive peptides that were exposed to the environmental stress, and antibiotics increasing their intensity (Nakamura et al., 2019). These susceptible peptides which showed significant differences in the non-ESBL group including 5381, 6412, 7870, 8876, 10139, and 10301 Da were excluded from the further study. Figure 4 shows significant differences between the spectra intensity after exposure to CAZ alone and co-exposure to CAZ and AMC. Nine significant spectra, 3578, 4613, 6226, 6316, 7153, 7274, 8370, 9715, and 10476 Da were considered as two types. The stress spectra detected the increased intensity after co-exposure to CAZ and AMC in the low or high ESBL producing groups. These stress spectra were produced by ESBL E. coli in response to environmental stress and antibiotics (Poole, 2012). On the other hand, the ESBL indicative spectra declined after co-exposure to CAZ and AMC in the low or high ESBL producing groups. Due to the action of clavulanic acid, β-lactamase inhibitor (Rossi et al., 2016), their intensity decreased after exposure to CAZ and AMC. Hence, E. coli colonies’ exposure to CAZ alone and co-exposure to CAZ and AMC should be collected for ESBL spectrum identification using the peptide analysis method via the VITEK® MS apparatus.
Figure 4 shows six spectra, located at 3578, 4613, 6226, 6316, 7274, 8370, and 10476 Da that exhibited their increasing intensity after co-exposure to CAZ and AMC. It may be suggested that they were not ESBL indicative spectra and play a role as the stress spectra after exposure to clavulanic acid. We suggested these spectra for further identification as the stress protein 1-6. Further study will be taken place for extraction and identification these spectra. On the other hand, three spectra, 4613, 7153, and 9715 Da, were decreased after compared between co-exposure to CAZ and AMC, and exposure to CAZ alone. It may be suggested that these proteins were degraded by clavulanic acid contained in AMC. These spectra play a role in the manner of ESBL (Oviaño et al., 2019). For the nomination of these ESBL protein, we assumed these proteins as ESBL spectra 4613 Da, ESBL spectra 7153 Da, and ESBL spectra 9715 Da. The proteomic identification will be set for confirming these proteins that played as ESBL manner, and identifying their names of protein that may be indicated by other investigators.
From the previous study, Nakamura et al (Nakamura et al., 2019) reported the nearby spectrum to our ESBL spectrum. In the study of 197 ESBL-producing E. coli isolated from clinical specimens in Japan between 2011 - 2013, the results revealed that a spectrum at 9710 Da was significantly detected and then identified as the acid-stress chaperone HdeA that was responsible for the function of the stress response protein acid-resistance protein. It was the stress protein in response to an acidic environment and was located at the periplasm of E. coli. HdeA was the member of the gastric acid resistance-related proteins cluster (Gajiwala et al., 2000; Hong et al., 2012). Nevertheless, our present study mentioned the in vitro study of the clavulanic acid effect on ESBL enzymes. Hence, the spectrum 9715 Da that was previously described by Nakamura et al. (Nakamura et al., 2019) may not be related to the ESBL inactivation after co-exposure to CAZ and AMC.
Since no reports were found regarding ESBL spectra of nosocomial E. coli population, we, therefore, compared the results of our present study to a previous study from our colleagues that focused on the community-acquired population of E. coli (Lananta et al., 2021). Comparably, the previous results demonstrated that four E. coli-specific spectra at 4362, 5380, 6254, and 9063 Da were very similar to those of our results which showed at 4363, 5381, 6255, and 9065 Da with percent detected frequency at 91.25, 85.25, 82.75, and 75.50, respectively. However, one E. coli species-specific spectrum from their report, 4531 Da, was not classified as E. coli-specific spectrum in our study due to a low detected frequency at 57.31%. We found a different spectrum at 5097 Da which was an E. coli-specific spectrum at 77.25%. It suggests that the nosocomial E. coli may produce some species-specific proteins different from that of community-acquired isolates.
According to the four ESBL spectra of the previous study, variations of their results after compared with our investigation were demonstrated. Unlike a previous study (Lananta et al., 2021), our study demonstrated that significant drug hydrolysis was not detected at 10477 Da which was then reported to be an ESBL spectrum after tested by co-exposure to CAZ and AMC. Interestingly, the next ESBL spectrum at 9715 Da was significantly detected as an ESBL spectrum of the high ESBL-producing group, and this was consistent with the prior result reporting a very similar ESBL spectrum at 9713 Da that exhibited in the same manner of decreasing intensity after co-exposure to CAZ and AMC. The further significant spectrum at 8371 Da that is exclusively related to CAZ hydrolysis in the high ESBL producers was reported in the previous study (Lananta et al., 2021). However, we identified that the 8370 Da spectrum was significant as the CAZ-stress spectra in nosocomial E. coli. This is reasonable that nosocomial E. coli exist with a high degree of resistance to CAZ. The activity of AMC may not completely degrade this protein, we then observed no difference in the spectrum intensity. Considering this possible event, using the more effective group of antibiotics such as a group of aminoglycosides is recommended. Moreover, the last spectrum at 5096 Da was verified to be an E. coli-specific spectrum in our investigation as shown above which was in contrast to the previous study claiming that this spectrum was an ESBL spectrum.
CONCLUSION
The present study revealed that the numbers of nosocomial urinary tract infected Escherichia coli could produce ESBL enzyme causing the treatment failure of cephalosporin, but they were still susceptible to carbapenems and aminoglycosides. For ESBL analysis via VITEK® MS, the significant spectra which exhibited the decreased intensity were interpreted as ESBL indicative spectra. They were the peptide spectra, located at 4613 and 9715 Da in the high ESBL producing E. coli, and 7153 Da in the low ESBL group. These spectra can be applied as the indicative spectra for ESBL determination by using VITEK® MS. Furthermore, the VITEK® MS peptide analysis could be applied for the detection of another interesting peptide as well as an antibiotic resistance-related peptide.
ACKNOWLEDGMENTS
The authors were sincerely grateful to our technicians at Diagnostic Laboratory Unit, Maharaj Nakorn Chiang Mai Hospital for providing the bacterial collection and the VITEK MS analysis. We also thank our technicians at the Department of Microbiology, Faculty of Medicine, Chiang Mai University for helping and providing the laboratory.
AUTHOR CONTRIBUTIONS
Pratchaya Wisutthithada and Rutjapong Nongmak made the research proposal and did the experiment and wrote the manuscript. Thanathida Sirilueangtrakul, and Ponkit Suwannapong made the biosafety approval and collected the VITEK® MS spectra and read the final manuscript. Phadungkiat Khamnoi collected the tested bacteria and operated VITEK® MS. Thanapat Sastraruji performed the statistical analysis. Siriwoot Sookkhee designed the experiments, did the experiment, wrote the manuscript. All authors read and approved the final manuscript.
CONFLICT OF INTEREST
The authors declare that they hold no competing interests.
REFERENCES
Apisarnthanarak, A., Kiratisin, P., Saifon, P., Kitphati, R., Dejsirilert, S., and Mundy, L.M. 2007. Clinical and molecular epidemiology of community-onset, extended-spectrum beta-lactamase-producing Escherichia coli infections in Thailand: A case-case-control study. American Journal of Infection Control. 35: 606-612.
Denisuik, A.J., Karlowsky, J.A., Adam, H.J., Baxter, M.R., Lagacé-Wiens, P.R.S., Mulvey, M.R., et al. 2019. Dramatic rise in the proportion of ESBL-producing Escherichia coli and Klebsiella pneumoniae among clinical isolates identified in Canadian hospital laboratories from 2007 to 2016. Journal of Antimicrobial Chemotherapy. 74(Suppl 4): iv64-iv71.
Flores-Mireles, A.L., Walker, J.N., Caparon, M., and Hultgren, S.J. 2015. Urinary tract infections: Epidemiology, mechanisms of infection and treatment options. Nature Reviews Microbiology. 13: 269-284.
Gajiwala, K.S., and Burley, S.K. 2000. HDEA, a periplasmic protein that supports acid resistance in pathogenic enteric bacteria. Journal of Molecular Biology. 295: 605-612.
Hong, W., Wu, Y.E., Fu, X., and Chang, Z. 2012. Chaperone-dependent mechanisms for acid resistance in enteric bacteria. Trends in Microbiology. 20: 328-335.
Kaur, J., Chopra, S., Sheevani, and Mahajan, G. 2013. Modified double disc synergy test to detect ESBL production in urinary isolates of Escherichia coli and Klebsiella pneumoniae. Journal of Clinical and Diagnostic Research. 7: 229-233.
Khot, P.D. and Fisher, M.A. 2013. Novel approach for differentiating Shigella species and Escherichia coli by matrix-assisted laser desorption ionization-time of flight mass spectrometry. Journal of Clinical Microbiology. 51: 3711-3716.
Kumar, D., Singh, A.K., Ali, M.R., and Chander, Y. 2014. Antimicrobial susceptibility profile of extended spectrum β-lactamase (ESBL) producing Escherichia coli from various clinical samples. Infectious Diseases – Auckland. 7: 1-8.
Lananta, S., Siriratanagool, P., Sommanawan, N., Lerttrakarnnon, P., Boonchuay, S., Jirawattanapong, S., et al. 2021. Different responses of ESBL indicative peptide spectra to various β- lactam exposures among community acquired urinary tract infected Escherichia coli by using the MALDI-TOF technique. Chiang Mai University Journal of Natural Sciences. 20: e2021095.
Lee, W., Kim, M., Yong, D., Jeong, S. H., Lee, K., and Chong, Y. 2015. Evaluation of VITEK mass spectrometry (MS), a matrix-assisted laser desorption ionization time-of-flight MS system for identification of anaerobic bacteria. Annals of Laboratory Medicine. 35: 69-75.
Marrs, C. F., Zhang, L., and Foxman, B. 2005. Escherichia coli mediated urinary tract infections: Are there distinct uropathogenic E. coli (UPEC) pathotypes? FEMS Microbiology Letters. 252: 183-190.
Martiny, D., Busson, L., Wybo, I., El Haj Rachid, A., Dediste, A., and Vandenberg, O. 2012. Comparison of the microflex LT and Vitek MS systems for routine identification of bacteria by matrix-assisted laser desorption ionization–time of flight mass spectrometry. Journal of Clinical Microbiology. 50: 1313-1325.
Matsukawa, M., Igarashi, M., Watanabe, H., Qin, L., Ohnishi, M., Terajima, J., et al. 2019. Epidemiology and genotypic characterisation of dissemination patterns of uropathogenic Escherichia coli in a community. Epidemiology and Infection. 147: e148.
Nakamura, A., Komatsu, M., Ohno, Y., Noguchi, N., Kondo, A., and Hatano, N. 2019. Identification of specific protein amino acid substitutions of extended-spectrum β-lactamase (ESBL)-producing Escherichia coli ST131: A proteomics approach using mass spectrometry. Scientific Reports. 9: 8555.
National Committee for Clinical Laboratory Standards. 2018. Performance standards for antimicrobial susceptibility testing M100. Twenty eighth ed. (Vol. Twenty eighth ). Wayne, PA: National Committee for Clinical Laboratory Standards.
Oviaño, M. and Bou, G. 2019. Matrix-assisted laser desorption ionization-time of flight mass spectrometry for the rapid detection of antimicrobial resistance mechanisms and beyond. Clinical Microbiology Reviews. 32: e0037-18.
Poole, K. 2012. Bacterial stress responses as determinants of antimicrobial resistance. Journal of Antimicrobial Chemotherapy. 67: 2069-2089.
Richter, S.S., Sercia, L., Branda, J.A., Burnham, C.A., Bythrow, M., Ferraro, M.J., et al. 2013. Identification of Enterobacteriaceae by matrix-assisted laser desorption/ionization time-of-flight mass spectrometry using the VITEK MS system. European Journal of Clinical Microbiology & Infectious Diseases. 32: 1571-1578.
Rossi, B., Soubirou, J. F., Chau, F., Massias, L., Dion, S., Lepeule, R., et al. 2016. Cefotaxime and amoxicillin-clavulanate synergism against extended-spectrum-β-lactamase-producing Escherichia coli in a murine model of urinary tract infection. Antimicrobial Agents and Chemotherapy. 60: 424-430.
Sawatwong, P., Sapchookul, P., Whistler, T., Gregory, C. J., Sangwichian, O., Makprasert, S., et al. 2019. High burden of extended-spectrum β-lactamase-producing Escherichia coli and Klebsiella pneumoniae bacteremia in older adults: A seven-year study in two rural Thai provinces. The American Journal of Tropical Medicine and Hygiene. 100: 943-951.
Seenama, C., Thamlikitkul, V., and Ratthawongjirakul, P. 2019. Multilocus sequence typing and blaESBL characterization of extended-spectrum beta-lactamase-producing Escherichia coli isolated from healthy humans and swine in Northern Thailand. Infection and Drug Resistance. 12: 2201 - 2214.
Singhavejsakul, P., Niamsup, P., Malairungsakul, N., Chaisaen, Y., Pooriwarangkakul, P., Nimlamool, W., et al. 2022. Clavulanic acid - susceptible peptide spectra tested with agar disk diffusion and E-test of urinary tract infected Escherichia coli isolated from the community-acquired infection. Chiang Mai University Journal of Natural Sciences, 21: e2022035.
Thorrold, C.A., Letsoalo, M.E., Dusé, A.G., and Marais, E. 2007. Efflux pump activity in fluoroquinolone and tetracycline resistant Salmonella and E. coli implicated in reduced susceptibility to household antimicrobial cleaning agents. International Journal of Food Microbiology. 113: 315-320.
OPEN access freely available online
Chiang Mai University Journal of Natural Sciences [ISSN 16851994]
Chiang Mai University, Thailand.
https://cmuj.cmu.ac.th
Pratchaya Wisutthithada1, Thanathida Sirilueangtrakul1, Ponkit Suwannapong1, Rutjapong Nongmak1, Phadungkiat Khamnoi2, Thanapat Sastraruji3, and Siriwoot Sookkhee1,*
1 Department of Microbiology, Faculty of Medicine, Chiang Mai University, Chiang Mai 50200, Thailand.
2 Diagnostic Laboratory Unit, Maharaj Nakorn Chiang Mai Hospital, Faculty of Medicine, Chiang Mai University, Chiang Mai 50200, Thailand.
3 Dentistry Research Center, Faculty of Dentistry, Chiang Mai University, Chiang Mai 50200, Thailand.
Corresponding author: Siriwoot Sookkhee, E-mail: siriwoot.s@cmu.ac.th
Total Article Views
Editor: Wasu Prathum-Aree,
Chiang Mai University, Thailand
Article history:
Received: Mach 16, 2022;
Revised: August 23, 2022;
Accepted: August 30, 2022;
Published online: September 2, 2022