 ISSN: 2822-0838 Online

Adsorption of Fe(II) Solution by Sugarcane Bagasse and Activated Carbon Prepared from Sugarcane Bagasse. Suchada Sawasdee and Prachart Watcharabundit*
Published Date : 2019-04-1
DOI : https://doi.org/10.12982/CMUJNS.2019.0015
Journal Issues :
Number 2 , April-June 2019
ABSTRACT
Fe(II) contaminant in groundwater is one of the most important in the environmental pollutions as it affects the taste, esthetic quality of the water and turns the color of the water to red-brown. Moreover, when Fe(II) contaminate in large amounts, it is harmful to health. The objective of this study was to evaluate the performance of Fe(II) removal in aqueous solution by the low-cost adsorbents namely, sugarcane bagasse (SB) and activated carbon prepared from sugarcane bagasse (ACSB). The two adsorbents were characterized by BET, FTIR, SEM, and XRF. The adsorption behavior of SB and ACSB for Fe(II) in aqueous solution was investigated as the function of pH (1-5), contact time (5-360 min), initial Fe(II) concentration (50-250 mg/L), and temperature (20- 40oC). The adsorption data were analyzed by isotherm and kinetic models. The experimental equilibrium data were best fitted with the Langmuir isotherm model and the maximum monolayer adsorption capacity values were 39.52 and 131.57 mg/g for the SB and the ACSB respectively. The kinetic adsorption data were found to fit well with the pseudo-second-order kinetic and intraparticle diffusion models. Thermodynamic analysis results showed that the adsorption of Fe(II) was spontaneous and endothermic in nature, and was controlled by physical mechanism. In summary, the findings suggested that SB and ACSB were efficient adsorbents, and ACSB showed higher removal of Fe(II) from aqueous solution.
Keywords: Adsorption, Fe(II), Sugarcane bagasse, Activated carbon
INTRODUCTION
Groundwater is the vital source of drinking water. It quickly gets contaminated with dissolved ferrous ion (Fe(II)) that restricts its consumption as potable water because it forms colloidal red matter (mainly ferric oxyhydroxides) under oxic conditions at near neutral pH (>6) conditions (Hamdouni et al., 2016). Iron (Fe) in groundwater occurs the problems for applications such slag formation in boilers and hand pumps or tube fail to provide the required service due to clogging by Fe deposition (Maneechakr and Karnjanakom, 2017). The presence of Fe could confer color, poor bitter taste, staining of laundry and plumbing fixtures. Therefore, the treatment of water before consuming is necessary.
Conventional techniques are used to remove heavy metals usually include chemical precipitation, ion exchange, reverse-osmosis, electrochemical treatment, and adsorption. Among the various types of existing effluent treatment, the adsorption process using activated carbon is of easy application, good efficiency, and economically viable (Cazetta et al., 2011). Adsorption method is a most common technique for the removal of heavy metal (Srivastava et al., 2009), and it seems to be more user-friendly and efficient if combined with appropriate bioadsorbent and regeneration steps (Zhang et al., 2014). Activated carbon is widely used as an adsorbent because of its high surface area and high adsorption capacity. It is famous for potable water treatment because of usefulness in removing taste and odor, causing of compounds, chlorinated compounds, and metals (Jusoh et al., 2005). However, the commercial activated carbon is prohibitively expensive, which limits its application (Sun et al., 2013). Therefore, the researchers have developed low-cost activated carbon from agricultural waste product such as Strychnos nux-vomica L (Arivoli et al., 2013), olive stones (Akl et al., 2013), mango seed (Moustafa et al.,2015), and Pods of Acacia Nilotica Var Astringens (Sunt tree) (Elhussien, 2015).
Sugarcane bagasse is the waste product from sugar industry, and usually available in a large quantity of production. It contains cellulose, hemicellulose, and lignin. The polysaccharides found in sugarcane bagasse are biopolymers having many hydroxyl and phenolic groups (Homagai et al., 2010). For activated carbon, the adsorptive properties are determined not only by its porous structure but also by its chemical composition, and oxygen surface groups are formed by reaction with oxygen during the carbon preparation steps. The nature of these oxygen surface groups— carboxyl, carbonyl, phenol, ether, and lactone— is responsible for the basic or acid character of the carbon, which is a key parameter for an efficient adsorption between the adsorbent and the adsorbate (Martins and Nunes, 2015). Biosorption process by agricultural by-product is a friendly approach and has been proved to be a cost-effective and nonhazardous technology for the removal of heavy metals from water (Tajernia et al., 2014).
In this study, the removal of Fe(II) from the aqueous solution using the sugarcane bagasse and activated carbon prepared from sugarcane bagasse was investigated. The effects of different parameters such as pH, contact time, initial Fe(II) concentration, and temperature were evaluated. The equilibrium adsorption data were analyzed using the Langmuir, Freundlich, and Dubinin—Radushkevich adsorption isotherm models. The kinetic adsorption data were analyzed using pseudo—first—order, pseudo—second—order, and intraparticle diffusion models. The thermodynamic parameters of the adsorption process such as the free energy, enthalpy, and entropy changes were determined at the temperature of 20, 30, and 40 °C.
MATERIALS AND METHODS
Preparation of adsorbent
Sugarcane Bagasse (SB) was obtained from a local shop in Lopburi, Thailand. It was removed all dirt by double distilled water and dried in a hot air oven at 100°C for 24 h. It was sieved to150—300 mm, then stored in a desiccator for further use.
For the preparation of activated carbon (ACSB), the sugarcane bagasse was washed with distilled water and dried in a hot air oven. Then, it was cut to about 1—2 inches long and soak in 1.0 mol/L phosphoric acid for 24 h with the ratio of 1:10 g/cm3. The acid sugarcane bagasse was carbonized in a muffle furnace at 600ºC for 1 hr. The activated carbon product was dried overnight and washed with deionized water until the pH of the filtrate reached 6.5—7. It was dried at 100°C for 24 h. Then, it was crushed with blender and sieved to particle size of 150-300 mm, and stored in a desiccator for further use.
Preparation of adsorbate
Ammonium ferrous sulfate, (NH4)2Fe(SO4)2.6H2O (AJAX FineChem Australia), was used as the adsorbate. Its stock solution (500 mg/L) was prepared in distilled water and further diluted to the desired concentrations. All the chemical reagents used in this study were analytical grade.
For determination of Fe(II) concentration, the sample was reacted with o-phenanthroline in order to form the colored complex ions. The intensity of the colored species was measured using UV—Visible spectrophotometer (Analytik Jena, Specord 210 plus) at 508 nm. The calibration curve of absorbance versus concentration of Fe(II) was constructed for determining of unknown concentration of Fe(II) in the samples.
Characterization of adsorbent
FTIR (Model Two, Perkin Elmer) analysis was used to determine the spectra from 4,000—750 cm−1. The X—ray fluorescence (XRF) spectrum analysis (Horiba) was conducted for the elemental composition. The surface morphology was carried out by using a scanning electron microscope (Philips: XL30), and the specific surface area of adsorbents was determined by BET method (Autosorb 1 MP, Ouantachrome).
Batch Adsorption
The adsorption of Fe(II) on SB and ACSB adsorbents was investigated in the batch method with the varying effect of pH, contact time, initial concentration, and temperature. The pH of Fe(II) solution was adjusted with 0.1 mol/L HCl and 0.1 mol/L NaOH. To evaluate the adsorption process, the experiments were carried out with different contact time (5-360 min) in 250-ml Erlenmeyer flasks containing known amount of adsorbent (0.2 g of SB or 0.1 g ACSB) and 100 ml of initial Fe(II) concentration (50-250 mg/L). The flasks were agitated in an isothermal shaker at 30°C and 200 rpm. At the predetermined time, the suspended matter in the flask was filtered, and the supernatant was measured for Fe(II) concentration by UV-Visible spectrophotometer. The percent (%) and capacity ( qt ) of adsorption were calculated by Eq. (1) and Eq. (2), respectively.

where Co (mg/L) is initial concentration of Fe(II), Ct (mg/L) is the concentration remained at time t, qt (mg/g) is the amount adsorbed at the predetermined time, V(L) is the volume of the solution, and W(g) is the mass of adsorbent.
Adsorption Isotherm
The adsorption isotherm describes how the adsorbate molecules are distributed between the liquid phase and solid phase when the system reaches the equilibrium. In order to optimize the design of an adsorption system of SB and ACSB, three adsorption isotherm models namely the Langmuir, Freundlich and Dubinin–Radushkevich isotherms were applied to the equilibrium data. The Langmuir isotherm is widely adopted to characterize the monolayer adsorption process on a homogeneous surface without interaction among the immobile adsorbate. The isotherm in a linear form is represented as follows:

where Ce (mg/l) is the equilibrium concentration, qe (mg/g) is the amount adsorbed at equilibrium, KL is the Langmuir constant and qmax (mg/g) is the maximum adsorption capacity.
The essential characteristics of the Langmuir isotherm can be expressed as a dimensionless separation factor or equilibrium parameter ( RL ) which is defined by

The Freundlich isotherm is semi-empirical, assuming that the adsorption process occurs on the heterogeneous surface. The isotherm in a linear form is represented as follows:

where KF (L/g) is the adsorption capacity and 1/n is the adsorption intensity.
The Dubinin–Radushkevich isotherm is used to predict the nature of adsorption processes asphysical and chemical by calculating sorption energy. The isotherm in a linear form is represented as follows:
![]()
where є (Polanyi potential) is equal to [RT ln (1+1/ Ce )], R is the gas constant, and T is the absolute temperature. The constant KDR is the slope of the plot between ln qe and є2, and it gives an idea about the mean adsorption energy (E, kJ/mol) which explain about the adsorption mechanism, and the equation is shown as follows:

If E value is between 8 and 16 kJ/mol, the biosorption process is chemical ion exchange in nature and if E < 8 kJ/mol, it is physical in nature (Chowdhury et al., 2011).
Adsorption Kinetics
Kinetic study is important to understand the dynamic of the reaction. Its parameters provide information for designing and modeling the adsorption process. In the present work, the experimental results were analyzed according to the pseudo–first–order, pseudo–second–order, and intraparticle diffusion models. The pseudo–first–order kinetic and pseudo–second–order kinetic in the linear forms are written in Eq.(8) and Eq.(9), respectively:

where k1 (min-1) and k 2 (g.mg-1.min-1) are the rate constant of pseudo–first–order adsorption and pseudo–second–order adsorption, respectively. For the pseudo– second–order kinetic parameters, the initial adsorption rate (h, mg.g-1.min-1) was calculated using Eq. (10):

The intraparticle diffusion model is expressed as:
![]()
where qt is the amount of adsorbate retained at the time (t), Kid is the intraparticle diffusion rate constant (mg.g-1min-1/2), and C is the intercept.
Thermodynamic of adsorption
In order to know the type and spontaneity of adsorption process of Fe(II), the study of the effect of temperature is required. The thermodynamic parameters such as Gibbs free energy (ΔG°), enthalpy (ΔH°), and entropy (ΔS°) changes were determined.
The Gibbs free energy change (ΔG°) (kJ/mol) can be expressed as follows:
![]()
where Kc is the equilibrium constant, R is the gas constant and T is the absolute temperature. For determination of the enthalpy (ΔH°) and the entropy (ΔS°), the equation (13) is used for plotting between ln Kc and 1/T. Then, the enthalpy and the entropy are evaluated from its slope and intercept of the linear curve, respectively.

RESULTS
Characterization of adsorbents
FTIR analysis was used to identify spectra of SB and ACSB before and after the Fe(II) adsorption in the range 4,000-750 cm-1. The FTIR spectra of the SB and ACSB were shown in Figure 1 and 2.
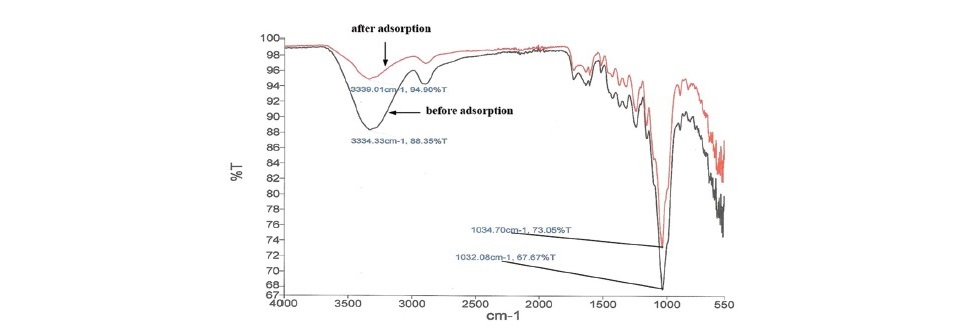
Figure 1. The FTIR spectra of SB before and after adsorption.
Figure 1 showed the peak before and after Fe(II) adsorption on SB. For before adsorption, the band of O–H stretching occurred at the range 3,100– 3,600 cm-1. The broad peak observed at 3,334.33 cm-1 was due to the stretching vibration of the –OH groups. The peak located at 1,730 cm-1 was C=O stretching carbonyl in non-conjugated ketones and ester groups (Tajernia et al., 2014). The band at the region 1,600–1,590 cm–1 was represented skeletal vibrations of the benzene ring, and at the region of 1,420–1,300 cm–1 was attributed to C = C–H in-plane bending indicating several bands of cellulose and xylose (Sharma and Kaur, 2011). At the range of 1,425-1,465 cm–1, the band was due to the stretching of cellulose and lignin (Bodirlau et al., 2008). The strong peak at 1,032.08 cm-1 was attributed to the C-O-C pyranose ring skeletal vibration (Sun et al., 2004). For after adsorption, the peak observed at 3,334.33 cm-1 shifted to 3,339.01 cm-1and the peak at 1,032.08 cm-1 shifted to 1,034.70 cm-1. This was due to the adsorption of Fe(II) on the sugarcane bagasse at –OH and C-O-C groups.
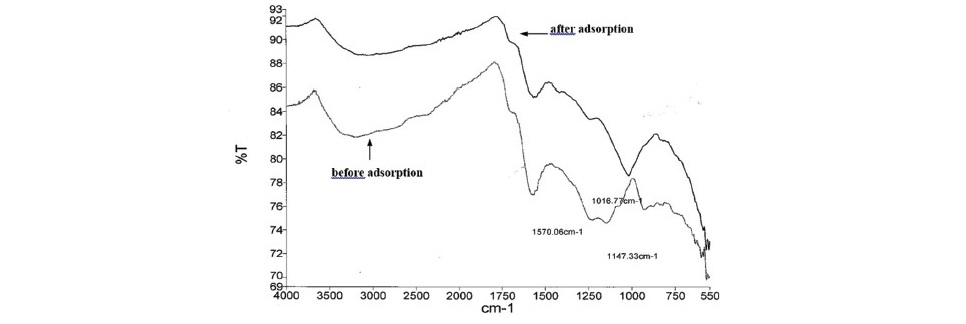
Figure 2. The FTIR spectra of ACSB before and after adsorption.
Figure 2 showed the peak before Fe(II) adsorption on ACSB. The broad peak at the region 3,000-4,000 cm-1 was due to the O–H of hydrogen bonds in water or O–H stretching in cellulose, hemicellulose, and lignin (Bodirlau et al., 2008). The band at around 1,720 cm-1 was ascribed to the stretching vibrations of carboxyl groups on the edges of layer planes or to conjugated carbonyl groups (C=O in carboxylic acid and lactones group) (Xu and Liu, 2008). The peaks at the region 1,500-1,590 cm-1 were assigned to ring vibration in a large aromatic skeleton found in the carbonaceous material, such as activated carbon (Sun et al., 2013). There were intensive and broad bands at 1,147 and 1,570 cm-1 suggesting the presence of C-O stretching (in acids, alcohols, phenols, ethers and esters) and C-C vibrations (in aromatic rings), respectively (Yakout and Sharaf El-Deen, 2016).
For after Fe(II) adsorption, the intensity of each peak was lower than the before adsorption peak, and the peaks shifted. The band at 1,147.33 cm-1 disappeared because of the interaction of Fe(II) with activated carbon, while the new peak appeared at 1,016.77 cm-1.
Specific surface area study
The specific surface area, pore volume, and average pore radius were determined by nitrogen adsorption at 77.15 K using Autosorb 1 MP. The three characterizations of adsorbents were presented in Table 1.
Table 1. The surface area of SB and ACSB.

Scanning electron microscopic study
The SEM images of SB and ACSB adsorbents were shown in Figure 3(a and b). The micrograph in Figure 3a showed that SB had a smooth and porosity on the surface. The micrograph in Figure 3b showed that ACSB had much of roughness and high microporous and macroporous on the surface.
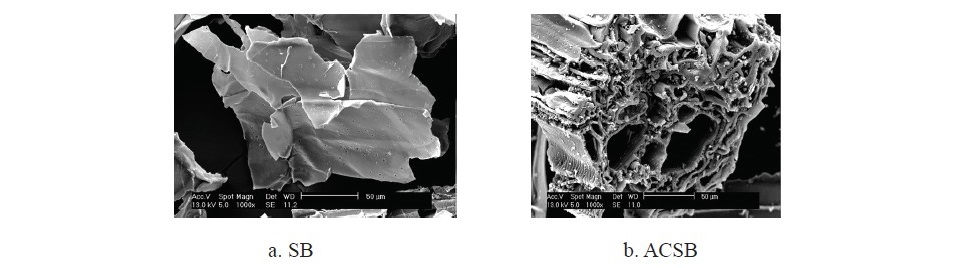
Figure 3. (a and b). The SEM micrographs of SB and ACSB.
XRF study
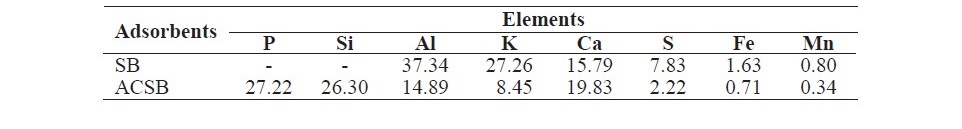
The chemical compositions of SB and ACSB shown in Table 2 were studied by XRF.
Table 2. The chemical composition of SB and ACSB.
Adsorption study
Effect of pH on adsorption. pH of adsorbate solution is one of the most important factors affecting the adsorption. In Figure 4, the results showed that the percent adsorption increased with the increase of pH. From pH 1 to 4, the percent of adsorption increased from 27.14 to 46.84 and 39.72 to 57.30 for SB and ACSB, respectively. The optimum pH for Fe(II) adsorption was observed at pH 4. At pH > 4, the percent of adsorption decreased.
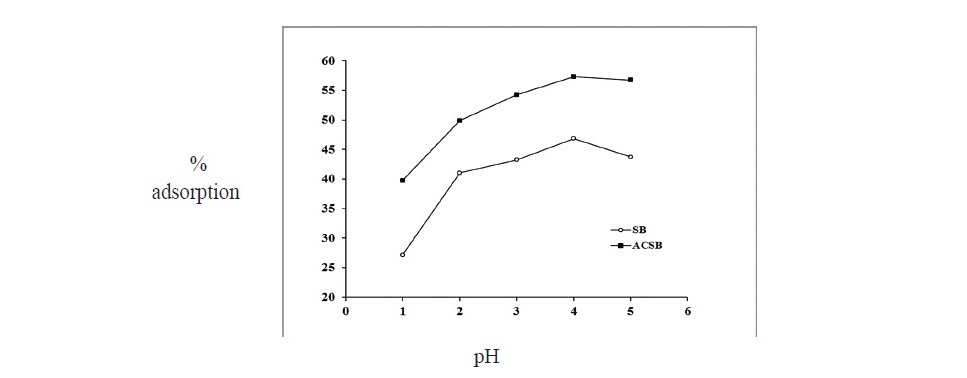
Figure 4. Effect of pH on Fe(II) adsorption by SB and ACSB (adsorbent dose 0.2 g for SB and 0.1 g for ACSB : initial Fe(II) concentration 100 mg/L : contact time 120 min : temperature 30°C).
Effect of contact time on Fe(II) adsorption
The contact time (5-360 min) is affecting adsorption capacity of adsorption process and the plots of adsorption capacity versus time were shown in Figure 5. The results showed that the Fe(II) adsorption were rapid at the first 15 min, and equilibrium was attained within 60 min for SB and 90 min for ACSB, respectively.
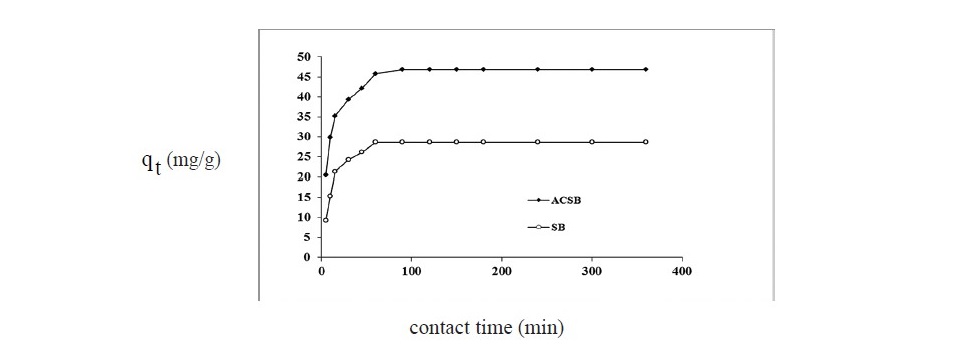
Figure 5. Effect of contact time on Fe(II) adsorption by SB and ACSB (pH = 4 : adsorbent dose 0.2 g for SB and 0.1 g for ACSB: initial Fe(II) concentration 100 mg/L: temperature 30oC).
Effect of initial Fe(II) concentration on adsorption
Effect of initial Fe(II) concentration (50–250 mg/L) on Fe(II) adsorption by SB and ACSB was shown in Figure 6. The results showed that the adsorption capacity increased with increase in initial Fe(II) concentration. At the initial Fe(II) concentration from 50 to 250 mg/L, the adsorption capacity increased from 13.10 to 36.89 mg/g and 27.13 to 84.24 mg/g for SB and ACSB, respectively.
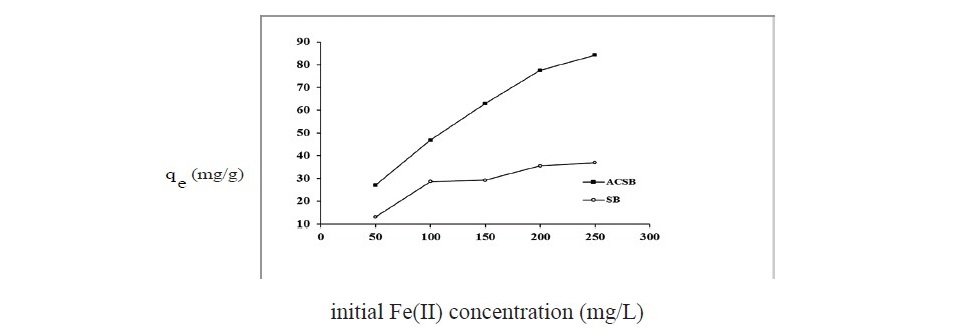
Figure 6. Effect of initial Fe(II) concentration on adsorption by SB and ACSB (pH = 4 : adsorbent dose 0.2 g for SB and 0.1 g for ACSB: initial Fe(II) concentration 100 mg/L : contact time 60 min for SB and 90 min for ACSB: temperature 30°C).
Adsorption isotherm study
From the study of effect of concentration at equilibrium time, the experimental adsorption data were analyzed using Langmuir, Freundlich, and Dubinin- Radushkevich isotherm. The linear plots of Langmuir and Freundlich isotherms for the adsorption on SB and ACSB were shown in Figure 7.
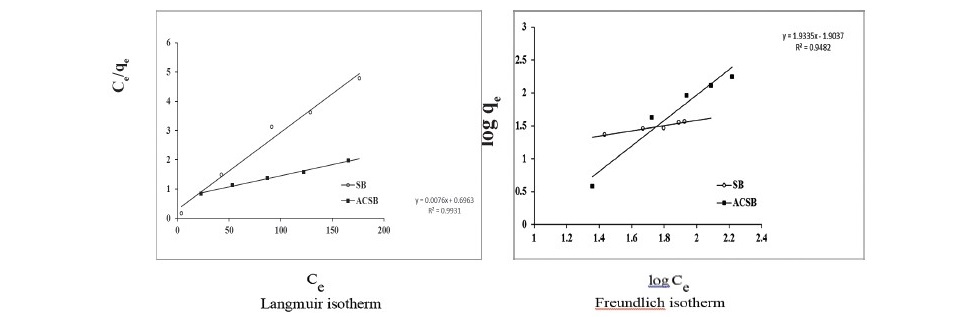
Figure 7. Isotherm of Fe(II) adsorption on SB and ACSB.
The isotherm parameters obtained from the linear plots were listed in Table 3.
Table 3. Isotherm models for Fe(II) adsorption by SB and ACSB.
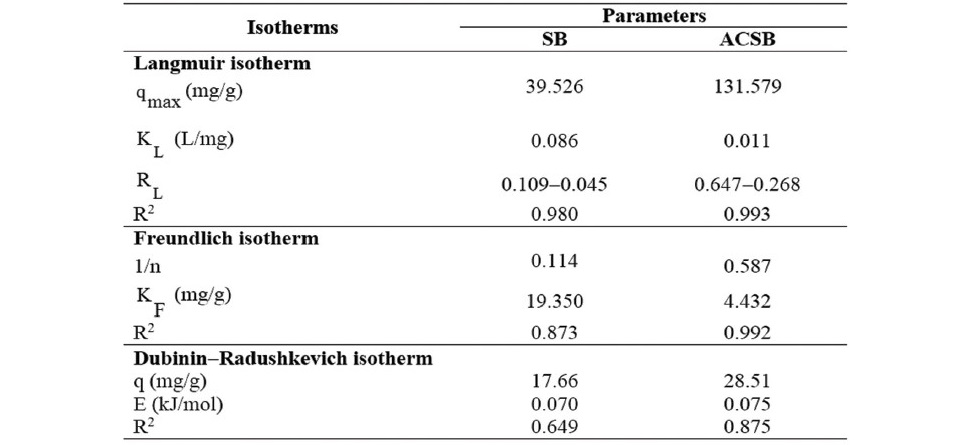
From Table 3, the results showed that the values of R2 for Langmuir isotherm (0.980 and 0.993 for SB and ACSB) were higher than that obtained from the Freundlich (0.873 for SB and 0.992 for ACSB) and Dubinin-Radushkevich isotherm (0.649 and 0.875 for SB and ACSB). The equilibrium adsorption data were fitted well with the Langmuir isotherm model and the maximum adsorption capacity values were 39.526 mg/g and 131.57mg/g for SB and ACSB, respectively.
Adsorption kinetics
The kinetics of Fe(II) adsorption data were analyzed using the linear plots of pseudo-first kinetic, pseudo-second kinetic and intraparticle diffusion for initial Fe(II) concentration of 100 mg/L. The kinetic plots were shown in Figure 8, and the kinetic parameters were presented in Table 4.
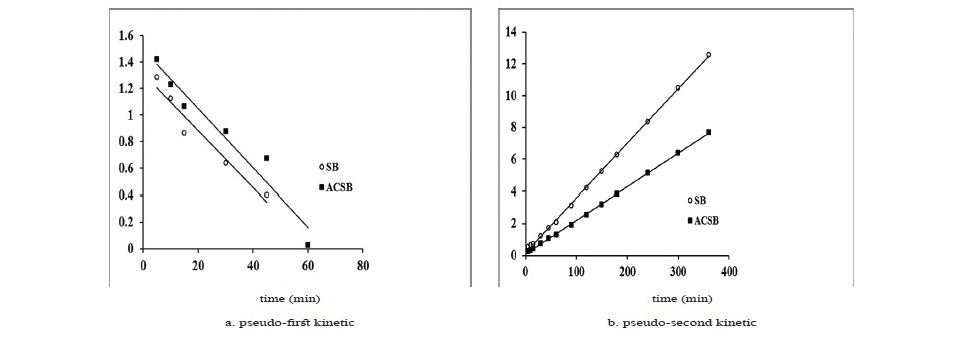

Figure 8. (a, b and c). Kinetics of Fe(II) adsorption on SB and ACSB.
Table 4. Kinetic parameters of Fe(II) adsorption on SB and ACSB.
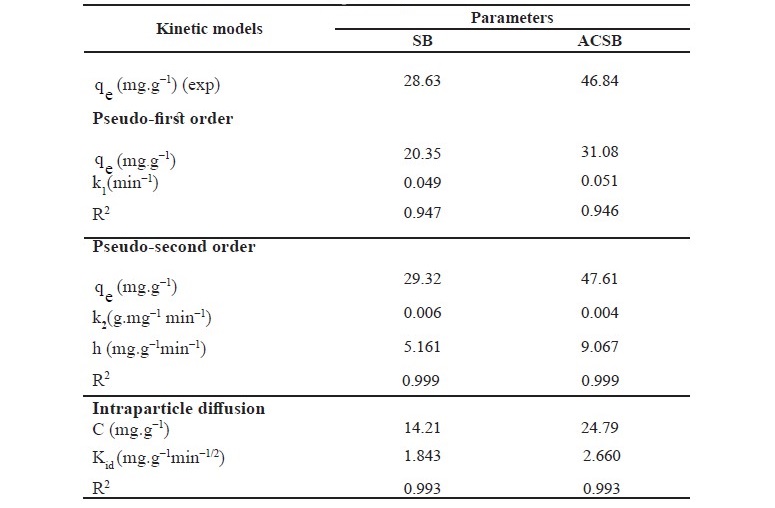
As seen in Table 4, the correlation coefficient (R2) of the pseudo─second─order kinetic model on Fe(II) adsorption was 0.999 for SB and 0.999 for ACSB which was higher than that of the pseudo─first─order. Therefore, the kinetic study showed that the adsorption followed pseudo─second─order. In addition, the initial adsorption rate (h) for ACSB was higher than for SB. Also, the plot of the intraparticle diffusion showed three linear stages, and intraparticle diffusion region─the second stage ─ did not pass through the origin. The intercept (C) explained for the thickness of boundary layer.
Thermodynamic Parameters
For thermodynamic study, the adsorption experiments were carried out at 20, 30, and 40oC. From the experimental results, ΔGo values were calculated as Eq. 12, then ΔHo and ΔSo can be determined from the slope and intercept of the plot between ln Kc versus 1/T. The thermodynamic parameters were shown in Table 5.
Table 5. Thermodynamic parameter of Fe(II) adsorption on SB and ACSB.
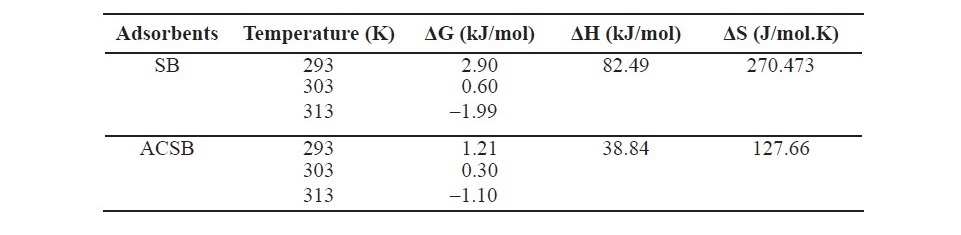
As seen in Table 5, the free energy (ΔG) values of Fe(II) adsorption at the temperature of 293, 303 and 313 K were 2.9, 0.60, –1.99 and 1.21, 0.30, –1.10 kJ/mol for SB and ACSB, respectively. The enthalpy changes (ΔH) of the adsorption on SB and ACSB were 82.49 and 38.84 kJ/mol, respectively. The entropy (ΔS) was 270.473 and 127.66 J/mol.K for SB and ACSB, respectively.
DISCUSSION
In this research, SB and ACSB were used as the adsorbents for application of Fe(II) adsorption in aqueous solution. All batch experiments were carried out to investigate the adsorption capacity at varying effects such as pH (1-5), contact time (5-360 min), initial Fe(II) concentration (50-250 mg/L), and temperature (20-40oC). The two adsorbents were characterized by FTIR, XRF, BET, and SEM. The FTIR spectra of ACSB showed that there was the disappearance of bands when compar- ing with SB, indicating that the chemical bonds were broken during the activation process. For XRF study, the ACSB showed more chemical composition of P and Si. From the specific surface area study, the values of BET surface area and pore volume of ACSB were larger than of SB. The results of BET analysis showed that the specific surface area of ACSB was more than 23 times that of SB, 309.87 m2/g versus 13.02 m2/g. This was because of the development of porosity of ACSB during the activation process, and the activation caused formation of smaller pores in solid particles as shown in Table 1. The enhanced specific surface area indicated that a functional mesoporous material was obtained (Kul and Koyuncu, 2010). In addition, the SEM images showed that the activation method with phosphoric acid provided the development of many pores with varying sizes and the ACSB of higher surface area.
Some studies have shown that the solution pH was associated with the surface charge of adsorbents, the degree of ionization, and the different ionic forms of heavy metals in solution, all of which affected the heavy metal adsorption process (Zhao et al., 2010; Romero-Guzman et al., 2013). Removal efficiencies at different pH may be attributed to one or more of the factors. In this study, the results showed that the percent adsorption increased with the increase of solution pH from 1 to 4. This fact can be explained that low biosorption is due to the protonation of the adsorbent surface which results in repulsion between positively charged surface groups and Fe(II) ions, and hence cause the reduced biosorption at lower pH. As the pH increases, more negatively charged surfaces are available resulting in decrease in repulsion between the positively charged adsorbate and the biosorbent (Chakraborty, et al., 2011). Increasing the pH value increased the negative charge of adsorbent surfaces, causing the adsorbent attracted positively charged metal ions. In this study, the optimum pH for Fe(II) adsorption onto SB and ACSB was observed at pH 4. This is due to the domination of Fe(II) in aqueous solution at pH below ≈ 4 (Morgan and Lahav, 2007), and it could be due to the formation of soluble hydroxylated complexes of the metal ions and their ionized nature (Zhang et al., 2014). At the pH > 4, the Fe(II) became less stable in the solution because Fe(II) converted to its hydroxide forms (FeOH+ and Fe(OH)2) and got precipitated. Therefore, the adsorption capacity decreased after attaining the maximum adsorption limit at pH 4. This was consistent with the report by Arivoli et al. (2013), which concluded that pH 3-6.5 was suitable for Fe(II) adsorption on activated carbon from Strychnos Nux-Vomica L.
The contact time is one of the important factors that influence the adsorption process. In the experiments, the results showed that the adsorption capacity increased with the increase of contact time. The initial rate was fast and gradually decreased with time until equilibrium. The rate of adsorption was higher at the initial stage. This may be due to the large number of vacant sites available for adsorption (Al-Rashed and Al-Gaid, 2012). Moreover, the rate of adsorption was rapid due to the Fe(II) adsorption onto the exterior surface (Gupta and Rastogi, 2009) of the adsorbent, then the Fe(II) entered into pores (interior surface), a relatively slow process. The slower adsorption rate at the end was due to the saturation of binding sites on adsorbent and attainment of equilibrium (Chowdhury et al., 2011). Similar observations were reported by Arivoli et al. (2013) and Zhang et al. (2014).
The effect of initial Fe(II) concentration on the adsorption was studied. The results showed that the adsorption capacity increased with increasing initial Fe(II) concentration. This might be due to the high concentration provided the driving force to overcome mass transfer resistances of adsorbate between the aqueous and solid phase (Chowdhury et al., 2011). However, at the concentration ≥ 100 mg/L Fe(II), the increase of qe was lower because the adsorbent had a limited number of active sites. Next, the adsorbent was saturated at a certain concentration. The increase in initial concentration was also enhancing the interaction between adsorbent and Fe(II). Thus, it can be concluded that the Fe(II) adsorption process on SB and ACSB was favored at higher initial concentration. Similar observations were reported by Dahlan et al. (2013) and Zhang et al. (2014). From the results, the adsorption capacity of Fe(II) onto ACSB was higher than SB because ACSB had higher surface area and pore volume.
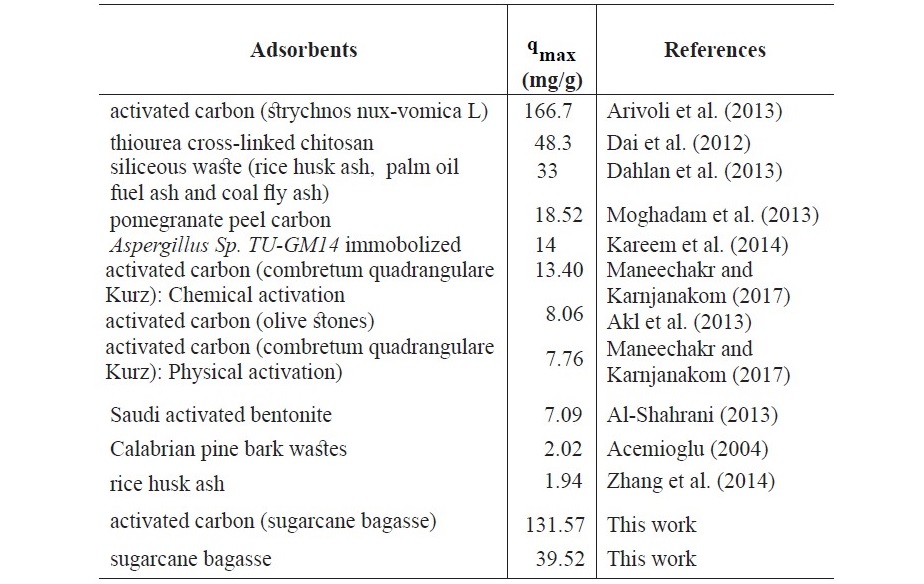
The linear adsorption isotherm of Fe(II) adsorption was evaluated from the equilibrium data according to the effect of concentration. The equilibrium adsorption results showed that the experimental data were the best fitted to the Langmuir isotherm, suggesting the monolayer adsorption process. The maximum monolayer adsorption capacity (qmax) values were 39.52 mg/g and 131.57 mg/g for maxSB and ACSB, respectively. The (qmax) value of 131.57 mg/g described the higher adsorption capacity of ACSB, which was directly related to higher surface area and the pore volume. Similar observations were reported by Arivoli et al (2013) and Dahlan et al. (2013). For favorable adsorption, the value of RL was in the range of 0 and 1. Therefore, the Fe(II) adsorption on SB and ACSB was favorable adsorption process because the RL values obtained from the experiments were in the range of 0.109-0.045 and 0.647-0.268, respectively. The maximum adsorption capacity (qmax) values of different adsorbents for Fe(II) adsorption were shown in Table 6.
Table 6. Comparison of qmax for Fe(II) adsorption on different adsorbents.
For the Freundlich isotherm, the constant KF values obtained were 19.349 and 4.432 for SB and ACSB. Also, the 1/n values were 0.114 and 0.587 for SB and ACSB, indicating that the Fe(II) adsorption on SB and ACSB was favorable (Hameed et al., 2008). According to the results, the values of 1/n < 1 indicated that the adsorption was physical, and that the experimental data fitted preferentially the Langmuir isotherm (Cazetta et al.,2011)
For the Dubinin-Radushkevich isotherm, the values of R2 were lower than that of Langmuir and Freundlich isotherm. The qo values were found to be 17.66 and 28.51 mg/g for SB and ACSB, respectively. If the mean adsorption energy (E) is between 8 to 16 kJ/mol, the adsorption process proceed via chemisorption, while for values of E < 8 kJ/mol the adsorption is a physisorption process (Chowdhury et al., 2011). In this study, the calculated E values were 0.070 and 0.075 kJ/mol of the Fe(II) adsorption on SB and ACSB, respectively. Therefore, the adsorption of Fe(II) was physical in nature.
The kinetic parameters, which are helpful for the prediction of adsorption rate, give the important information on designing and modeling the adsorption processes (Santhi et al., 2010b; Sartape et al., 2017). The values of correlation coefficient (R2) of pseudo-second order (0.999, 0.999) were higher than pseudo- first order (0.947, 0.946) for two adsorbents. Therefore, the adsorption of Fe(II) was best described by pseudo-second order model, involving valency forces through sharing or the exchange of electrons between adsorbent and adsorbate (Alzaydien, 2009). The equilibrium adsorption capacities calculated from pseudo-second-order (qe, cal) were 29.32 and 47.61 mg/g for SB and ACSB, respectively. These calculated qe values were in better agreement with the experimental qe values (28.63 and 46.84 mg/g for SB and ACSB). The initial adsorption rate (h) can be calculated from Eq. (9) and it was found that the initial rate of adsorption by ACSB was faster than by SB. This was due to ACSB had more surface area and pore volume than SB. For intraparticle diffusion, the plot between qe versus t1/2 showed three linear steps. The first step was attributed to the diffusion of Fe(II) through the solution to external surface of adsorbent. The second step explained the gradual adsorption stage where the intraparticle diffusion was the rate limiting. The third step was attributed to the final equilibrium stage. The values of correlation coefficient (R2) obtained from the plots of intraparticle diffusion (0.993, 0.993) were lower than that of pseudo-second-order model (Table 4), but this indicated that the adsorption may be followed by an intraparticle diffusion model up to equilibrium time. The result showed that the intraparticle diffusion (the second step) line did not pass through the origin suggesting that the intraparticle diffusion was not the only rate controlling step (Crini et al., 2007; Alzaydien, 2009), but the boundary layer resistance may control the Fe(II) sorption process (Elkady et al., 2016). Therefore, the adsorption may controlled by both film diffusion and intraparticle diffusion. The similar observation was reported that the adsorption of Pb(II) on montmorillonites-illite type clay (MIC) (Kenedy Oubagaranadin and Murphy, 2009). In addition, the Kid value of ACSB was higher than SB, indicating that the diffusion rate of Fe(II) into the pores of ACSB was faster than that of SB which was due to the higher surface area and pore volume of ACSB.
The thermodynamic parameters for Fe(II) adsorption at initial Fe(II) concentration 100 mg/L were evaluated at 20, 30, and 40oC. For the increasing of temperature from 20 to 40oC, the results showed that the adsorption capacity increased from 18.896 to 68.840 mg/g for SB and from 37.835 to 60.771 mg/g for ACSB. It was found that the adsorption capacity increased with increasing temperature, suggesting that the adsorption was endothermic process. At higher temperature, it was more effective collision between adsorbate molecules and active sites, so the favorable adsorption preferably occurred. For the thermodynamic parameters, the free energy change (ΔG) of Fe(II) adsorption at temperature of 20, 30, and 40oC were 2.9, 0.60, -1.99 and 1.21, 0.30, -1.10 kJ/mol for SB and ACSB, respectively. The negative value of ΔG indicated that the adsorption was spontaneous at higher temperature. Generally, the Gibbs free energy changes into physical and chemical adsorption in the range of 0.0 to -20 kJ/mol and -80 to -400 kJ/mol, respectively. Therefore, by considering the range of ΔG values obtained in this study, the adsorption process was physisorption. In addition, as ΔG° value was negative when the temperature increased to 40oC, it can be concluded that the adsorption was dominated by physisorption (Almeida et al., 2009). Moreover, the enthalpy change (ΔH) was 82.49 and 38.84 kJ/mol and the entropy change (ΔS) was 270.473 and 127.66 J/mol.K for the Fe(II) adsorption on SB and ACSB, respectively. The positive values of ΔH indicated that the adsorption was endothermic and suggested that a large amount of heat was consumed to transfer the Fe(II) from aqueous solution to the solid phase. The transition metal ions had to give up a large share of their hydration water before they could enter the smaller cavities (Nunes and Airoldi, 1999). The positive value of ΔS suggested the increasing randomness at the solid/liquid interface during the adsorption process. From all this results, it could be concluded that the adsorption of Fe(II) was more influenced by the change in solution temperature. Similar observation was reported by Aldawsari et al (2017).
CONCLUSION
In this study, sugarcane bagasse (SB) and activated carbon (ACSB) prepared from sugarcane bagasse were used as adsorbents for Fe(II) removal. Maximum adsorption was observed at pH 4 and at the equilibrium time― 60 min for SB and 90 min for ACSB. The equilibrium adsorption data indicated that the adsorption process followed the Langmuir isotherm. The kinetic adsorption data were fitted well with pseudo-second-order and intraparticle diffusion models. The thermodynamic parameters showed that the adsorption was spontaneous, endothermic, and physical in nature. This study demonstrated that the SB and ACSB were efficient biosorbents for the treatment of Fe(II) containing aqueous solution, and the adsorption capacity on ACSB was more than on SB.
ACKNOWLEDGMENT
The authors would like to thank Thepsatri Rajabhat University for the financial support.
REFERENCES
Acemioglu, B. 2004. Removal of Fe(II) ions from aqueous solution by Calabrian pine bark wastes. Bioresource Technology. 93: 99–102. https://doi. org/10.1016/j.biortech.2003.10.010
Aldawsari, A., Khan, M.A., Hameed, B.H., Alqadami, A.A., Siddiqui, M.R., Alothman, Z.A., and Ahmed, A.Y.B.H. 2017. Mercerized mesoporous date pit activated carbon-A novel adsorbent to sequester potentially toxic divalent heavy metals from water. PLoS One. 12(9): e0184493. https://doi.org/ 10.1371/journal.pone.0184493
Almeida, C.A.P., Debacher, N.A., Downs, A.J., Cotte, L., and Mello, C.A.D. 2009. Removal of methylene blue from colored effluents by adsorption on montmorillonite clay. Journal of Colloid and Interface Science. 332: 46–53. https://doi.org/10.1016/j.jcis.2008.12.012
Al–Rashed, S.M., and Al–Gaid, A.A. 2012. Kinetic and thermodynamic studies on the adsorption behavior of Rhodamine B dye on Duolite C–20 resin. Journal of Saudi Chemical Society. 16: 209–215. https://doi.org/10.1016/j.jscs.2011. 01.002
Al-Shahrani, S.S. 2013. Treatment of wastewater contaminated with Fe(II) by adsorption onto Saudi activated bentonite. International Journal of Engineering & Technology. 13(06): 1–12.
Alzaydien, A.S. 2009. Adsorption of methylene blue from aqueous solution onto a low–cost natural Jordanian tripoli. American Journal of Environmental Sciences. 5(3): 197–208.
Akl, M.A., Yousef, A.M., and AbdElnasser, S. 2013. Removal of iron and manganese in water samples using activated carbon derived from local agro–residues. Chemical Engineering & Process Technology. 4(4): 1–10. https://doi.org/10.4172/2157-7048.1000154
Arivoli, A., Marimuthu, V., and Jahangir, A.R.M. 2013. Kinetics of batch adsorption of iron (II) ions from aqueous solution using activated carbon from Strychnos Nux–Vomica L. International Journal of Scientific & Engineering Research. 4(12): 407–417.
Bodirlau, R., Teaca, C.A., and Spiridon, I. 2008. Chemical modification of beech wood: Effect on Thermal Stability. BioResources. 3(3): 789–800. Cazetta, A.L., Vargas, A.M.M., Nogami, E.M., Kunita, M.H., Guilherme, M.R., Martins, A.C., Silva, T.L., Moraes, J.C.G., and Almeida, V.C. 2011. NaOH– activated carbon of high surface area produced from coconut shell: Kinetics
and equilibrium studies from the methylene blue adsorption. Chemical EngineeringJournal.174:117-125.https://doi.org/10.1016/j.cej.2011.08.058 Chakraborty, S., Chowdhury, S., and Saha, P.D. 2011. Adsorption of crystal violet from aqueous solution onto NaOH–modified rice husk. Carbohydrate Polymers. 86(4): 1533–1541. https://doi.org/10.1016/j.carbpol.2011.06.058 Chowdhury, S., Mishra, R., Saha, P., and Kushwaha, P. 2011. Adsorption thermodynamics, kinetics and isosteric heat of adsorption of malachite green onto chemically modified rice husk. Desalination. 265: 159–168. https://doi.org/10.1016/j.desal.2010.07.047
Crini, G., Peindy, H.N., Gimbert, F., and Robert, C. 2007. Removal of C.I. Basic Green 4 (Malachite Green) from aqueous solutions by adsorption using cyclodextrin–based adsorbent: Kinetic and equilibrium studies. Separation and Purification Technology. 53: 97–110. https://doi.org/10.1016/j.seppur.2006.06.018
Dahlan, I., Hassan, S.R., and Hakim, M.L. 2013. Removal of iron (Fe2+) from aqueous solutions using siliceous waste sorbent. Sustainable Environment Research. 23(1): 41–48.
Dai, J., Ren, F., and Tao, C. 2012. Adsorption behavior of Fe(II) and Fe(III) ions on Thiourea cross–linked chitosan with Fe(III) as template. Molecules. 17: 4388–4399. https://doi.org/10.3390/molecules17044388
Elhussien, M.H. 2015. Removal of iron(II) from aqueous solution using activated carbon derived from pods of Acacia nilotica var astringens (Sunt tree) by chemical activation with ZnCl2. International Journal of Emerging Technology and Advanced Engineering. 5(10): 298–307.
Elkady, M.F., El–Aassar, M.R., and Hassan, H.S. 2016. Adsorption profile of basic dye onto novel fabricated carboxylated functionalized co–polymer nanofibers. Polymers. 8(5): 177: 1–13. https://doi.org/10.3390/polym8050177
Gupta, V.K., and Rastogi, A. 2009. Biosorption of hexavalent chromium by raw and acid-treated green alga Oedogonium hatei from aqueous solutions. Journal of Hazardous Materials. 163: 396-402. https://doi.org/10.1016/ j.jhazmat.2008.06.104
Hamdouni, A., Montes-Hernandez, G., Tlili, M., Findling, N., Renard, F., and Putnis, C.V. 2016. Removal of Fe(II) from groundwater via aqueous portlandite carbonation and calcite-solutio interactions. Chemical Engineering Journal. 283: 404–411. https://doi.org/10.1016/j.cej.2015.07.077
Hameed, B.H., Mahmoud, D.K., and Ahmad, A.L. 2008. Equilibrium modeling and kinetic studies on the adsorption of basic dye by a low–cost adsorbent: Coconut (Cocos nucifera) bunch waste. Journal of Hazardous Materials. 158: 65–72. https://doi.org/10.1016/j.jhazmat.2008.01.034
Homagai, P.L., Ghimire, K.N., and Inoue, K. 2010. Adsorption behavior of heavy metals onto chemically modified sugarcane bagasse. Bioresource Technology. 101: 2067–2069. https://doi.org/10.1016/j.biortech.2009.11.073
Jusoh, A.B., Cheng, W.H., Low, W.M., Nora’aini, A., and Noor, M.J. 2005. Study on the removal of iron and manganese in groundwater by granular activated carbon. Desalination. 182: 347–353. https://doi.org/10.1016/j.desal.2005.03.022
Kul, A.R., and Koyuncu, H. 2010. Adsorption of Pb(II) ions from aqueous solution by native and activated bentonite: Kinetic, equilibrium and thermodynamic study. Journal of Hazardous Materials. 179: 332–339. https://doi.org/10.1016/j.jhazmat.2010.03.009
Kareem, S.O., Omeike S.O., Adewuyi S., and Balogun S.A. 2014. Removal of Mn(II) and Fe(II) by Aspergillus Sp. TU–GM14 mmobilized on Detarium Microcarpum matrix. Global NEST Journal. 16(4): 597–608. https://doi.org/10.30955/gnj.001239
Kenedy Oubagaranadin, J.U., and Murphy Z.V.P., 2009. Adsorption of divalent lead on a montmorillonite-illite type of clay. Industrial & Engineering Chemistry Research. 48: 10627–10636. https://doi.org/10.1021/ie9005047 Maneechakr, P., and Karnjanakom, S. 2017. Adsorption behaviour of Fe(II) and Cr(VI) on activated carbon: Surface chemistry, isotherm, kinetic and thermodynamic studies. Journal of Chemical Thermodynamics. 106:104–112. https://doi.org/10.1016/j.jct.2016.11.021
Martins, A., and Nunes, N. 2015. Adsorption of a textile dye on commercial activated carbon: A simple experiment to explore the role of surface chemistry and ionic strength. Journal of Chemical Education. 92: 143–147. https://doi.org/10.1021/ed500055v
Moghadam, M.R.., Nasirizadeh, N., Dashti, Z., and Babanezhad, E. 2013. Removal of Fe(II) from aqueous solution using pomegranate peel carbon: equilibrium and kinetic studies. International Journal of Industrial Chemistry. 4(19): 1–6. https://doi.org/10.1186/2228-5547-4-19
Morgan, B., and Lahav, O. 2007. The effect of pH on the kinetics of spontaneous Fe(II) oxidation by O2 in aqueous solution–basic principlesand a simple heuristic description. Chemosphere. 68(11): 2080–2084. https://doi.org/10.1016/j.chemosphere.2007.02.015
Moustafa, M.E., Shama, S.A., Zein el–abeden, D., and Kabeil, A.R. 2015. Removal of Zn(II), Fe(II) and Mn(II) from industrial wastewater by using active carbon prepared from mango seed as adsorbent. Journal of Basic and Environmental Sciences. 2: 1–8.
Nunes, L.M., and Airoldi, C. 1999. Some features of crystalline α-titanium hydrogenphosphate, modified sodium and n-butylammonium forms and thermodynamics of ionic exchange with K+ and Ca2+. Thermochimica Acta. 328: 297–305. https://doi.org/10.1016/S0040-6031(98)00654-6
Romero-Guzman, E.T., Reyes-Gutierrez, L.R., Marin-Allende, M.J., Gonzalez- Acevedo, Z.J., and Olguin-Gutierez, M.T. 2013. Physicochemical properties of non-living water hyacinth (Eichhornia crassipes) and lesser duckweed (Lemna minor) and their influence on the As(V) adsorption processes. Chemistry and Ecology. 29: 459-475. https://doi.org/10.1080/02757540.2013.772589
Santhi, T., Manonmani, S., and Smitha, T. 2010b. Kinetics and isotherm studies on cationic dyes adsorption onto Annona squmosa seed activated carbon. International Journal of Engineering, Science and Technology. 2(3): 287–295.
Sartape, A.S., Mandhare, A.M., Jadhav, V.V., Raut, P.D., Anuse, M.A., and Kolekar, S.S. 2017. Removal of malachite green dye from aqueous solution with adsorption technique using Limonia acidissima (wood apple) shell as low cost adsorbent. Arabian Journal of Chemistry. 10: S3229–S3238. https://doi.org/10.1016/j.arabjc.2013.12.019
Srivastava, V.C., Mall, I.D., and Mishra, I.M. 2009. Competitive adsorption of cadmium(II) and nickel(II) metal ion from aqueous solution onto rice husk ash. Chemical Engineering and Processing. 48: 370–379. https://doi.org/10.1016/j.cep.2008.05.001
Sharma, P., and Kaur, H. 2011. Sugarcane bagasse for the removal of erythrosin B and methylene blue from aqueous waste. Applied Water Science. 1: 135–145. https://doi.org/10.1007/s13201-011-0018-x
Sun, D., Sun, X.F., Zhao, H., and Sun, R.C. 2004. Isolation and characterization of cellulose from sugarcane bagasse. Polymer Degradation and Stability. 84: 331–339. https://doi.org/10.1016/j.polymdegradstab.2004.02.008
Sun, J.X., Zhang, Z., Wang, M., and Wu, Y. 2013. Adsorption of reactive dyes on activated carbon developed from enteromorpha prolifera. American Journal of Analytical Chemistry. 4: 17–26. https://doi.org/10.4236/ajac. 2013.47A003
Tajernia, H., Ebadi, T., Nasernejad, B., and Ghafori, M. 2014. Arsenic removal from water by sugarcane bagasse: an application of Response Surface Methodology (RSM).Water Air and Soil Pollution. 225: 2028.
Xu, T., and Liu, X, P. 2008. Peanut shell activated carbon: characterization, surface modification and adsorption of Pb2+ from aqueous solution. Chinese Journal of Chemical Engineering. 16(3): 401–406. https://doi.org/ 10.1016/S1004-9541(08)60096-8
Yakout, S.M., and Sharaf El-Deen, G. 2016. Characterization of activated carbon prepared by phosphoric acid activation of olive stones. Arabian Journal of Chemistry. 9: S1155–S1162. https://doi.org/10.1016/j.arabjc.2011.12.002 Zhang, Y., Zhao, J., Jiang, Z., Shan, D., and Lu, Y. 2014. Biosorption of Fe(II) and Mn(II) Ions from aqueous solution by rice husk ash. BioMed Research International. 2014: Article ID 973095. https://doi.org/10.1155/2014/973095
Zhao, D., Yang, X., Zhang, H., Chen, C., and Wang, X. 2010. Effect of environmental conditions on Pb(II) adsorption on β-MnO2. Chemical Engineering Journal. 164: 49-55. https://doi.org/10.1016/j.cej.2010.08.014
Suchada Sawasdee and Prachart Watcharabundit*
Department of Chemistry, Faculty of Science and Technology, Thepsatri Rajabhat University, Lopburi 15000 Thailand
*Corresponding author. E-mail: prachartw@hotmail.com
Total Article Views
Article history:
Received: July 16, 2018;
Revised: October 24, 2018;
Accepted: November 1, 2018