 ISSN: 2822-0838 Online

Effects of Plasma Treatment on Chemical and Physical Properties of Pigmented Rice Flour
Sirintat Liamlaem, Srisuwan Naruenartwongsakul and Pilairuk Intipunya*Published Date : 2022-10-18
DOI : https://doi.org/10.12982/CMUJNS.2022.059
Journal Issues : Number 4, October-December 2022
Abstract The objective of this research was to study the effects of plasma treatment at different power levels (100, 120, and 140 W) and exposure times (5, 10, and 15 min) on the physical and chemical properties of pigmented rice flours from Kum Doi Saket cultivar. An increase in plasma power and exposure time resulted in decreases of moisture contents, solubility, and swelling power of the rice flour, while the resistant starch content was increased. The amylose content tended to decrease when plasma power and exposure time was increased. In this study, plasma treatment at 140 W for 10 min maintained the highest anthocyanin content in Kum Doi Saket rice flour (68.35 – 98.63 mg/100 g). Pasting property analysis by RVA revealed decreases in peak viscosity, breakdown and setback viscosities. The pasting temperature of Kum Doi Saket rice flour was significantly decreased (P ≤0.05) after plasma treatment. Plasma treatment did not affect the onset temperature (To) and ΔH of starch gelatinization as analyzed by a DSC, while peak temperature (Tp) and end set temperature (Te) of flour sample were increased (P ≤0.05). Plasma effects on size, shape and surface roughness of flours were observed by SEM. Higher plasma power and treatment time caused more micro-pores on the surface of flour particles, especially after being treated at 140 W for 15 min.
Keywords: Pigmented rice flour, Cold plasma technology, Flour properties, Cross-linking
Funding: The authors are grateful for the research fundings provided by the National Research Council of Thailand (NRCT), the Graduate School of Chiang Mai University (TA/RA scholarship), and the Faculty of Agro-Industry, Chiang Mai University (RA scholars).
Citation: Liamlaem, S., Naruenartwongsakul, S., and Intipunya, P. 2022. Effects of plasma treatment on chemical and physical properties of pigmented rice flour. CMUJ. Nat. Sci. 21(4): e2022059.
INTRODUCTION
Plasma is the fourth state of matter, which is partially or fully ionized state (Thirumdas et al., 2016). Plasma generation is classified into two types: (1) generation at high temperature and (2) generation at low temperature. Since high temperature causes negative effects on the nutritional quality of thermally-sensitive foods, it may not be suitable to be applied in food industries. On the other hand, plasma generation under low temperature or recognized as cold plasma may be better applicable for food production. Cold plasma has a great potential to be used in food industry because it can cause changes in physicochemical properties leading to a wide range of beneficial effects such as an improvement of the shelf life of food due to microbial safety, a decrease in processing time for cooking rice due to an increasing absorption of water during soaking, starch modification leading to changes in solubility, water absorption, swelling power, gelatinization temperature, alteration of the hydrophilic/hydrophobic properties and suppression of enzyme (Misra et al., 2011; Thirumdas et al., 2015; Pal et al., 2016). These changes include the formation of polymeric chains to a network called crosslinking, a decrease of molecular weight through the mechanism of depolymerization, and the polymerization of monomers (Thirumdas et al., 2016).
Pigmented rice (Oryza sativa L.) is one of the local rice varieties, which has been widely consumed in Thailand for a long time. The major apparent difference between pigmented and non-pigmented rice is their colors. Pigmented rice contains higher content of anthocyanin pigment in the bran layer of the grain (Hayashi and Yanase, 2016). Their cultivars can be divided into two groups: glutinous rice and non-glutinous rice. It is widely known that the major difference of two pigmented rice varieties is the ratio of amylose and amylopectin contents. The glutinous pigmented rice contains lower content of amylose than the non-glutinous pigmented rice (Sriroth and Piyajomkwan, 2007). Kum Doi Saket, a variety of pigmented rice widely cultivated in Northern of Thailand, is generally consumed as cooked rice and used as a main ingredient in desserts (Summart and Chewonarin, 2014). Several research found that it contained 2 -3 times of gamma oryzanol and anthocyanin higher than white rice (Zu et al., 2007) Rice flour is flavor-retainable, non-allergenic and tasteless, which make it being useful for value addition to products and use as the important ingredient in many food products i.e. puffed rice, noodle, low fat sauce, salad dressing and food additive in meat products (Blase, 2020). However, there are few limitations involved in the applications of native rice starch and flour, for instance, low solubility in cold temperatures, high viscosity in food systems and the tendency of retrogradation (Sarangpani et al., 2016). To overcome such limitations, a native flour and starch can be modified by various processing methods including enzymatic, physical, and chemical processes (Thirumdas et al., 2016). Among these processes, chemical modification is the major process that is commonly applied in the production of modified starch. However, their drawbacks should be considered as the first priority. Using this method may lead to accumulation of chemical residues or perhaps some toxic substances may also be found in starch-modified food products. At present, plasma technology is one of the interesting alternative methods that can modify starch. It is categorized as physical processes, which are chemical-free, non-toxic, and environmentally-friendly (Thirumdas et al., 2017; Okyere et al., 2022).
The previous research reported that the plasma power, time and type of gas were the factors that affected the properties of modified starch (Thirumdas et al., 2015, Thirumdas et al., 2016, Thirumdas et al., 2017, Sarangapani et al, 2015 and Pal et al., 2016). Therefore, this research was aimed to study the modification of pigmented rice flour using plasma technology. Research focus was on the effect of plasma power and exposure time on physical and chemical properties of the rice flour, as well as to investigate the optimum condition for the flour modification, by choosing argon as the gas for plasma generation.
MATERIALS AND METHODS
Materials
Pigmented rice, Kum Doi Saket cultivar (Oryza sativa L.), was purchased from a local rice miller in Chiang Mai province, Thailand. The rice grains were dehulled and then grounded to obtain rice flour. The flour sample was sieved through 100 mesh sieve to obtained uniform particle size. Untreated rice flour sample was used as the control sample.
Plasma treatment
A pigment rice flour sample (5 g) was placed in the holes of an aluminum sheet (230 x 330 x 5 mm) with 9 rows of 10 holes each. The sample hole was 12 x 18.5 x 3 mm in size and the space between each hole was 7.5 mm. The sample was placed in alternate holes in every row. The electrodes were set 1 mm apart from each other in all the experiments and exposure to plasma using dielectric-barrier discharge (DBD) (PMU 330, Plasmart Inc., Korea). The gases used for plasma generation was argon. The frequency was maintained constant at 13.56 MHz and the plasma gas flow rate was controlled at 8 L/min. DBD plasma unit consisting of the electrical discharge between two electrodes which was separated by an insulating dielectric barrier, was used in this experiment. The rice samples were subjected to treatment at three power levels (100, 120, and 140 W) and treatment times of 5, 10 and 15 min. The experiment was conducted in 3 x 3 factorial design with 3 replications. Untreated rice sample were used as the control samples. Plasma treated sample was vacuum sealed in aluminum foil bags and stored in a refrigerator for further analysis.
Analysis of chemical properties of pigmented rice flours
Moisture content
The determination of moisture content of the pigmented rice flour was conducted according to the method described by AOAC (2000). A moisture can was dried in a hot air oven (ULM-500, Memmert, USA) at 105°C for 3 hours. After being cooled in a desiccator, its weight was recorded. Flours (2 g) was put into the dried moisture can, then placed into a hot air oven 105°C for 6 hours until the weight was constant. The weights of fresh and dried samples were used to calculate the moisture content (% wet basis) by the following equation:
![]()
when A and B are the samples’ weight after and before drying (g), respectively.
Amylose content
Determination of amylose content was conducted according to the Iodometric method described by AOAC (2000). The samples (100 mg) were added with 95% ethanol (1 mL) and 1 N NaOH (9 mL). After that iodine solution was added, the mixture was incubated at room temperature for 10 min. The absorbance at 625 nm was measured using a UV-vis spectrophotometer (Genesys 10 UV-Vis, Thermo Electron, USA) and then the amylose content was calculated from the standard curve.
Resistant starch content
The determination of resistant starch content was carried out using the megazyme kit (Megazyme International Ireland Ltd., Bray, Ireland). Briefly, the digestion was conducted by mixing flour samples (100 mg) with 4 mL of pancreatic alpha amylase (10 mg/mL containing 300 U/mL of amyloglucosidase) and shaked at 200 strokes/min for 16 h while maintaining the temperature at 37°C. Ethanol (4 mL) was added into the mixture and vigorously stirred, followed by centrifugation at 1,500g for 10 min using a Z206A centrifuge (Hermle Labortechik GmbH, Germany). The sediment was separated and mixed with 50% ethanol and centrifuged under the same condition. Then, the sediment was added with 2 M KOH (2 mL) and stirred on an ice bath for 20 min, followed by addition of 1.2 M sodium acetate buffer (8 mL) and amyloglucosidase 3,300 U/ml (0.1 mL). After shaking and incubating at 50°C for 30 min, the mixture was centrifuged. The supernatant (0.1 mL) was added with GOPOD reagent (3 mL) and incubated at 50°C for 20 min. The absorbance of the sample was measured at 510 nm wavelength using a UV-vis spectrophotometer (Genesys 10 UV-Vis, Thermo Electron, USA). The percentage of resistant starch (RS) was calculated using equation (1) (McCleary and Monaghan, 2002).
![]()
when ΔE is absorbance of the sample read against the reagent blank; F is conversion factor from absorbance of sample in microgram; and W is the dry weight of the sample used for analysis.
Anthocyanins content
The pigmented rice flour (1 g) was extracted with 0.5% trifluoroacetic acid (TFA) in 95% ethanol solution (10 mL) under continuous shaking in water bath shaker at room temperature (30°C) for 60 min. The extract was filtered by Whatman filter paper No. 4 and re-filtered with 0.45 μL syringe filter. The quantification of cyanidin-3-O-glucoside (C3G) and peonidin-3-glucoside (P3G) in the flour extracts was carried out according to the method described by Laokuldilok et al. (2011), with slight modification as follows. The aliquot of the flour extract filtered through 0.45 μL syringe was injected to a high performance liquid chromatography (HPLC). The HPLC quaternary pumps and column were connected with a diode array type of UV/vis detector (Shimadzu, Bara Scientific Co., Ltd, Japan). C3G and P3G were separated on a C18 column (4.6 mm×250 mm, reversed phase octadecyl-silica (OSD) column). TFA (0.1%) in water was used as mobile phase A and then changed to 0.1% TFA in methanol as mobile phase B with elution flow rate of 1 mL/min. The Diode Array Detector (DAD) was set at 280 nm, and the sample loop was 20 μL. The authentic standards were used to identify and quantify the separated anthocyanin from the samples via external standard calibration.
Analysis of physical properties of pigmented rice flours
Solubility
Solubility of the rice flour samples was determined according to the method described by Kusumayanti et al. (2015). The flour sample (0.5 g) was added with distilled water (10 mL) and then heated at 60°C for 30 min without mixing. The sample was centrifuged at 287g for 10 min. The supernatant (5 mL) was collected and then dried. The weight of the soluble fraction was used to determine the solubility using equation (2).
![]()
Swelling Power
Swelling index was determined according to the method described by Kusumayanti et al. (2015). The samples (0.1 g) were added with distilled water (10 mL) and then heated at 60°C for 30 min with constant mixing. The sample was centrifuged at 287g for 15 min. The precipitated part was collected. The weight of that part was used to calculate the swelling index using equation (3).
![]()
when TC is total carbohydrates in solution.
Thermal properties
Thermal properties of the rice flour were analyzed in terms of starch gelatinization temperatures and enthalpy (ΔH) using a differential scanning calorimeter (DSC1; Mettler-Toledo, Schwerzenbach, Switzerland). The samples (3 mg) was mixed with water (6 mg) and sealed in an aluminum pan and allowed to stand at 4°C for 24 h. An empty aluminum pan was used as a reference. The thermal curve was obtained from temperature of 25 to 100°C with a heating rate of 5°C/min. Thermal transitions were reported in terms of onset temperature (To), peak temperature (Tp) and end set temperature (Te). The gelatinization enthalpy (ΔH) was calculated from the area under the peak, and expressed in J/g of dry flour.
Pasting properties
Pasting properties of 12% (w/w) flour slurry was determined using a Rapid Visco Analyzer (RVA-3D; Newport Scientific, Narrabeen, Australia) at paddle rotation speed of 287g. A starting temperature was set at 40°C and heated to 92.5°C at the rate of 3°C/min. The slurry was maintained at 92.5°C for 15 min before cooled down to 40°C at the same rate. Various pasting properties were obtained from viscosity-temperature profile. Peak viscosity, breakdown, final viscosity, setback as well as pasting temperature were evaluated from the pasting profile. The setback and breakdown were calculated by using the equation (5) and (6) respectively.
Setback = Final viscosity − Holding strength (5)
Breakdown = Peak viscosity- Holding strength. (6)
All samples were analyzed in triplicates.
Surface morphology
The surface morphology of the pigmented rice flour was evaluated using a scanning electron microscope (SEM) (JSM-5200, JEOL, Japan). The flour was mounted on the SEM stubs using double-sided adhesive carbon tape. The mounted flour was coated with a thin gold layer. The SEM of all samples was operated at 15 kV with a magnification of ×1,000. SEM image was collected and analyzed.
Statistical Analysis
The experiment was carried out using a factorial experiment in complete randomized design. Measurements were conducted in triplicates. All data were analyzed and compared using ANOVA by SPSS Statistics 17.0 software. Differences among average values were determined by Duncan's new multiple range test (DMRT) at P ≤0.05. Factorial ANOVA was used to explore the effect of each factor and their interaction (plasma power 100, 120, 140 W and exposure time 5, 10, 15 min).
RESULTS
Effects of plasma treatment on chemical properties of pigmented rice flour
Chemical properties in terms of moisture content, amylose content, resistance starch content and anthocyanin (cyanidin-3-O-glucoside and peonidin-3-O-glucoside) of the control sample and plasma treated Kum Doi Saket rice flour are presented in Table 1. Moisture contents the flour samples were significantly reduced after plasma treatment (P ≤0.05). Increasing plasma power and treatment time significantly reduced the moisture content of the flour sample (P ≤0.05). The moisture content of control sample was 11.45 ± 0.04%, and plasma treatment caused the moisture content being reduced of the ratio of 11.21 ± 0.11% - 9.54 ± 0.08. The lowest value was obtained after being exposed to plasma at 140 W for 15 min.
Table 1. Chemical properties of Kum Doi Saket rice flour.
|
Plasma Power (W) |
Exposure Time (min) |
Moisture content (%) |
Amylose content (%) ns |
Resistance starch content (%) |
Cyanidin-3-O-glucoside (mg/100 g) |
Peonidin-3-O-glucoside (mg/100 g) |
|
||
|
Control sample |
11.45 ± 0.04 a |
5.93 ± 0.79 |
8.21± 0.52 d |
40.99 ± 0.49 e |
26.83 ± 0.45 f |
|
|||
|
100 |
5 10 15 |
11.21 ± 0.11 b 10.50 ± 0.03 d 9.93 ± 0.04 f |
5.80 ± 0.11 5.79 ± 0.06 5.68 ± 0.12 |
8.21 ± 0.80 d 8.90 ± 0.43 cd 9.76 ± 0.24 bc |
41.39 ± 0.95 e 43.98 ± 0.16 d 45.05 ± 0.78 cd |
27.96 ± 0.54 ef 27.94 ± 0.88 e 29.00 ± 0.47 d |
|||
|
120 |
5 10 15 |
10.70 ± 0.11 c 10.14 ± 0.18 e 9.61 ± 0.04 g |
5.65 ± 0.22 5.54 ± 0.22 5.47 ± 0.23 |
9.27 ± 0.62 bc 10.17 ± 0.75 b 10.26 ± 0.74 b |
44.43 ± 0.18 d 45.65 ± 0.44 c 46.09 ± 0.67 c |
29.01 ± 0.45 d 29.48 ± 0.19 cd 30.29 ± 0.57 bc |
|||
|
140 |
5 10 15 |
10.58 ± 0.10 cd 10.11 ± 0.05 e 9.54 ± 0.08 g |
5.51 ± 0.12 5.44 ± 0.34 5.40 ± 0.38 |
12.29± 0.32 a 12.96 ± 0.31 a 10.04 ± 0.53 b |
42.26 ± 0.58 c 60.67 ± 0.85 a 48.71 ± 0.99 b |
30.77 ± 0.68 b 37.96 ± 0.53 a 31.10 ± 0.79 b |
|||
Note: Values presented in the table are means±standard deviations. Different superscripts in the same column show the statistical differences between the mean values at P ≤0.05. ns means that the mean values in the same column are not statistical different at P >0.05.
The amylose content of pigmented rice flours from Kum Doi Sake were in range of 5.40–5.82% (Table 1). Even though plasma power and exposure time did not show significant effect on the amylose content of the flour (P > 0.05), the amylose content tended to decrease slightly as compared to the control sample (5.93 %).
The resistance starch contents were in the range of 8.21–12.96% (8.21% for untreated sample). Increasing plasma power and exposure time resulted in significant increases of resistant starch content of the flour samples. At the highest plasma power in this study (140 W), resistant starch content slightly increased, except at 15 min exposure time when the resistant starch content was reduced (P ≤0.05). However, from all plasma treatment conditions, treatment at 100 W for 15 min and above resulted in significant increases (P ≤ 0.05) in the resistant starch contents when compared to that of the control sample. The highest resistant starch content was found at 12.96 ± 0.31% after plasma treatment with 140 W for 10 min.
Anthocyanin content was determined in the forms of cyanidin-3-O-glucoside (C3G) and peonidin-3-O-glucoside (P3G). C3G and P3G content of the flour were in the ranges of 41.39– 60.67 and 27.94–37.96 mg/100 g, respectively while those of untreated samples were 40.99 mg/100 g, respectively. Plasma treatments caused the anthocyanin contents to increase and had higher values than that of the control sample. Increasing plasma power and exposure time caused significant increases of C3G and P3G contents (P ≤0.05). Plasma treatment at higher power (140 W) and exposure time of 10 min yielded the flour with the highest anthocyanin contents of both C3G and P3G (C3G at 60.67 ± 0.85 mg/100 g; and P3G at 37.96 ± 0.53 mg/100 g) (P ≤0.05).
Effects of Plasma Treatment on Physical Properties of Pigmented Rice Flour
Solubility and swelling power of the pigmented rice flour are shown in Table 2. Solubility of the control sample was 11.71 ± 0.10%. After plasma treatment, the flour solubility significantly decreased (P ≤0.05). Solubility of the plasma treated samples was in the range of 6.23–10.65%. Increasing plasma power and exposure time significantly decreases the solubility (P ≤0.05). This result is related to an increase of the resistant starch content which is insoluble in water. Similarly, the swelling power of the rice flour was significantly decreased after the plasma treatment (P ≤0.05). Swelling power of the control sample was about 12.43 ± 0.47%. It was significantly decreased to 6.45–11.49% after plasma treatment.
Table 2. Physical properties of Kum Doi Saket rice flour.
|
Plasma Power (W) |
Exposure Time (min) |
Solubility (%) |
Swelling power (%) |
|
|
Control sample |
11.71 ±0.10 a |
12.43 ±0.47 a |
|
|
|
100 |
5 10 15 |
10.65 ±0.28 b 8.76 ±0.48 c 7.41 ±0.24 d |
11.49 ±0.46 b 9.43 ±0.39 c 9.28 ±0.19 c |
|
|
120 |
5 10 15 |
6.71 ±0.21 e 6.50 ±0.82 e 6.32 ±0.35 e |
8.52 ±0.36 d 8.33 ±0.51 de 7.71 ±0.61 ef |
|
|
140 |
5 10 15 |
6.30 ±0.28 e 6.25 ±0.41 e 6.23 ±0.25 e |
7.49 ±0.42 f 6.45 ±0.27 g 6.65 ±0.46 g |
|
Note: Values presented in the table are means±standard deviations. Different superscripts in the same column show the statistical differences between the mean values at P ≤0.05.
Thermal properties related to starch gelatinization are shown in Table 3. The onset temperature (To), peak temperature (Tp) and end set temperature (Te) of the plasma treated rice flour were 66.15-66.89, 70.88-72.96, and 75.31-76.62°C, respectively, while those of the control sample were 66.19, 70.82 and 75.17°C, respectively. To of starch gelatinization was not significantly affected by plasma treatment (P >0.05). Tp of plasma treated flour were not significantly different when treated at 100 and 120 W for 5-15 min and 140 W for 5 min (P >0.05), while increasing exposure time to 10 and 15 min at 140 W significantly increased Tp of the sample (P ≤.05). Te was similarly affected. Therefore, Tp and Te of the gelatinization were significantly increased when plasma power of 140 W and exposure time of 10 min and above were applied (P ≤0.05), whereas they did not significantly differ from those of the control sample, when the flour sample was treated at lower plasma power and time conditions. The enthalpy (ΔH) of starch gelatinization of all plasma treated flour samples were in the range of 1.06-1.21 J/g, while that of the control sample was 1.23 J/g. Plasma treatment did not significantly change the ΔH of the pigmented rice flour (P >0.05).
Table 3. Thermal properties related to gelatinization of Kum Doi Saket rice flour.
|
Plasma Power (W) |
Exposure Time (min) |
To ns (ºC) |
Tp (ºC) |
Te (ºC) |
DH ns (J/g) |
|
Control sample |
66.19 ± 0.09 |
70.82 ± 0.05 b |
75.17 ± 0.43 b |
1.23 ± 0.11 |
|
|
100 |
5 10 15 |
66.20 ± 0.12 66.39 ± 0.56 66.74 ± 0.93 |
70.88 ± 0.04 b 71.04 ± 0.29 b 71.07 ± 0.27 b |
75.79 ± 0.59 ab 75.51 ± 0.17 b 75.42 ± 0.09 b |
1.21 ± 0.05 1.10 ± 0.03 1.06 ± 0.06 |
|
120 |
5 10 15 |
66.29 ± 0.23 66.79 ± 0.91 66.89 ± 0.88 |
71.32 ± 0.65 b 71.17 ± 0.39 b 71.12 ± 0.08 b |
75.31 ± 0.07 b 75.37 ± 0.35 b 76.11 ± 0.72 ab |
1.07 ± 0.11 1.14 ± 0.04 1.19 ± 0.06 |
|
140 |
5 10 15 |
66.56 ± 0.17 66.86 ± 0.18 66.15 ± 0.83 |
71.25 ± 0.49 b 72.50 ± 0.55 a 72.96 ± 0.80 a |
75.53 ± 0.37 b 76.09 ± 0.25 ab 76.62 ± 0.91 a |
1.12 ± 0.21 1.13 ± 0.02 1.07 ± 0.05 |
Note: Values presented in the table are means + standard deviations. Different superscripts in the same column show the statistical differences between mean values at P ≤0.05. ns means that the mean values in the same column are not statistical different at P >0.05.
Pasting properties of the pigmented rice flour samples are present in Table 4. Pasting temperature was in the range of 47.58–48.25°C, while that of the control sample was 48.17°C. Increasing plasma power and exposure time slightly affect the pasting temperature. Plasma treatment at 140 W for 15 min significantly brought the pasting temperature to the lowest value of 47.58°C (P ≤0.05). Peak viscosity, breakdown, setback and final viscosities of pigmented rice flour samples ranged from 1331.33 to 1096.00 RVU, 1024.00 to 755.33, 44.00 to 19.00 RVU and 337.33 to 359.33 RVU, respectively; whereas the values for the control sample were 1346.67, 1066.00, 44.67 and 326.00 RVU, respectively. Peak viscosity, breakdown and setback values significantly decreased, whereas final viscosity significantly increased (P ≤0.05) when increasing power and exposure time during plasma treatment. The pasting temperatures were much lower than the gelatinization temperature due to higher moisture content in the flour pastes used for pasting property analysis.
Figure 1 shows SEM images of rice flour’s morphology of the control sample and plasma treated samples. The particle sizes of the flour samples were not uniform and the shapes were irregular. Their surfaces were not smooth. The control sample and plasma treated samples at 100 and 120 W had similar surface characteristics, while the samples treated at 140 W. Changes on the surface were observed by scanning electron microscope at a magnification of 10 µm (1,000X).
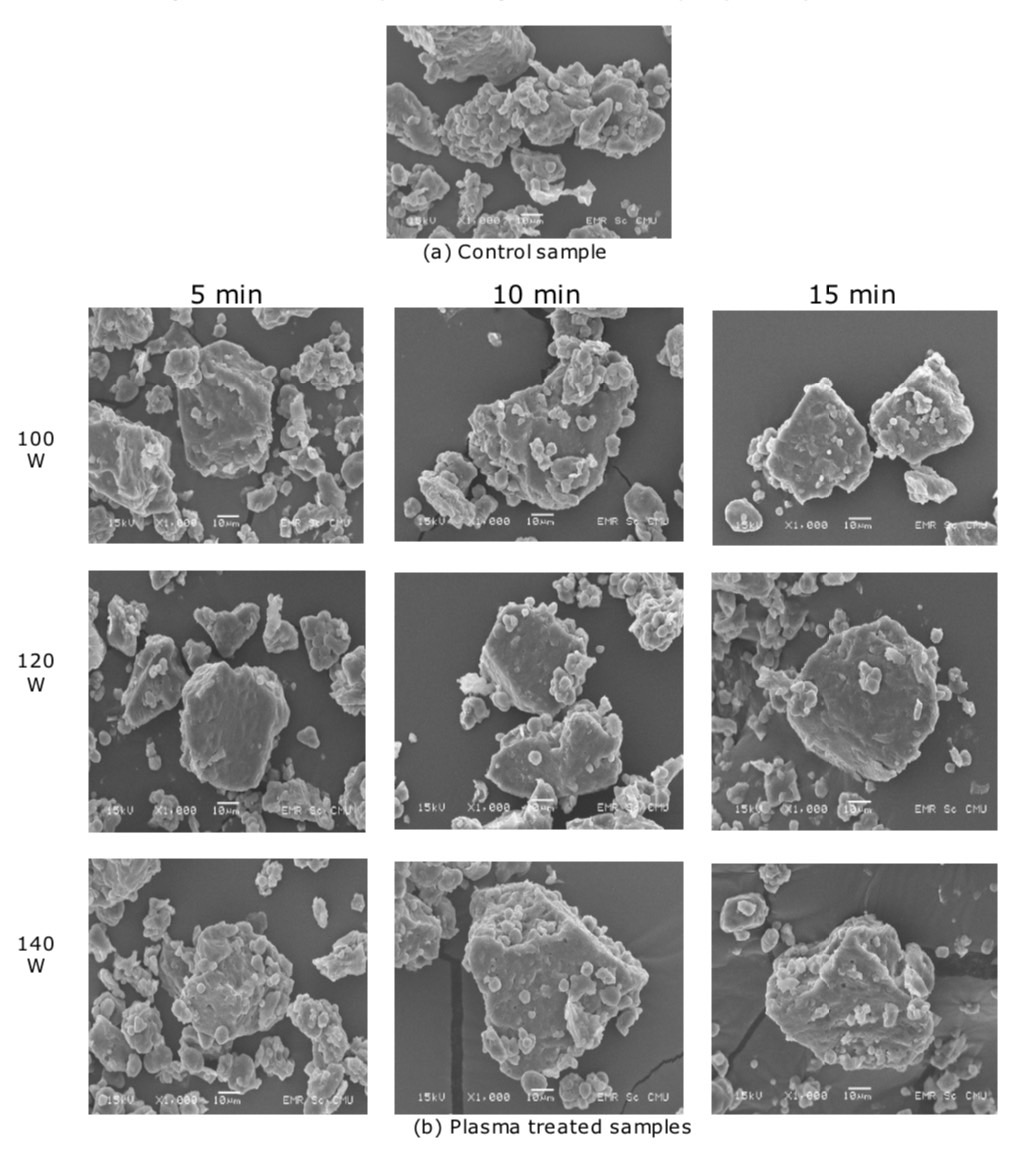
Figure 1. Surface morphology of pigmented rice flour from Kum Doi Saket cultivar after plasma treatment by SEM at ×1,000 magnification.
DISCUSSION
In plasma generation, inert gases such as argon or helium are used as carrier gas which help in plasma dispersion, causing the homogeneous mixed gas which could approach to the sample effectively. In this study, argon was chosen due to the DBD’s limitations in defining the argon gas as the primary gas for plasma generation and its cheaper price than helium gas.
From Table 1, the loss of water molecules at the surface of pigmented rice flours was due to the attack of plasma clouds from the increase of plasma power and exposure time. Longer plasma exposure time led to decomposition of water molecules into small molecules and might cause oxygen radicals formation (Zou et al., 2004; Thirumdas et al., 2015; Sarangapani et al, 2015). The similar results were also reported by Thirumdas et al. (2016). The amylose contents of plasma treated samples were slightly decreased (P >0.05). This was different from the report of Banura et al. (2018) who reported that plasma treatment under higher power with longer exposure time on cassava starch led to obtaining higher amylose content due to depolymerization of amylopectin. Nevertheless, plasma treatment under longer exposure time might lower the amylose content because ions and free radicals occurring during plasma treatment disrupted the chains of double helical amylose resulting in the lower molecular weight (Banura et al., 2018; Bie et al., 2016). This could lead to a slight decrease of amylose contents in this research. The resistant starch contents of the pigmented rice flour in this study were found to significantly increased (P ≤0.05) when treated with increasing plasma power and exposure time. The result found in this study was aligned with the results of the previous study on plasma treated cassava starch (Trinh and Le, 2017) and rice starch (Sun et al., 2022). This result was probably demonstrated that an increase of plasma power led to disruption of amylopectin (Lii et al., 2002a, 2002b) and higher proportion of linear molecules resulted in the higher resistant starch (Lapkhoksung, 2012). In the case of anthocyanin content, it was found that both components of anthocyanin significantly increased (P ≤0.05) after treatment with increasing plasma power and exposure time, especially at 140 W for 10 min and longer. The increasing anthocyanins might be due to the higher plasma power that generated the pores which on some pigment sack containing anthocyanin molecules. As a result, some contents of this pigment were increasingly dissolved into the solvent and led to the higher anthocyanin contents of both C3G and P3G contents. Additionally, it could be due to the co-pigmentation which helped to stabilize the structure of anthocyanin (Rein, 2005; Castaneda-Ovando et al, 2009). The intermolecular co-pigmentation with other colorless compounds such as flavonoids results in complex compounds (Rein, 2005; Castaneda-Ovando et al, 2009). Also, the increased anthocyanin content was caused by the structure of glycolized delphinidin and cyaniding under cold plasma treatment (Grzegorzewski et al., 2010). On the other hand, the decrease of anthocyanins might be attributed by the attacking of plasma particles and lead to damaged pericarp by cellulose (Somjai, 2014), which caused a direct destruction of anthocyanins. With this reason, some samples could be detected at lower anthocyanin content by HPLC analysis.
Plasma treatment significantly decreased solubility of the pigmented rice flour (P ≤0.05). The decrease of rice flour solubility after increasing plasma treatment was in agreement with the result reported by Nemtanu and Minea (2006). This possibly implies that there was crosslinking reaction on polymer chains in these flours during plasma treatment (Zhu, 2017). Zou et al. (2004) also stated that the crosslinking reaction was made by a plasma attack. It was also suggested that depolymerization and crosslinking reaction within a molecule of flour was caused by plasma attack (Thirumdas et al., 2017). The decrease in rice flour solubility was also related to the increase of resistant starch which is insoluble component in the pigmented rice flour. Similarly, swelling power of the sample significantly decreased with increasing plasma power and exposure time (P ≤0.05). Zhang et al. (2015) also reported that swelling power of plasma treated potato starch was affected by changing the molecular structure of the starch. The crosslinking reaction on starch molecules could increasingly establish the complex structure of branches and networks and finally return to inhibit the swelling of rice flour. With this reason, it was possible that a decrease in swelling power was contributed by the crosslinking reaction made by attacking of the plasma and in increasing in resistant starch content also (Table 2).
The thermal properties were mainly used to reveal the gelatinizing properties of starch, as shown in Table 3. Banura et al. (2018) also found that Tp increased in accordance with plasma power and exposure time, which was similar to the result of Wongsagonsup et al. (2014). Similar to the previous research on modified starch with hydroxypropylation and crosslinking by Hazarika and Sit (2016), ΔH of the pigmented rice flour was not significantly affected by plasma treatment (P >0.05), but tended to decrease. ΔH has been reported to be influenced by the degree of crystallinity of starch. After plasma treatments, the decreases in enthalpy indicated that less energy was required for gelatinization when compared to the native starch (Chen 2014). However, ΔH and Tp of rice flour decreased with decreasing plasma power and exposure time due to the loss of the double helix structure (Wang et al., 2010; Trirumdas, 2017). Choi and Kerr (2004) suggested that cross-linking did not change the gelatinization temperature.
The pasting temperature of the pigmented rice flour was not significantly affected (P >0.05) by plasma treatment or increasing exposure time below 140 W and 10 min compared to control samples (Table 4). These could be due to a significant decreased in moisture content at high plasma power and long exposure time. Also, the increase in resistant starch could also contribute to increasing pasting temperature due to lower ability to absorb moisture than other soluble starch compositions. The amount of amylose content also affected the pasting properties of the flour (Pal et al., 2016). The plasma treated rice flour showed lower peak viscosity, breakdown and setback. A decrease in peak viscosity might be caused by the starch lipid complexes, while the breakdown reduction indicates that it was caused by crosslink formation in rice flour (Raharja et al., 2018), resulting in the stability of starch pastes (Okyere et al., 2022) and higher shear stability at high temperature. The setback viscosity indicates starch retrogradation (Hazarika and Sit, 2016). The lower setback value of plasma treated rice flour implied the lower retrogradation because the internal structure of starch granules was stronger. Furthermore, it was found that exposure of pigmented rice flour particles to plasma at higher power and longer time caused attacking of the plasma particle on the surfaces; consequently, changed of its morphology (Figure 1). It was found that as plasma power and exposure time were increased, rough surface, cracking and erosion on the rough surface of pigmented rice and starch granules occurred (Chen, 2014; Mir et al., 2016; Noppakun et al., 2021). From the surface quality analysis of plasma treated rice flour samples, more eroded, rough and porous surfaces were observed when compared with the untreated sample. The change of surface structure was clearly shown at 1,000X (Figure 1). The surface roughness of the grain was clear when using plasmas of argon. Moreover, it was reported that Ar+ in combination with reactive oxygen species such as *OH, *O and *O2 caused epidermis to degenerate guard cells (Noppakun et al., 2021). The highly energetic species produced during the plasma generation bombarded the surface of the starch granule. This induces the volatilization of the starch surface (plasma etching), causing a network formation of the regular native starch granules, by linking to each other as a built of plasma treatment. (Okyere et al., 2022, Zou et al., 2004)
CONCLUSION
This study provided various data associated with the effects of plasma power and exposure time on physicochemical properties of pigmented rice flour. Different plasma treatment conditions also produced the flours with lower moisture content, amylose content, solubility, and swelling power, while resistant starch content, anthocyanin content and Tp were increased. Other pasting temperatures, ΔH and flour particles’ morphology did not significantly differ from those of the control sample when treated with plasma at less intense condition than 140 W and 10 min. From this study, plasma treatment at 140 W and 10 min using argon gas at flow rate of 8 L/min was recommended for further study to explore its potential for flour properties improvement since it could give rice flour with high resistant starch content and high anthocyanin which give health benefits. Further studies on upscaling of plasma treatment, cost-profit and other properties that are affected by plasma are needed to obtain adequate data for further commercialize the plasma application on rice flour properties improvement.
ACKNOWLEDGMENTS
This research was supported by grants funded by National Research Council of Thailand (NRCT), the Graduate School of Chiang Mai University (TA/RA scholarship), and the Faculty of Agro-Industry, Chiang Mai University (RA scholars). SEM analysis was supported by the Central Science Laboratory, Chiang Mai University. The authors extend gratitude to technical staff at the Faculty of Agro-Industry for their supports and research facilitation.
AUTHOR CONTRIBUTIONS
Sirintat Liamlaem assisted in conducting the experiments, performed the statistical analysis and data visualization and wrote the manuscript. Pilairuk Intipunya was the research project leader, designed the experiments, supervised research experiments, proved the experimental data and statistical analysis and wrote the manuscript. Srisuwan Naruenartwongskul gave advice on the experiments. All authors have read and approved of the final manuscript.
CONFLICT OF INTEREST
The authors declare that they hold no competing interests.
REFERENCES
AOAC. 2000. Official methods of the association of official analytical chemists. Association of Official Analytical Chemists, Washington D.C.
Banura, S., Thirumdas, R., Kaur, A., Deshmukh, R.R., and Annapure, U.S. 2018. Modification of starch using low pressure radio frequency air plasma. LWT - Food Science and Technology. 89: 719-724.
Bie, P., Li, X., Xie, F., Chen, L., Zhang, B., and Li, L. 2016. Supramolecular structure and thermal behavior of cassava starch treated by oxygen and helium glow-plasmas. Innovative Food Science and Emerging Technologies. 34: 336-343.
Blase, E.M. 2020. Optimisation of rice flour traits for the production of indigenous rice recipes. Current Research in Nutrition and Food Science. 8: 349-359.
Castaneda-Ovando, A., Pacheco-Hernández, M., Paez-Hernández, M., Rodríguez, J., and Galán-Vidal, C. 2009. Chemical studies of anthocyanins: A review. Food Chemistry. 113: 859-871.
Chen, H.H. 2014. Investigation of properties of long-grain brown rice treated by low-pressure plasma. Journal of Food Bioprocess Technology. 7: 2484–2491.
Choi, S. and Kerr, W.L. 2004. Swelling characteristics of native and chemically modified wheat starches as a function of heating temperature and time. Starch/Stärke. 56: 181-189.
Grzegorzewski, F., Ehlbeck, J., Schlüter, O., Kroh, L.W., and Rohn, S. 2011. Treating lamb’s lettuce with a cold plasma-Influence of atmospheric pressure Ar plasma immanent species on the phenolic profile of Valerianella locusta. LWT-Food Science and Technology. 44: 2285-2289.
Hayashi, S. and Yanase, E. 2016. A study on the color deepening in red rice during storage. Food Chemistry. 199: 457-462.
Hazarika, B.J. and Sit, N. 2016. Effect of dual modification with hydroxypropylation and cross-linking on physicochemical properties of taro starch. Carbohydrate Polymers. 140: 269-278.
Kusumayanti, H., Handayani, N.A., and Santosa, H. 2015. Swelling power and water solubility of cassava and sweet potatoes flour. Procedia Environmental Sciences. 23: 164-167.
Laokuldilok, T., Shoemaker, C.F., Jongkaewwattana, S., and Tulyathan, V. 2011. Antioxidants and antioxidant activity of several pigmented rice brans. Journal of Agricultural and Food Chemistry. 59: 193-199.
Lapkhoksung A. 2012. Effects of amylose content and amylopectin structure of different starch varieties on resistant starch type iii formation. [master’s thesis]. Nakhon Ratchasima: Suranaree University of Technology.
Lii, C., Liao, C., Stobinski, L., and Tomasik, P. 2002a. Behaviour of granular starches in low-pressure glow plasma. Carbohydrate Polymers. 49: 499-507.
Lii, C., Liao, C., Stobinski, L., and Tomosik, P. 2002b. Effects of hydrogen, oxygen and ammonia low-pressure glow plasma on granular starches. Carbohydrate Polymers. 49: 449-456.
McCleary, B.V. and Monaghan, D.A., 2002. Measurement of resistant starch. Journal of AOAC International. 85: 665-675.
Mir, S.A., Shah, M.A., and Mir, M.M. 2016. Understanding the role of plasma technology in food industry. Journal of Food Bioprocess Technology. 9: 734-750.
Misra, N.N., Tiwari, B.K., Raghavarao, K.S.M.S., and Cullen, P.J. 2011. Nonthermal plasma inactivation of food-borne pathogens. Food Engineering Reviews. 3: 159-170.
Nemtanu, M.R. and Minea, R. 2006. Functional properties of corn starch treated with corona electrical discharges. Macromolecular Symposia. 245-246: 525-528.
Noppakun, M., Naruenartwongsakul, S., Seesuriyachan, P., Phimolsiripol, Y., Boonyawan, D., and Intipunya, P. 2021. Effects of plasma treatment on cooking and physical qualities of pigmented Thai rice. Chiang Mai University Journal of Natural Sciences. 20: 1-14.
Okyere, A.Y., Rajendran, S., and Annor, G.A. 2022. Cold plasma technologies: their effect on starch properties and industrial scale-up for starch modification. Current Research in Food Science. 5: 451-463.
Pal, P., Kaur, P., Singh, N., Kaur, A., Misra, N.N., Tiwari, B.K., Cullen, P.J., and Virdi, A.S. 2016. Effect of nonthermal plasma on physico-chemical, amino acid composition, pasting and protein characteristics of short and long grain rice flour. Food Research International. 81: 50-57.
Raharja, S., Suparno, O., Udin, F., Listyaningrum, F.P., and Nuraisyah, A. 2018. The optimization of rice flour cross-linking with gluten to improve the dough quality of rice flour. International Journal of Scientific & Technology Research. 7:50-53.
Rein, M. 2005. Copigmentation reactions and color stability of berry anthocyanins. [PhD thesis], Helsinki: University of Helsinki.
Sarangapani, C., Devi, Y., Thirumdas, R., Annapure, U.S., and Deshmukh, R.R. 2015. Effect of low-pressure plasma on physicoechemical and functional properties of parboiled rice flour. LWT - Food Science and Technology. 63: 452-460.
Somjai, C. 2015. Texture modification and production of microwavable quick cooking [master’s thesis]. Chiang Mai: Chiang Mai University.
Sriroth, K. and Piyajomkwan, K. 2007. Starch technology. Kasetsart University Press. 12-25.
Summart, R. and Chewonarin, T. 2014. Purple rice extract supplemented diet reduces DMH-Induced aberrant crypt foci in the rat colon by inhibition of bacterial β-glucuronidase. Asian Pacific Journal of Cancer Prevention, 15: 749-755.
Sun, X., Saleh, A.S.M., Sun, Z., Ge, X., Shen, H., Zhang, Q., Yu, X., Yuan, L., and Li, W. 2022. Modification of multi-scale structure, physicochemical properties, and digestibility of rice starch via microwave and cold plasma treatments. LWT - Food Science and Technology. 153: 112483.
Thirumdas, R., Deshmukh, R.R., and Annapure, U.S. 2015. Effect of low temperature plasma processing on physicochemical properties and cooking quality of basmati rice. Innovative Food Science and Emerging Technologies. 31: 83-90.
Thirumdas, R., Deshmukh, R.R., and Annapure, U.S. 2016. Effect of low temperature plasma on the functional properties of basmati rice flour. Journal of Food Science and Technology. 53: 2742-2751.
Thirumdas, R., Trimukhe, A., Deshmukh, R.R. and Annapure, U.S. 2017. Functional and rheological properties of cold plasma treated rice starch. Carbohydrate Polymers. 157: 1723-1731.
Trinh, K.S. and Le, H.D. 2017. Tapioca resistant starch production and its structural properties under annealing and plasma treatments. Carpathian Journal of Food Science and Technology. 9: 36-42.
Wang, L., Xie, B., Shi, J., Xue, S., Deng, Q., Wei, Y., and Tian, B. 2010. Physicochemical properties and structure of starches from Chinese rice cultivars. Food Hydrocolloids. 24: 208-216.
Wongsagonsup, R., Deeyai, P., Chaiwat, W., Horrungsiwat, S., Leejariensuk, K., Suphantharika, M., Fuongfuchat, A., and Dangtip, S. 2014. Modification of tapioca starch by non-chemical route using jet atmospheric argon plasma. Carbohydrate Polymers. 102: 790-798.
Zhang, B., Chen, L., Li, X., Li, L., and Zhang, H. 2015. Understanding the multi-scale structure and functional properties of starch modulated by glow-plasma: A structure-functionality relationship. Food Hydrocolloids. 50: 228-236.
Zhu, F. 2017. Plasma modification of starch. Food Chemistry. 232: 476-486.
Zou, J.J., Liu, C.J., and Eliasson, B. 2004. Modification of starch by glow discharge plasma. Carbohydrate Polymers. 55: 23-26.
Zu, Q.H., Jian, P.L., Xuan, H.L., and Zhang, F.T. 2007. Effect of mechanical activation on physico-chemical properties and structure of cassava starch. Carbohydrate Polymer. 68: 128-135.
OPEN access freely available online
Chiang Mai University Journal of Natural Sciences [ISSN 16851994]
Chiang Mai University, Thailand.
https://cmuj.cmu.ac.th
Sirintat Liamlaem1, Srisuwan Naruenartwongsakul1,2 and Pilairuk Intipunya1,2,*
1 Faculty of Agro-Industry, Chiang Mai University, Chiang Mai 50100, Thailand
2 Lanna Rice Research Center, Chiang Mai University, Chiang Mai 50200, Thailand.
Corresponding author: Pilairuk Intipunya, E-mail: pilairuk.intipunya@cmu.ac.th
Total Article Views
Editor: Wasu Prathum-Aree,
Chiang Mai University, Thailand
Article history:
Received: April 11, 2022;
Revised: August 22, 2022;
Accepted: August 24, 2022;
Published online: September 6, 2022