 ISSN: 2822-0838 Online

Optimization Extraction for Total Phenolic, Flavonoid Contents, and Antioxidant Activity with Different Solvents and UPLC-MS/MS Metabolite Profiling of Justicia gendarussa Burm.f
Nelly Marliani, I Made Artika, and Waras Nurcholis*Published Date : 2022-07-11
DOI : https://doi.org/10.12982/CMUJNS.2022.046
Journal Issues : Number 3, July-September 2022
Abstract Justicia gendarussa Burm.f contains polyphenol, which has pharmacological activity. Therefore, this study aims to show the potential of antioxidant compounds in J. gendarussa. The extraction method used was an experimental design that maximized phenolic recovery with the highest antioxidant activity from the leaves of this plant. Furthermore, a simplex-centroid design was used to evaluate the various extractor solvents (water, ethanol, and hexane) and their binary or ternary mixtures, while UPLC-MS/MS analysis was used to identify bioactive compounds. The total phenol (TPC) and flavonoid content (TFC) of the optimized extracts were determined using Follin-Ciocalteu and colorimetric methods, as well as their antioxidant activity were determined using the 2,2-diphenyl-picrylhydrazyl (DPPH) and ferric reducing antioxidant power (FRAP) assays. The results was optimized to a value of 0.844 using water-hexane solvents with a predicted TPC, TFC, DPPH, and FRAP of 112.076 mg GAE/g, 34.926 mg QE/g, 45.477 µmol TE/g, and 353.611 µmol TE/g, respectively. Additionally, the UPLC-MS/MS analysis showed 62 compounds such as phenolics, isoflavonoids, alkaloids, terpenoids, alcohols, and other groups of components. This study shows the potential of antioxidant compounds J. gendarussa.
Keywords: Extraction optimization, Justicia gendarussa Burm.f, Simplex centroid design, Polyphenols, Antioxidant
Funding: The authors are grateful for the research funding provided by Ministry of Education, Culture, Research, Technology Republic of Indonesia (grant number: 2035/IT3.L1/PN/2021).
Citation: Marliani, N., Artika, I. M., and Nurcholis, W. 2022. Optimization extraction for total phenolic, flavonoid contents, and antioxidant activity with different solvents and UPLC-MS/MS metabolite profiling of Justicia gendarussa Burm.f. . CMU J. Nat. Sci. 21(3): e2022046.
INTRODUCTION
Justicia gendarussa Burm., known as Gandarusa, is a species of plant in the Acanthaceae family, and it has been discovered in many Asian countries, including Indonesia and Thailand (Somprasong et al., 2014). This plant grows wild and is often used as a hedge. Furthermore, J. gendarussa is used by the people of India as a medicine for rheumatism, eczema, bronchitis, and icterus (Raghu and Agrawal, 2016), while Indonesia, particularly the people of Papua, uses it for antifertility drug (Mnatsakanyan et al., 2018). The leaves of this plant are used in Thailand as a medicine for allergies, inflammation, fever, and as a cardiotonic. In addition to the leaves, the roots are also used as antivenin (Setyowati et al., 2010; Sangat Roemanty, 1999). Previous studies showed that this plant has pharmacological activities such as antioxidant (Nimse and Pal, 2015), anti-inflammatory (Zhang et al., 2021), HIV antiviral, cytotoxic, and antimicrobial activity (Widodo et al., 2018).
Polyphenols are one of the secondary metabolites contained in the leaves of J. gendarussa (Rajbhar et al., 2015). These compounds are widely associated with various biological activities, such as antioxidant, anticancer, anti-inflammatory, anti-atherogenic activity, anti-depressant (Akanda et al., 2019), antimicrobial effect, cardioprotective activity, anti-aging effect, and osteoporosis prevention (Li et al., 2014).
Extraction using solvents is the first step in separating the desired natural product from the raw material. This aims to maximize the amount of the target compound and obtain plant biological activity from the extract (Zhang et al., 2018). A simplex centroid design approach can optimize the extract process, namely a statistical method using linear programming, a decision-making technique in resource-related problems related to resources involving many constraints and variables (Tiaraswara et al., 2016). Several extraction optimization studies were already performed with the design, showing that a mixture of acetone and water is the optimal solvent for the extraction of temu ireng rhizome (Nurcholis et al., 2019). Furthermore, the extraction of flavonoid compounds from Tagetes patula generated optimal results using acetone-water (Munhoz et al., 2014). Flavonoids from torbangun leaf are best extracted using ethanol-hexane as a solvent (Wibisono et al., 2019).
The optimization of the extraction using a solvent on J. gendarussa leaves has not been performed. Therefore, this study was conducted to optimize the extraction process according to polyphenol content and antioxidant activity parameters using a simplex centroid design. The optimum extract was determined by the composition of the compound using UPLC-MS/MS. This study is essential, specifically in obtaining the highest optimum extraction solvents and the types of compounds in the leaves of J. gendarussa.
MATERIAL AND METHODS
Plant materials
The leaves of J. gendarussa (BMK0173092016) were obtained in September 2021 from The Tropical Biopharmaceutical Cultivation Conservation Unit Garden of LPPM IPB, Cikabayan Blok C Garden, Dramaga Campus of IPB, Bogor (6º3'49” S dan 106º42’57”t). Furthermore, they were cleaned, washed, and dried for three days at 50ºC. The dried leaves were then ground into powder using a disk mill and an 80 mesh sieve. Finally, the product obtained was used for further analysis.
Extraction optimization
According to Table 1, 15 g of dry powder was extracted with 150 mL of solvent to maximize the extraction. The mixture was macerated using a water bath shaker at a temperature of 27ºC for 24 hours and a speed of 120 rpm. Furthermore, it was filtered and concentrated using a rotary evaporator at a temperature of 50ºC. Finally, the polyphenol content and antioxidant activity of the extracts were measured.
Simplex centroid design
The extraction process was performed using water, ethanol, and hexane solvents based on a simplex centroid design with the Design Expert 13.0 program. The mixture components were examined from 0% to 100%, and the most suitable model was selected for each response. Furthermore, the response data were analyzed statistically using Design Expert 13.0 software (Stat-Ease Inc, Minneapolis, USA).
Total phenolic content (TPC) assay
TPC was determined using the Follin-Ciocalteu method. First, 20 µL of sample extract was mixed with 120 µL of 10% Follin-Ciocalteu in 96 well-microplates and incubated for 5 minutes. Afterward, 80 µL Na2CO3 was added and incubated for 30 minutes in the dark. The absorbance was measured at 759 nm using the microplate reader (Spectrostar Nano, BMG LABTECH), while the calibration curve was drawn using gallic acid with a concentration variation of 20-300 ppm. Finally, the total phenolic content was expressed in milligrams of gallic acid equivalent per gram of extract (mg GAE/g).
Total flavonoid content (TFC) assay
TFC was determined using the colorimetric method. A total of 120 µL of distilled water was placed in 96 well-microplates, then 10 µL of sample extract, 10 µL of AlCl3 10%, 10 µL glacial acetic acid, and 50 pro-analytical ethanol were added. The mixture was incubated for 30 minutes in the dark. Afterward, the absorbance was measured at 415 nm using the microplate reader (Spectrostar Nano, BMG LABTECH). Calibration curves were constructed using quercetin diluted with methanol (25-500 ppm). The total flavonoid content is expressed in milligrams of quercetin equivalent per gram of extract (mg QE/g).
Antioxidant activity
DPPH free radical assay
Antioxidant activity was determined using the 2,2-diphenyl-picryl hydrazyl (DPPH) free radical scavenging method. Furthermore, 100 µL of sample extract was added to 100 µL DPPH solution in 96 well-microplates and incubated for 30 minutes in a dark room. The absorbance was measured at 515 nm using the microplate reader (Spectrostar Nano, BMG LABTECH). Calibration curves were constructed using Trolox concentrations of 10-50 µM. Finally, the DPPH radical scavenging activity of the extract was expressed as micromoles of Trolox equivalent per gram of extract (µmol TE/g).
FRAP assay
Antioxidant activity was determined using the ferric reducing antioxidant power (FRAP) method. The solution was prepared by mixing acetate buffer (pH 3.6), 10 µM tripyridyl-s-triazine (in 40 mM HCl), and 20 mM FeCl3 in 10:1:1 (v/v/v) and stored in dark bottle. Afterward, 20 µL of sample extract was mixed with 290 µL of FRAP in a 96 well-microplate and incubated for 30 min. The absorbance was measured at 583 nm using the microplate reader (Spectrostar Nano, BMG LABTECH). Calibration curves were constructed using Trolox concentrations of 100-600 µM. Antioxidant activity was expressed as micromoles of Trolox equivalent per gram of extract (µmol TE/g).
Optimization and verification solution
The most optimal results are selected based on desirability with a score close to 1.00 (Khalafyan et al., 2019). The method was verified according to the previous parameters. Furthermore, the data was confirmed in Design Expert 13.0 and analyzed based on the One-Sample T-test and % RSE (relative standard error) test using SPSS version 22.
Data analysis
The data from the extraction optimization results were analyzed using Design Expert 13.0 software (Stat-Ease Inc, Minneapolis, USA). The significant difference was calculated based on Duncan’s test (P <0.05) using SPSS 22.
Metabolite profiling using UPLC-QToF-MS/MS
The identification of bioactive compounds using the Ultra Performance Liquid Chromatography-Quadrupole Time of Flight-Mass Spectrometry (UPLC-QToF-MS/MS) instrument. The sample was prepared before injection using the Solid Phase Extraction (SPE) method. First, a sample extract of 10 mg was dissolved in 10 mL of methanol. Furthermore, it was put into 5 µL of methanol using a microsyringe for further injection into the sample holder and the UPLC column ACQUITY UPLC BH C18 (1.8 µm 2.1 × 50 mm; Waters, USA). The sample passes through a needle with a positive ESI charge (+). The ions produced by the detector were separated with a QToF analyzer (Xevo G2-S QToF; Waters, USA), and the eluent used was a mixture of (A) water:formic acid and (B) acetonitrile:formic acid with a flow rate of 0.2 mL/minute. Finally, the results of the separation are read by the QToF-MS detector to produce a chromatogram peak which is then interpreted using Masslynx.
RESULTS
Optimization of sample extraction
Table 1 shows that the dry powder leaves J. gendarussa were extracted using three different solvents, namely water, ethanol, hexane, and a binary and ternary mixture created based on the simplex centroid design through the Design Expert 13.0 program. It also presents the effects of different solvents systems on each response variable, namely TPC, TFC, and antioxidant activity based on DPPH radical scavenging and FRAP. The response results from TPC ranged from 13.136 mg GAE/g to 112.076 mg GAE/g, with the maximum and minimum being produced by the ternary mixture (water:ethanol:hexane) and in the hexane solvent system, respectively. TPC has various results ranging from 15.902 QE/g to 34.926 mg QE/g with maximum and minimum on the ethanol system and hexane, respectively. The antioxidant activity of DPPH ranged from 19.427 µmol TE/g in the water, such as ethanol binary mixture, to 45.477 µmol TE/g in the mixed ternary system, which includes water, ethanol, and hexane. Meanwhile, the antioxidant activity of FRAP is observed in ethanol with an activity of 106.388 µmol TE/g to 353.611 µmol TE/g in a mixture of ethanol and hexane. It was concluded that the extraction solvent had different effects on TPC, TFC, DPPH, and FRAP activities but did not differ significantly.
Table 1. Simplex centroid design for TPC, TFC, DPPH, and FRAP.
|
Run |
Solvents (mL) |
Response Variable* |
||||||
|
Water (A) |
Ethanol (B) |
Hexane (C) |
TPC (mg GAE/g) |
TFC (mg QE/g) |
DPPH (µmol TE/g) |
FRAP (µmol TE/g) |
||
|
1 |
0 |
75 |
75 |
106.84d |
30.21de |
31.62b |
353.61c |
|
|
2 |
75 |
75 |
0 |
90.40c |
20.94ab |
19.42a |
288.05c |
|
|
3 |
50 |
50 |
50 |
112.07d |
24.04bc |
45.47d |
296.94c |
|
|
4 |
150 |
0 |
0 |
83.43bc |
17.40a |
38.68c |
134.72ab |
|
|
5 |
0 |
0 |
150 |
33.13a |
15.90a |
42.37cd |
261.38bc |
|
|
6 |
75 |
0 |
75 |
110.86d |
28.78cd |
39.87cd |
338.61c |
|
|
7 |
0 |
150 |
0 |
77.37b |
34.92e |
40.59cd |
106.38a |
|
Note: *Values with different letters in the same column differ significantly at P-value
Model fitting
Table 2 shows the analysis of variance as an evaluation of the mathematical model used with a confidence interval of 95%. The coefficient of R2 as the model's performance, namely the mathematical equation, is usually considered ideal when it exceeds 70%. Therefore, this coefficient of determination indicates the suitability of the regression model. When the R2 values of TPC, TFC, DPPH, and FRAP were 0.9985, 0.975, 0.5417, and 0.9249, respectively, the model explains 99, 97, 54, and 92% of the variance in the experimental results, respectively.
Meanwhile, the regression model obtained from ANOVA (analysis of variance) is based on the F statistical value, and it is considered significant when the F value is greater than the F table with a low P-value of
Table 2. Results of ANOVA on the response variables.
|
|
TPC |
TFC |
DPPH |
FRAP |
|
|
Quadratic |
Quadratic |
Quadratic |
Quadratic |
|
F |
136.32 |
7.88 |
0.23 |
2.46 |
|
p |
0.06 |
0.26 |
0.90 |
0.44 |
|
R2 |
0.99 |
0.97 |
0.54 |
0.92 |
|
Adjusted R2 |
0.99 |
0.85 |
-1.75 |
0.54 |
Effects of the solvent system on the response variable
Total Phenolic Content (TPC)
The following equation shows that the resulting quadratic model can determine the effect of TPC on the interaction between water, ethanol, and hexane.
TPC = 83.67A + 77.60B + 33.36C + 35.48AB + 205.78AC + 201.84BC (1)
Where A = water, B = ethanol, and C = hexane
In equation 1, they all provide a positive synergy in extracting phenolic compounds from the leaves of J. gendarussa. Furthermore, the highest yield was in the water: hexane (+205.78), while the lowest was hexane (+33.35). This implies that the mixture of water and hexane provides the most optimal increase in TPC extraction
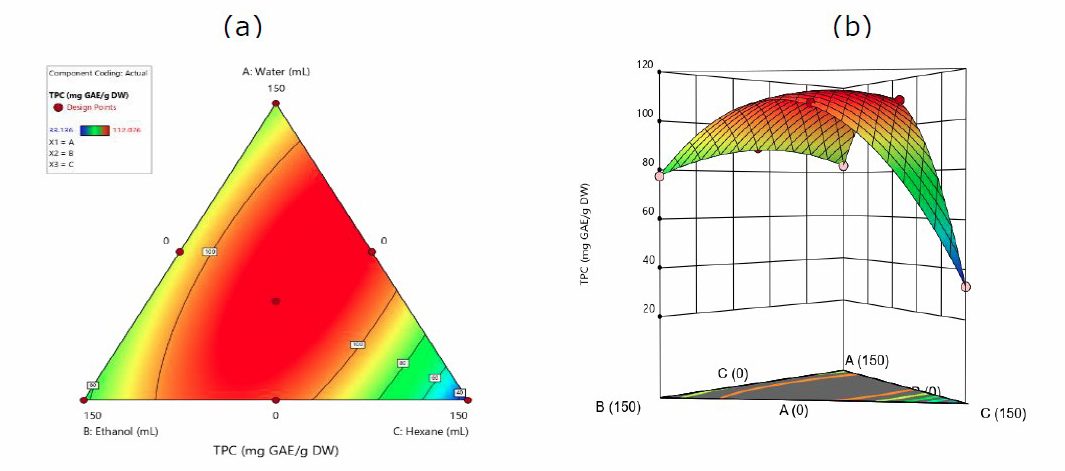
Figure 1. Contour plots(a). and 3-D graph (b). for surface analysis of predicted quadratic model response for the extraction of TPC in water (A), ethanol (B), and hexane (C).
Total flavonoid content (TFC)
Figure 2 shows the effect of the solvent system on TFC. The quadratic model determines the effect of TFC on the interaction between water, ethanol, and hexane using equation 2.
TFC = 17.64A + 35.16B + 16.14C – 29.25AB + 43.75AC + 14.42BC (2)
Where A, B, and C are water, ethanol, and hexane, respectively.
Figure 2 shows that the total flavonoid response from J. gendarussa leaves extraction was 34.926 mg QE/g. The ethanol solvent system had the most optimal results. Furthermore, equation 2 proves that flavonoid solvent interactions have a positive increase, namely ethanol (+35.16) and the lowest is hexane (+16.14), but there is a decrease in negative ethanol interaction (-29.25). Therefore, this study showed that semi-polar ethanol extracts flavonoids ideally from the leaves of this plant.
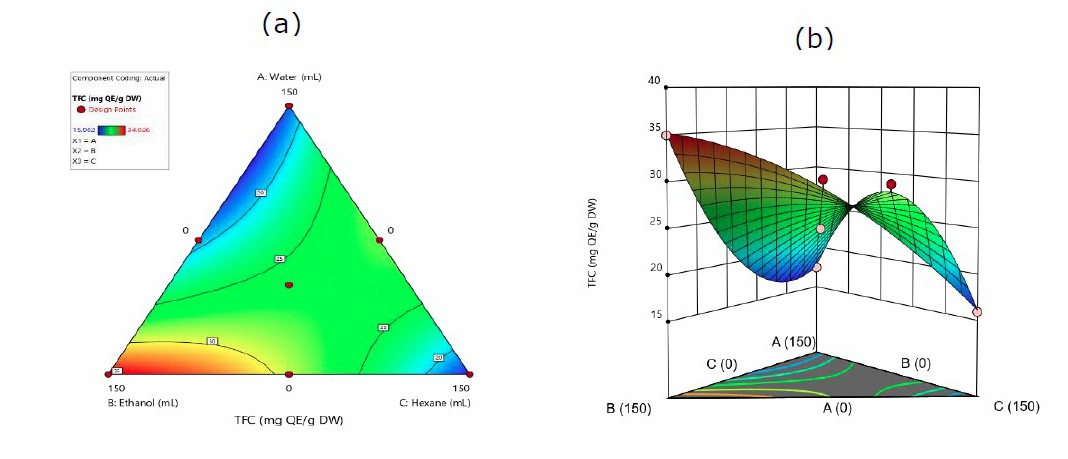
Figure 2. Contour plots (a). and 3-D graph (b). for surface analysis of predicted quadratic model response for the extraction of TFC in water (A), ethanol (B), and hexane (C).
Antioxidant Activity
Extraction solvents affect the antioxidant activity. Figure 3 shows the antioxidant activity measured by various solvent systems in the DPPH method. The quadratic model determines the effect of DPPH on the interaction between water, ethanol, and hexane using equation 3.
DPPH = 37.42A + 39.33B + 41.11C – 55.41AB + 22.70AC – 14.10BC (3)
Where A, B, and C are water, ethanol, and hexane, respectively.
The antioxidant test based on DPPH showed the most optimal activity in hexane solvent of 45.477 µmol TE/g. Meanwhile, equation 3 produced a positive interaction effect that can increase the highest extraction with hexane solvent (+41.11), but there is a negative decrease in water:ethanol (-55.51) and ethanol:hexane (-14.10).
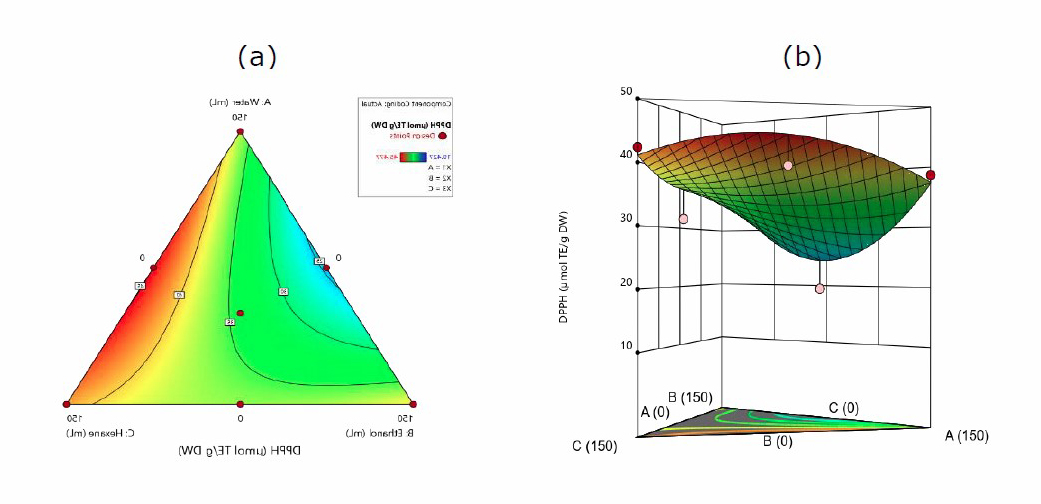
Figure 3. Contour plots (a). and 3-D graph (b). for surface analysis of predicted quadratic model response for the extraction of DPPH in water (A), ethanol (B), and hexane (C).
Equation 4 shows the antioxidant test for the quadratic model based on the FRAP method.
FRAP = 140.37A + 112.04B + 267.04C + 556.95AB + 449.17AC + 565.84BC (4)
Where A, B, and C are water, ethanol, hexane, respectively.
According to Figure 4, the best antioxidant activity against J. gendarussa leaves was discovered in a solvent mixture of ethanol and hexane, with 353,611 mol TE/g. The interaction effect based on equation 4 similarly produces positive results, with the highest value in a mixture of ethanol and hexane solvents (+565.84) and the lowest in water solvent (+140.37).
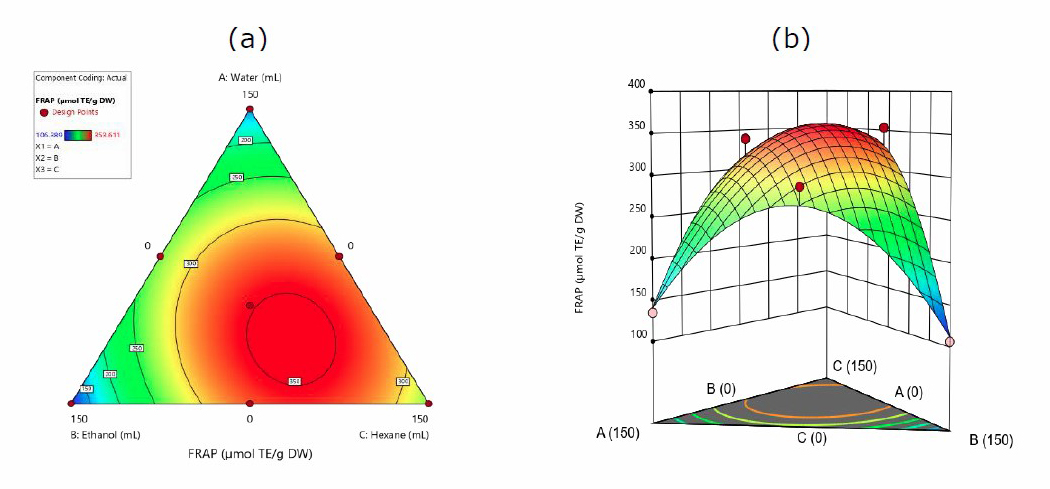
Figure 4. Contour plots (a). and 3-D graph (b). for surface analysis of predicted quadratic model response for the extraction FRAP in water (A), ethanol (B), and hexane (C).
Optimization and verification solution
The determination of the optimization point is evaluated based on the desirability value. For example, in optimizing the simplex centroid design, the solution with a value of 0.844 implies 84.4% accuracy of the results from the criteria used with a mixed composition of 75.227 mL water and 74.773 mL hexane.
Table 3. Optimization solution verification results.
|
|
Solvents (mL) |
Response Variable(a) |
|||||||
|
Water (A) |
Ethanol (B) |
Hexane (C) |
TPC (mgQE/g) |
TFC (mgQE/g) |
DPPH (µmolTE/g) |
FRAP (µmolTE/g) |
Desirability |
||
|
Prediction |
75.22 |
0 |
74.77 |
110.03 |
27.82 |
44.92 |
315.83 |
0.84 |
|
|
Verification |
75.22 |
0 |
74.77 |
130.18 |
33.83 |
54.04 |
386.35 |
0.84 |
|
|
P-value |
|
|
|
0.05 |
0.06 |
0.06 |
0.06 |
|
|
|
%RSE |
|
|
|
18.31 |
21..59 |
22.28 |
22.32 |
|
|
Note: In each column, values with different letters in the same column differ significantly at P-value
Verification shows that the optimal point solution is correct to deliver a response based on simplex centroid design optimization results. Table 3 shows the results of the verification analysis. Verification was evaluated based on a p-value with a 95% confidence interval. In this study, the p-value and % RSE were obtained at TPC 0.054 (18.31%), TFC 0.064 (21.59%), DPPH 0.06 (22.28%), and FRAP 0.064 (22.32%). A P-value>0.05 shows that the prediction and verification results are not significantly different, implying that the extraction optimization model is accurate. Meanwhile, the % RSE shows that the smaller the value, the more accurate the verification results.
Metabolite profiling using UPLC-QToF-MS/MS
Table 4 identified compounds based on the molecular peak, retention time, and molecular formula. Figure 5 shows the chromatogram of the UPLC-MS/MS analysis of J. gendarussa leaves extract. Table 4 shows that 62 compounds from the extract were identified based on the confirmation of ionic precursor values with the available literature. These compounds are included in the phenolic group, isoflavonoids, alkaloids, terpenoids, isoquinoline, amino benzyl alcohol derivates, pheophorbide, and compounds from other groups.
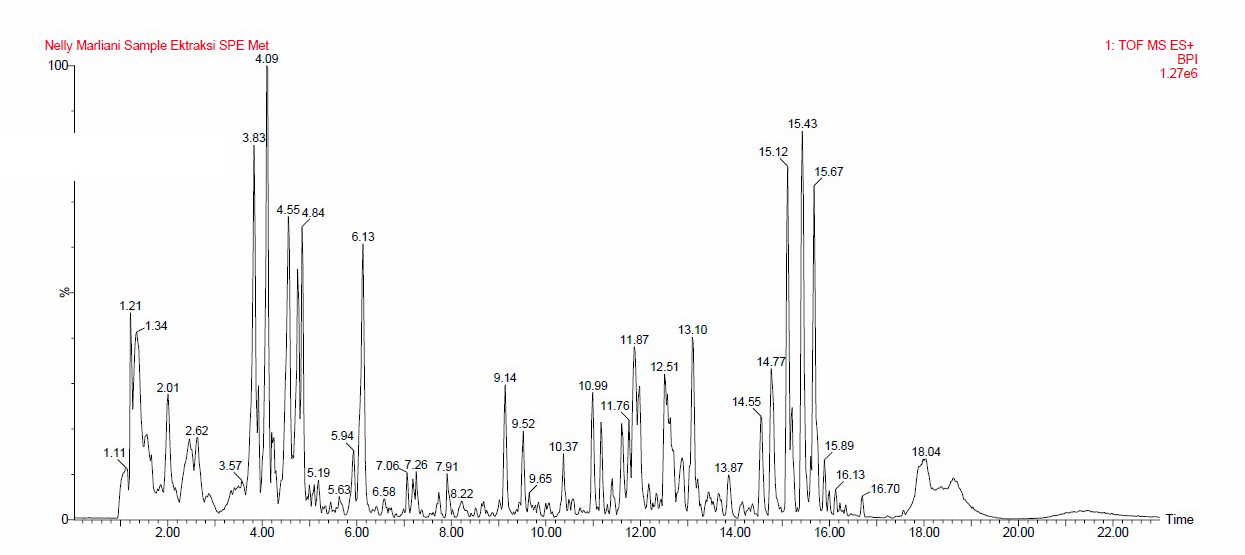
Figure 5. Chromatogram of UPLC-MS/MS leaves extract of J. gendarussa.
A study of the chemical compounds from J. gendarussa was reported to show the content of compounds from various groups such as flavonoids, terpenoids, phenol, and alkaloids (Calderόn et al., 2013; Indrayoni et al., 2016). In addition, the derivatives of amino benzyl alcohol were previously reported in the leaves of this plant (Indrayon et al., 2016; Ningsih et al., 2015).
This study identified phenolic compounds that act as antioxidants, including butylated hydroxyanisole (3-BHA), 4-aminotetrahydro-3-thiophenol-1,1-dioxide, and methyl 3-(3,5-di-tert-butyl-4-hidroksifenil) propionate. The identified isoflavonoids compound is 6-O-Acetylgenistin. Meanwhile, 1,2-di-O-methyl-4-[(2R)-2,4-dihyrobutyramido]-4,6-dideoxy-α-D-mannopyranoside, 4-nitrophenyl 2-deoxy-2-(hexanoyl amino)-β-L-glucopyranoside, N-carbamoyl-2-[(1-ethyl-1H-tetrazole-5-yl)sulfanyl] propanamide, Piperine; 2-hexyl-3,5-dipentylpyridine, Sarcotrine B, and 3-[(4-cyclohexyl-1-piperazinyl)(1-cyclohexyl-1Htetrazolel-5-yl)methyl]-6-ethoxy-2(1H)-quinolinone were identified to belong to the alkaloid group. Terpenoids compounds, includes 4-methyl-5-methylene-4(4-methyl-3-penten-1-yl)-1,3-dioxolan-2-one, 12-phenyldocecanoid acid, and (9E,12E,15E)-9,12,14-Octadecatrienoid acid. Additionally, pheophorbide A (PPBa) was contained in J. gendarussa leaves extract. This compound is a breakdown product of chlorophyll and is a derivate of pheophytin.
Table 4. Optimization solution verification results.
|
No |
Rt (min.) |
Measured Mass |
Calculated Mass |
Formula |
Weight |
Compound Name |
|
1. |
1.10 |
151.03 |
151.03 |
C4H10N2S2 |
150.265 |
2,3-Piperazinedi thiol |
|
2. |
1.21 |
156.04 |
156.04 |
C4H9NO3S |
151.18 |
4-Aminotetrahydro-3-thiophenol 1,1-dioxide |
|
3. |
1.34 |
156.04 |
156.04 |
C4H10ClNO3 |
155.58 |
Meserineinate hydrochloride |
|
4. |
1.85 |
294.15 |
294.14 |
C12H23NO7 |
293.31 |
1,2-di-O-methyl-4-[(2R)-2,4-dihydrobutyramido]-4,6-dideoxy-α-D-mannopyranoside |
|
5. |
2.00 |
415.17 |
415.17 |
C18H26N2O9 |
414.40 |
Nicametate Citrate |
|
6. |
2.46 |
166.08 |
166.08 |
C9H11NO2 |
165.18 |
4-hydroxy-1-(3-pyridyl)-1-butanon |
|
7. |
2.61 |
415.17 |
415.17 |
C18H26N2O9 |
414.40 |
Nicametate Citrate |
|
8. |
3.56 |
188.07 |
188.07 |
C11H9NO2 |
187.19 |
Methyl 3-isoquinolinecarboxylate |
|
9. |
3.82 |
399.17 |
399.17 |
C18H26N2O8 |
398.40 |
4-Nitrophenyl 2-deoxy-2-(hexanoylamino)-β-L-glucopyranoside |
|
10. |
4.09 |
399.17 |
399.17 |
C18H26N2O8 |
398.40 |
4-Nitrophenyl 2-deoxy-2-(hexanoylamino)-β-L-glucopyranoside |
|
11. |
4.19 |
307.17 |
307.17 |
C15H22N4O3 |
306.36 |
2-[4-(2-Hydroxyphenyl)-1-piperazinyl]-N-(methyl methyl carbamoyamide |
|
12. |
4.24 |
172.07 |
172.07 |
C11H9NO |
171.19 |
4-Phenyl-2-pyridinol |
|
13. |
4.55 |
206.08 |
206.08 |
C11H11NO3 |
205.21 |
Methyl 5-methoxy-1H-indole-2-carboxylate |
|
14. |
4.74 |
206.08 |
206.08 |
C11H11NO3 |
205.21 |
Methyl 5-methoxy-1H-indole-2-carboxylate |
|
15. |
4.83 |
383.18 |
383.18 |
C18H26N2O7 |
382.40 |
Dimethyl N-{[2-(3,4-dimethoxy phenyl)ethyl]carbamoy}-L-glutamate |
|
16. |
4.99 |
514.21 |
514.21 |
C26H31N3O8 |
513.54 |
1-[2,6-Dimethyl-4-(2-methyl-2-propanyl)-3,5-dinitrophenyl]-2-(4-methoxy-6-methyl-5,6,7,8-tetrahydro[1,3] dioxolo4,5-g]isoquinoli-5-yl)ethanone |
|
17. |
5.09 |
485.23 |
485.23 |
C28H37N2OSCl |
485.12 |
3-[3-(tert-butylsulfanyl)-1-(4-chlorobenzyl)-5-(propan-2-yl)-1H-indol-2-yl]-N-methoxy-2,2-dimethylpropan-1-imine |
|
18. |
5.16 |
320.15 |
320.14 |
C17H21NO5 |
319.35 |
Ethyl 5-[(1-methoxy-1-oxo-2-propanyl) oxy]-1,2-dimethyl-1H-indole-3-carboxylate |
|
19. |
5.45 |
197.11 |
197.11 |
C11H16O3 |
196.24 |
4-Methyl-5-methylene-4-(4-methyl-3-penten-1-yl)-1,3-dioxolan-2-one |
|
20. |
5.62 |
488.13 |
488.13 |
C7H23N19ClBr |
- |
Unknown |
|
21. |
5.93 |
197.11 |
197.11 |
C11H16O3 |
196.24 |
4-Methyl-5-methylene-4-(4-methyl-3-penten-1-yl)-1,3-dioxolan-2-one |
|
22 |
6.13 |
206.08 |
206.08 |
C11H11NO3 |
205.21 |
Methyl 5-methoxy-1H-indole-2-carboxylate |
|
23. |
6.57 |
475.12 |
475.12 |
C23H22O11 |
474.41 |
6-O-Acetylgenistin |
|
24. |
7.06 |
680.40 |
680.40 |
C26H60N11O3Cl3 |
- |
Unknown |
|
25. |
7.25 |
308.22 |
308.22 |
C18H29NO3 |
307.42 |
Betaxolol |
|
26. |
7.73 |
240.11 |
240.11 |
C14H13N3O |
239.27 |
4-(Imidazo[1,2-a] pyridine-7-yloxy)-2-methylaniline |
|
27. |
7.91 |
762.39 |
762.39 |
C37H60N9S3Cl |
- |
Unknown |
|
28. |
8.22 |
275.20 |
275.20 |
C18H26O2 |
274.39 |
Methyl 1,2,2-trimethyl-3-(2-phenylethyl) cyclopentanecarboxylate |
|
29. |
8.68 |
295.22 |
295.22 |
C18H30O3 |
294.42 |
Octoxynol-2 |
|
30. |
9.01 |
206.15 |
206.15 |
C13H19NO |
205.29 |
2-[Benzyl(2-methyl-2-propen-1-yl) amino]ethanol |
|
31. |
9.14 |
181.12 |
181.12 |
C11H16O2 |
180.24 |
3-BHA |
|
32. |
9.52 |
291.19 |
291.19 |
C18H26O3 |
290.39 |
4-Methoxyphenyl 4-butylcyclohexanecarboxylate |
|
33. |
9.64 |
291.19 |
291.19 |
C15H30O3S |
290.46 |
3-(Dodecylsulfiny)propanoic acid |
|
34. |
9.84 |
295.19 |
295.19 |
C18H22N4 |
294.39 |
4-(Dimethylamino) benzaldehyde ((4-(dimethylamino)phenyl)methylene)hydrazine |
|
35. |
9.99 |
245.08 |
245.08 |
C7H12N6O2S |
244.27 |
N-Carbamoyl-2-[(1-ethyl-1H-tetrazol-5-yl)sulfanyl]propanamide |
|
36. |
10.07 |
289.18 |
289.18 |
C18H24O3 |
288.33 |
10-Hydroxyestr-4-ene-3,17-dione |
|
37. |
10.37 |
286.14 |
286.14 |
C17H19NO3 |
285.33 |
Piperine |
|
38. |
10.48 |
277.21 |
277.21 |
C18H28O2 |
276.41 |
12-Phenyldodecanoid acid |
|
39. |
10.57 |
316.28 |
316.28 |
C18H37NO3 |
315.49 |
Dehydrophytosphingosine |
|
40. |
10.72 |
275.20 |
275.20 |
C18H26O2 |
274.39 |
Methyl 1,2,2-trimethyl-3-(2-phenylethyl) cyclopentanecarboxylate |
|
41. |
10.99 |
318.30 |
318.30 |
C18H39NO3 |
317.50 |
Phytosphingosine |
|
42. |
11.16 |
332.31 |
332.31 |
C19H41NO3 |
331.53 |
2,2’{[3-(Dodecyloxy)propy]imino}diethanol |
|
43. |
11.30 |
279.23 |
279.23 |
C18H30O2 |
278.43 |
(9E, 12E, 15E)-9, 12, 15-Octadecatrienoid acid |
|
44. |
11.40 |
304.30 |
304.30 |
C21H37N |
303.52 |
2-Hexyl-3,5-dipentylpyridine |
|
45. |
11.60 |
302.30 |
302.30 |
C18H39NO2 |
301.50 |
Safingol |
|
46. |
11.75 |
518.32 |
518.32 |
C33H43NO4 |
517.69 |
Sarcotrine B |
|
47. |
11.86 |
277.21 |
277.21 |
C18H28O2 |
276.41 |
12-Phenyldodecanoid acid |
|
48. |
11.98 |
277.21 |
277.21 |
C18H28O2 |
276.41 |
12-Phenyldodecanoid acid |
|
49. |
12.17 |
293.21 |
293.21 |
C18H28O3 |
292.41 |
Metilox/Metil 3-(3,5-di-tert-butil-4-hidroksifenil) propionat |
|
50. |
12.51 |
520.34 |
520.34 |
C29H41N7O2 |
519.68 |
3-[(4-Cyclohexyl-1-piperazinyl) (1-cyclohexyl-1H-tetrazol-5-yl)methyl]-6-ethoxy-2(1H)-quinolinone |
|
51. |
12.88 |
295.22 |
295.22 |
C18H30O3 |
294.42 |
Octoxynol-2 |
|
52. |
13.10 |
496.34 |
496.34 |
C12H37N19O3 |
- |
Unknown |
|
53. |
13.45 |
522.35 |
522.35 |
C25H51N3O6S |
521.75 |
N, N, N-Tributyl-1-butanaminium(2s,3s)-2-methyl-3-({[(2-methyl-2-propanyl)oxy]carbonyl}amino)-4-oxo-1-azetidinesulfonate |
|
54. |
13.88 |
623.25 |
623.25 |
C23H51N4O6S2Br |
- |
Unknown |
|
55. |
14.15 |
607.25 |
607.25 |
C23H35N14O2SCl |
- |
Unknown |
|
56. |
14.54 |
524.37 |
52.37 |
C28H58NOS2Cl |
- |
Unknown |
|
57. |
14.76 |
279.23 |
279.23 |
C18H30O2 |
278.43 |
(9E, 12E, 15E)-9, 12, 15-Octadecatrienoid acid |
|
58. |
15.67 |
593.27 |
593.27 |
C35H36N4O5 |
592.68 |
Pheophorbide A |
|
59. |
15.89 |
593.27 |
593.27 |
C35H36N4O5 |
592.68 |
Pheophorbide A |
|
60. |
16.69 |
607.29 |
607.29 |
C36H38N4O5 |
- |
Unknown |
|
61. |
18.04 |
705.50 |
705.50 |
C35H68N4O10 |
- |
Unknown |
|
62. |
18.63 |
705.50 |
705.50 |
C35H68N4O10 |
- |
Unknown |
DISCUSSION
Three solvents with different polarity properties, namely water, ethanol, and hexane, were used in this study. They delivered different responses based on the value of TPC, TFC, and antioxidant activity. The TPC results of J. gendarussa leaves extracted from a water solvent system combined with hexane generated the highest optimal response. Therefore, it was considered that the leaves contained phenolic compounds that were soluble in both polar and nonpolar solvents. Several studies showed that polar solvents have better phenolic compounds' extraction capacity than less polar solvents (Rotta et al., 2018). This is in line with the case where phenolic can be extracted optimally using hexane with a water mixture. Flavonoids are polyphenolic compounds that are polar and semi-polar (Azizah et al., 2014). These results show that semi-polar ethanol extracts flavonoids from the leaves. Previous studies showed the best extraction of flavonoids from this plant using ethanol as a solvent (Kuber, 2021).
Antioxidants are molecules that prevent free radical reactions or inhibit cell damage due to the oxidation of other molecules, which prevent mutations to macromolecules by quenching reactive oxygen species (ROS) and reducing ROS-induced oxidative damage. Antioxidants have two mechanisms of action, namely the power of reducing metal compounds and that of electron donors in inhibiting free radical molecules. DPPH test serves as a link to free radicals, while FRAP measures electron donor power. DPPH is generally a simple, fast, and inexpensive method, while the FRAP test is simple but has good sensitivity (Pal et al., 2014). In this study, the antioxidant activity according to the DPPH method showed optimal results by extraction using a hexane solvent, while it is based on the FRAP method using a mixed solvent of ethanol and hexane. Previous studies using water, ethanol, ethyl acetate, and hexane solvents reported that the ethanolic extract of J. gendarussa had the best antioxidant activity (Kuber, 2021).
Phenolic compounds and flavonoids play the role of antioxidants. In optimizing the extraction, which uses a simplex centroid design, the assessment results indicate that a mixture of water and hexane is the optimal solvent system for extracting phenolic compounds and flavonoids as antioxidants. These results are based on the desirability value, which determines the level of accuracy of the solution, with the highest value being 1.00 (Khalafyan et al., 2019).
UPLC-QToF-MS/MS combines liquid chromatography techniques with mass spectrometry detection analysis. This is a rapid high-resolution chromatographic separation with the required sensitivity. Furthermore, this method separates the sample components based on their polarity, which a mass spectrometer detector will detect. The metabolites identification showed that the phenolic compounds include isoflavonoids, alkaloids, terpenoids, acequinolines, amino benzyl alcohol derivates, pheophorbide, and compounds from other groups. A study of a chemical compound from J. gendarussa was reported to show the content of compounds from various groups such as flavonoids, terpenoids, phenols, and alkaloids (Calderon et al., 2013; Indrayoni et al., 2016). Additionally, the amino benzyl alcohol derivates were reported in the leaves of this plant (Ningsih et al., 2015; Indrayon et al., 2016).
Phenolic compounds are the largest group of compounds that act as antioxidants. They consist of one or more phenol rings, namely the hydroxyl group attached to an aromatic ring, hence, it is easily oxidized by donating hydrogen atoms to free radicals. One of these is 3 butylated hydroxyanisol (3-BHA), which is known as a phenolic antioxidant that has been widely used and extensively studied for its antioxidant potential (Williams et al.,1999; Ansar and Iqbal, 2016) Pheophorbide A (PPBa) is a derivative of pheophytin. This compound was reported in previous studies to have anti-proliferative effects on several human cancer cells and as an antioxidant (Saide et al., 2020).
CONCLUSION
The simplex centroid design optimized the extraction of J. gendarussa leaves through the response of TPC, TFC, and antioxidant activity based on the DPPH and FRAP mechanisms. The results showed that TPC had 112.076 mg GAE/g with a water-hexane binary mixed extraction system, TFC had 34.926 mg QE/g with ethanol, and hexane was the best solvent for extraction. FRAP had 353,611 µmol TE/g with an ethanol-hexane binary mixed extraction system. Furthermore, the extraction optimization solution obtained is a water-hexane binary combination solvent of 75,226 mL and 74,774 mL, respectively, with a desirability level of 0,884. Based on UPLC-MS/MS, 62 metabolites were identified from various phenolics, isoflavonoids, alkaloids, terpenoids, alcohols, and other groups of compounds.
ACKNOWLEDGEMENTS
The authors are grateful to the Ministry of Education, Culture, Research, and Technology of Indonesia in Penelitian Dasar Kompetitif Nasional grant (No: 3615/IT3.L1/PT.01.03/P/B/2022) for the support rendered during this study.
REFERENCES
Akanda M.R., Uddin, M.N., Kim, I.S., Ahn, D., Tae, H.J., Park, B.Y. 2019. The biological and pharmacological roles of polyphenol flavonoid Italiani. European Journal of Pharmacology. 842: 291–297.
Ansar, S., and Iqbal, M. 2015. Antioxidant and nephroprotective potential of butylated hydroxy anisole against ferric nitrilotriacetate-induced oxidative stress and early tumor events. Human and Experimental Toxicology. 35: 448–453.
Azizah, D.N., Kumulowati, E., Farmayunda, F. 2014. Penetapan kadar flavonoid metode AlCl3 pada ekstrak metanol kulit buah kakao (Theobroma cacao L.). Jurnal Ilmu Farmasi. 2: 45–49.
Calderόn, A.I., Hodel, A., Wolfender, J.L., Gupta, M.P., Correa, M., Hostettmann, K. 2013. LC-DAD-MS-based metabolite profiling of three species of Justicia (Acanthaceae). Natural Product Research. 27: 1335–1342.
Indrayoni, P., Purwanti, D.I., Wongso, S., Prajogo, B.E.W., Indrayanto, G. 2016. Metabolite profiles in various plant organs of Justicia gendarussa Burm.f. and its in vitro cultures. Scientia Pharmaceutica. 84: 555–566.
Khalafyan, A.A., Temerdashev, Z.A., Yakuba Y.F., Guguchkina T.I. 2019. Computer analysis of the sensory qualities of red wines as a method to optimize their blend formulation. Heliyon. 5: e01602.
Kuber, B.R. 2021. In vitro antioxidant potential, total phenolic, and flavonoid contents in Justicia gendarussa leaf extract. Research Journal of Pharmacy and Technology. 14: 2707.
Li, A.N., Li, S., Zhang, Y.J., Xu, X.R., Chen, Y.M., Li, H.B. 2014. Resources and biological activities of natural polyphenols. Nutrients. 6: 6020–6047.
Lopes, A.P., Patenuci, M.E., Galuch, M.B., Schneider, V.V.A., Canesin, E.A., Visentainer, J.V. 2018. Evaluation of effect of different solvent mixtures on the phenolics compound extraction and antioxidant capacity of biter melon (Momordica charantia). Chemical Papers Springer. 72: 2945–2953.
Mnatsakanyan, M.M., Quiroz, E.F., Marcourt, L., Prajoho, B.E., Wolfender, J.L. 2018. Quantitative evaluation of various preparations and extracts of the male contraceptive Justicia gendarussa and identification of a new aminobenzyl derivate. Planta Medica International Open. 5: e30–e38.
Munhoz, V.M., Longhini, R., Souza J.R.P., Zequi J.A.C., Mello, E.V.S.L., Lopes, G.C., Mello, J.C.P. 2014. Extraction of flavonoids from Tagetes patula: process optimization and screening for biological activity. Brazilian Journal of Pharmacognosy. 24: 576–583.
Nimse, S.B., Pal, D. 2015. Free radicals are natural antioxidants and their reaction mechanisms. RSC Advances. 5: 27986-28006.
Ningsih, I.Y., Purwanti, D.I., Wongso, S., Prajogo, B.E., Indrayanto, G. 2015. Metabolite profiling of Justicia gendarussa Burm.f. leaves using UPLC-UHR-QToF-MS. Scientia Pharmaceutica. 83: 489–500.
Nurcholis, W., Qomaliyah, E.N., Artika, I.M. 2019. Optimization of extraction process for extract yields, total flavonoid content, radical scavenging activity and cytotoxicity of Curcuma aeruginosa roxb. rhizome. International Journal of Research in Pharmaceutical Sciences. 10: 1650–1659.
Pal, M., Misra, K., Dhillon, G., Brar, S.K., editors. 2014. Antioxidants. Biotransformation of waste biomass into high value biochemical. New York: Springer New York, NY. 504 p.
Raghu, M.G., and Agrawal, P. 2016. The isolation and structural determination of flavonoids from Justicia gendarussa. Journal of Pharmacy and Biological Sciences. 11: 73–79.
Rajbhar, K., Dada, H., Mukundan. 2015. Polyphenols: methods of extraction. Scientific Reviews & Chemical Communications. 5: 1–6.
Rotta, E.M., Haminuk, C.W.I., Maklaner, L., Visentainer, J.V. 2017. Determination of antioxidant activity and phenolic compounds of Muntingia calabura Linn. peel by HPLC-DAD and UPLC-ESI-MS/MS. International Journal of Food Science and Technology. 52: 954–963.
Saide, M., Lauritano, C., Lanora, A. 2020. Pheophorbide a: state of the art. Marine Drugs. 18(5): 257.
Setyowati, F.M., Wardah. 2010. Utilization of traditional medicine as stamina enhancer in Sundanese communities at cicemet village Banten Kidul. p.476-482. In: Widjajakusuma, E.C. [eds] Proceedings of International Conference on Medicinal Plants. 21-22 July 2010, Surabaya, Indonesia.
Shamili, G., and Santhi, G. 2019. Identification and characterization of bioactive compounds of leaves of Justicia gendarussa Burm.f. International Journal of Scientific Research in Biological Sciences. 6: 145–153.
Somprasong, W., Vjarodaya, S., Chayamarit, K. 2014. Taxonomic study of the family acanthaceae used as traditional medicinal plants fot ethnic groups in Nort, Central and Northeastern Thailand. Thailand Agricultural Research Journal. 32: 77-88.
Tiaraswara, R.A., Taufik, Y., Afrianti, L.H. 2016. Optimalisasi formulasi hard candy ekstrak daun mulberry (morus sp.) dengan menggunakan design expert metode D-optimal [thesis].[Bandung]: Universitas Pasundan Bandung. Available from https://onesearch.id/Record/IOS3183.3613
Wibisono, K., Aisyah, S.L., Suhesti, S., Nurcholis, W. 2019. Optimization of total flavonoids extraction and α-glucosidase inhibitory activity from Plectranthus ambonicus (lour.) spreng leaves using the simplex centroid design. Molekul. 14: 84–91.
Widodo, A., Widiyanti, P., Prajogo, B. 2018. Antiviral activity of Justicia gendarussa Burm.f leaves against HIV-infected MT-4 cells. African Journal of Infectious Disease. 12: 36–43.
Williams, G.M., Latropoulos, M.J., Whysner, J. 1999. Safety assessment of butylated hydroxy anisole and butylated hydroxytoluene as antioxidant food additives. Food and Chemical Toxicology. 37: 1027–1038.
Zhang, H., Xia, Z., Xu, T., Chen, Y., Zhou, G. 2020. New compounds from the aerial parts of Justicia gendarussa Burm.f and their antioxidant and anti-inflammatory activities. Natural Product Research. 35: 3478–3486.
Zhang, Q.W., Lin, L.G., Ye, W.C. 2018. Techniques for extraction and isolation of natural products: a comprehensive review. Chinese Medicine. 13: 1-26.
OPEN access freely available online
Chiang Mai University Journal of Natural Sciences [ISSN 16851994]
Chiang Mai University, Thailand.
https://cmuj.cmu.ac.th
Nelly Marliani1, I Made Artika1, and Waras Nurcholis1, 2, *
1 Department of Biochemistry, IPB University, Dramaga Bogor, 16680 West Java, Indonesia.
2 Tropical Biopharmaca Research Center, IPB University, Taman Kencana Bogor, 16128 West Java, Indonesia.
Corresponding author: Waras Nurcholis, E-mail: wnurcholis@apps.ipb.ac.id
Total Article Views
Editor: Wasu Pathom-aree,
Chiang Mai University, Thailand
Article history:
Received: March 11, 2022;
Revised: May 27, 2022;
Accepted: June 8, 2022;
Published online: June 14, 2022