 ISSN: 2822-0838 Online

A Comparison of the Three Upwelling Indices in the South Java Sea Shelf
Asep Sandra Budiman*, Dietriech Geoffrey Bengen, I Wayan Nurjaya, Zainal Arifin, and Mochamad Furqon Azis IsmailPublished Date : 2022-07-11
DOI : https://doi.org/10.12982/CMUJNS.2022.044
Journal Issues : Number 3, July-September 2022
Abstract Upwelling plays a crucial role in driving cross-shelf circulation between the continental shelf and boundary currents. It is well known that upwelling results in the exchange of heat, nutrients, fish larvae, and other properties. It controls primary productivity, which promotes higher trophic levels and fisheries. Upwelling can be identified by at least three physical variables: wind, sea surface temperature (SST), and chlorophyll-a (Chl-a). The intensity of upwelling can then be calculated using the Upwelling Index (UI), which is based on these three variables. Wind-based UI (UIET), SST-based UI (UISST), and Chl-a-based UI (UICHL) were calculated using satellite-derived and reanalysis data from 2002 to 2017. Those three UIs were analyzed spatially and temporarily to determine the differences in upwelling strength and duration. The most appropriate UI for explaining the South Java upwelling system in our domain was determined through the correlation analysis. The monthly mean climatology of all UI (UIET, UISST, and UICHL) reveals the seasonal variation, which is high during the southeast (SE) monsoon. The strongest correlation between UISST and Chl-a with the smallest lag times suggested that South Java upwelling in our domain can be identified better using SST-based UI (UISST) than through the Ekman mass transport-based UIET, particularly in the east, relevant to the earlier study.
Keywords: Chlorophyll-a, Upwelling Indexes, South Java Upwelling
Funding: The study was fully funded by LIPI’s COREMAP CTI 2021 2022 (17/A/DK/2021).
Citation: Budiman, A.S., Bengen, D.G., Nurjaya, I.W., Arifin, Z., and Ismail, M.F.A. 2022. A comparison of the three upwelling indices in the South Java sea shelf. CMU J. Nat. Sci. 21(3): e2022044.
INTRODUCTION
The southern Java coast (SJC) is the eastern boundary upwelling system in the Indian Ocean (Kämpf et al., 2016). The region is well-known for its strong seasonal primary production, which is fueled by nutrient-rich water upwelling (Bray et al., 1996; Budiman et al., 2021; Susanto et al., 2001; Wyrtki, 1962). Satellite-derived SST and surface Chl-a data show that the decrease in SST off Java during the southeast monsoon is associated with the upwelling of nutrient-rich subsurface water supporting high primary productivity (Asanuma et al., 2003; Susanto et al., 2006). According to Antoine et al. (1996), the SJC waters become mesotrophic during the upwelling season and even eutrophic (Chl-a > 1 mg.m-3 at the upper layer) under certain conditions when the upwelling event coincides with positive IOD, as reported by (Iskandar et al., 2009).
Located between two oceans, which are the Indian ocean and the Pacific ocean, the strength of the South Java upwelling can be affected by oceanic and atmospheric dynamics such as monsoons (Wyrtki, 1962; Duan et al., 2019), tides (Ffield and Gordon, 1996; Rudiastuti et al., 2019), the Madden-Julian Oscillation (MJO) (Duan et al., 2019), Kelvin and Rossby waves (Cipollini et al., 2001; Iskandar, 2005; Menezes and Vianna, 2019; Pujiana and McPhaden, 2020; Syamsudin, 2004), the Pacific to Indian ocean water masses flowing through the Indonesian archipelagos called the Indonesian Through Flow (ITF) (Cipollini et al., 2001; Menezes and Vianna, 2019), the South Java Coastal Current (SJCC) (Soeriaatmadja, 1957; Quadfasel & Cresswell, 1992; Sprintall et al., 1999; Gingele et al., 2002; Iskandar et al., 2006; Utari et al., 2019), South Equatorial Current (SEC) (Ningsih et al., 2020), eddies (Iskandar et al., 2006; Yang et al., 2019; Ismail et al., 2021), marine heatwaves (Iskandar et al., 2021), the Indian Ocean Dipole (IOD) (Saji et al., 1999; Gualdi et al., 2003; Wirasatriya et al., 2020), and El Niño/Southern Oscillation (Susanto and Gordon, 2001; ENSO; e.g. Gualdi et al., 2003; Susanto et al., 2006). In terms of eddies, the SJC is highly dynamic and frequently occupied with locally generated eddies that contribute to the export transport of high biological productivity offshore (Yang et al., 2019; Ismail et al., 2021). Yang et al. (2019) showed that high Chl-a (>0.2 mg.m-3) was present within 200 km off the coast of Java during the non-upwelling season and spread to more than 1,000 km offshore during the upwelling season.
The upwelling intensity or strength can be determined classically through the wind-based upwelling index (UIET) interpreted as the water flux transported offshore by the wind stress from the coast. (Wirasatriya et al., 2020) discovered that the Ekman mass transport along the South Java coast was weaker in the east (longitude > 108˚E, coincident with our domain) than in the west, indicating weaker wind blows. Although it has been widely used, this technique has limitations, i.e., it does not consider the bathymetry of the shelf and, in turn, it cannot render the complexity of the two-dimensional spatial structure of the upwelling such as coastal upwelling cells, cape effects, and filaments (Aïssa et al., 2014). Another technique to explain the upwelling intensity is the SST-based upwelling index (UIsst). This technique arose because the surface cooling of the upwelled water reaching the sea surface is a potential proxy of the upwelling intensity. Naulita et al. (2020) showed that the eastern part of their domain (> 108˚E) shows a large gradient of thermal difference, indicating higher UISST, but has the lowest value of UIET. Meanwhile, the chlorophyll-a-derived upwelling index was determined by applying a threshold that distinguishes between high concentrations of Chl-a when upwelling occurs and its low concentration when there is no upwelling. This UI-based Chl-a has been applied by Ismail et al. (2019) in their study by using a 0.2 mg.m-3 Chl-a threshold. We hypothesize that there are differences in upwelling intensity or strength in the western and eastern parts of our study domain.
Although many researchers have focused on South Java upwelling, studies of upwelling comparisons in the shelf area, particularly by analyzing the upwelling index based on Chl-a, wind, and SST, have not yet been conducted. Dewi et al. (2020) used only UISST to investigate the South Java upwelling characteristics during ENSO. Naulita et al. (2020) analyzed the South Java Upwelling Index based on wind and SST in the region between 106 and 114˚E. Here, we go inside to the shelf area for the first time. The Java upwelling index will be investigated by involving three variables: wind, SST, and Chl-a.
The paper aims to determine three upwelling indices, i.e., UIET, UISST, and UICHL along the South Java Sea shelf, describe the spatial and temporal variation, and find the most appropriate UI to identify the upwelling event.
MATERIAL AND METHODS
General features of the study area
The study site spanned longitudinally from 107˚E to 114˚E (Figure 1), including the recently investigated upwelling region (Horii et al., 2018; Wirasatriya et al., 2020). The continental shelf (hereinafter called the shelf) presents different dimensions along the South Java coast. The Cilacap coast shows the widest shelf (125 km from the coast), followed by the Kretek coast (75 km) and the Prigi coast (50 km). The eastern region has the narrowest shelf (10 km; Figure 1). The circulation is influenced by the oceanic and atmospheric dynamics as described above.
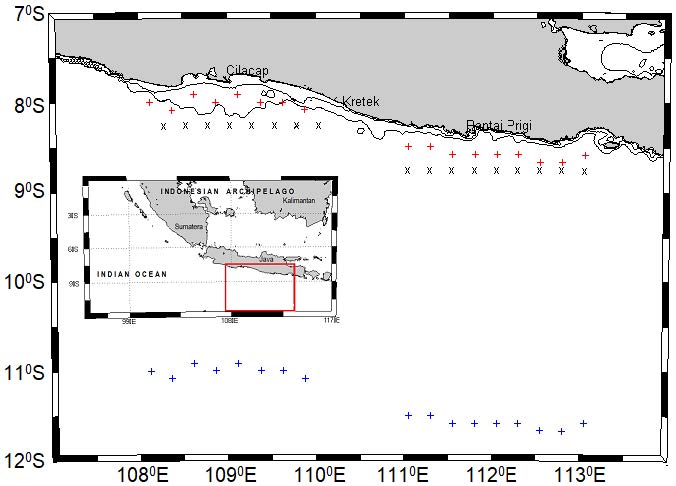
Figure 1. Study domain of the southern Java coast from 107 to 114 ºE.
x = wind data for Ekman calculation, + = chlorophyll-a and SST data in the coastal, and + = SST data offshore/oceanic. Inset is our domain among the Indonesian islands. Isobaths 40-200 m (shelf area) drawn by contour lines.
Data
Data from the daily global L4 ocean color satellite remotely sensed Chl-a (mg.m-3) was obtained from https://resources.marine.copernicus.eu/. The Chl-a data has a spatial resolution of about 4 km, covering the period of 2002–2017. These Chl-a products (Daily, Monthly, and Climatology) are the result of a collaboration between the sensors SeaWiFS, MODIS, MERIS, VIIRS-SNPP & JPSS1, and OLCI-S3A & S3B. The application of remotely sensed Chl-a data is limited in shallow coastal shelf water due to a range of factors, including bottom albedo, suspended sediment, and coastal turbidity (Moses et al., 2011). Everett et al. (2014) eliminated the effect of land or riverine inputs to Chl-a in the coastal zone by removing or masking the 4 km of near-coast concentration, while Ismail et al. (2019), and Brieva et al. (2015) limit the interpretation and analysis to water deeper than 40 m. Here, the limitation of remotely sensed Chl-a concentration was considered by taking the pixel of the Chl-a deeper than 40 m for further analysis.
Physical variables
Physical variables that promoted Chl-a variations through the upwelling process in our domain considered both the driver and the response of the South Java upwelling system. The driver was wind, while the response was sea surface temperature (SST). The 10-m daily wind data were derived from an ERA5, the fifth generation European Centre for Medium-Range Weather Forecasts (ECMWF) atmospheric reanalysis of the global climate from 2002 to 2017. The product has a 25 km spatial resolution and can be downloaded from https://doi.org/10.5065/BH6N-5N20. The sea surface temperature (SST) obtained from GLOBAL_REANALYSIS_PHY_001_030 (Fernandez & Lellouche, 2018) was distributed through the Copernicus Marine Environment Monitoring Service (CMEMS), a global ocean eddy-resolving (1/12° horizontal resolution, approximately 8 km, and 50 vertical levels) reanalysis covering the altimetry era 1993-2018. This product can be downloaded from https://resources.marine.copernicus.eu/.
Statistical analysis and data processing
The Upwelling Index is derived from wind data (UIET) and calculated as the Ekman transport, which is defined as the transport component in the direction perpendicular to the shoreline by the following formulation:'
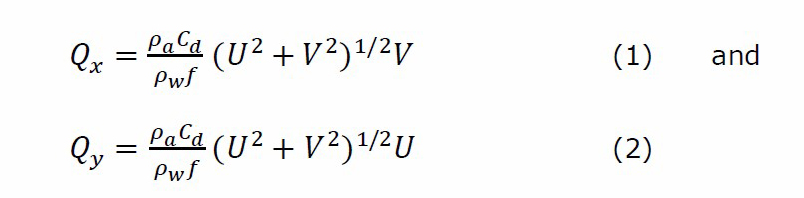
Where Qx, Qy are Ekman transport coefficients in the x and y directions, ρa is the density of air with 1.22 kg m-3, and Cd is a velocity-dependent drag coefficient (1.4 x 10⁻³) (Wood et al., 2012), where ρw is the density of water (1,025 kg m-3), and f is the Coriolis parameter, defined as twice the vertical component of the Earth’s angular velocity given by f=2ωsin (θ) at latitude θ. U and V correspond to the zonal and meridional components of wind. Although the southern Java coast of our domain changes slightly from the western to eastern, it can be considered macroscopically parallel to the equator. Thus, we only use it to define Ekman transport. Negative (positive) can be directly considered as the upwelling (downwelling) favorable UIET along the coast. We use a threshold of 16 m3.s-1.km-1 for UIET to define the upwelling event as applied by Alvarez et al. (2011), where the value below the threshold represents calm wind conditions (intensity < 1 m.s-1 ).
The SST Upwelling Index (UISST) is calculated as the SST difference between coastal and oceanic points at the same longitude (Alvarez et al., 2011; Kunarso et al., 2020; Naulita et al., 2020). As Alvarez et al. (2011) applied for their longitudinal analysis, the oceanic points are located approximately 3° southward from the coast. We use an SST anomaly threshold of -0.48°C to define the upwelling or "cold" event as applied earlier by (Atmadipoera et al., 2020).
An Upwelling Index derived from Chl-a (UICHL) was obtained by examining the Chl-a higher than its background value (high Chl-a event). A threshold of 0.2 mg m-3 was used for its background value as applied earlier (Ismail et al., 2019; Yang et al., 2019).
All those three UIs were analyzed temporarily by calculating the monthly climatology to describe the variations and evolution at several points. The points were chosen on the shelf geometrically parallel to the equator for a better result in applying the offshore Ekman transport component (in this case, Qy). For this, the domain was separated into two regions: the western side spanned longitudinally between 108°E and 110°E, and the eastern side spanned from 111°E to 113°E. The UIET was obtained and analyzed at 17 points (western: 8 points, eastern: 9 points), the UISST was obtained and analyzed at 17 points (western: 8 points, eastern: 9 points), and the UICHL was obtained and analyzed at 20 points (10 points on each side) (Figure 1).
Upwelling occurrences can also be studied by considering the mean number of days per month under upwelling favorable conditions (Ismail et al., 2019; Alvarez et al., 2011). For this, we use a threshold value for each UI at the control points (UIET at 109°E, 8.25°S and 112°E, 8.75°S; UISST at 108.83°E, 8°S and 112°E, 8.58°S; and UICHL at 108.90°E, 7.97°S, and 111.81°E, 8.48°S) to define the favorable upwelling as described above. Finally, to better understand the correlation between all those three UIs and to find the most appropriate UI for explaining the South Java upwelling, the Cross Correlation analysis was performed on the daily mean climatology data of three UIs at three control points as applied for determining the upwelling occurrence day.
In order to obtain good results and avoid bias in the analysis results between SST and Chl-a, these two variables were extracted at the same point. To do so, we re-gridded the data to the lowest resolution. In this case, Chl-a data with a resolution of 4 km was re-gridded to a resolution of SST (8 km). As a result, we have the same SST and Chl-a extraction points as shown in Figure 1. This method has been well implemented by Corredor-Acosta et al. (2020) to analyze the prominent factors promoting low or high Chl-a values by re-gridding all variables in their study to 25 km (wind data resolution).
RESULTS
Wind-based Upwelling Index (UIET)
The interannual evolution of UIET (Figure 2A, B) generally shows the seasonal variation of UIET on both sides of a positive signal (UIET > 0) or downwelling favorable condition in an early year, about December to March each year, known as the northwest (NW) monsoon in our region. Negative signals (UIET < 0) or upwelling favorable can be found in the middle to the end of the year from May until November each year, reaching the lowest peak in June until August, namely the southeast (SE) monsoon. Generally, it can be seen that the pattern was the same on both sides. The interannual evolution of the spatially averaged (Figure 2C, D) reveals the seasonal pattern with more upwelling favorable conditions in the SE monsoon (June to August) for each year along with our domain.
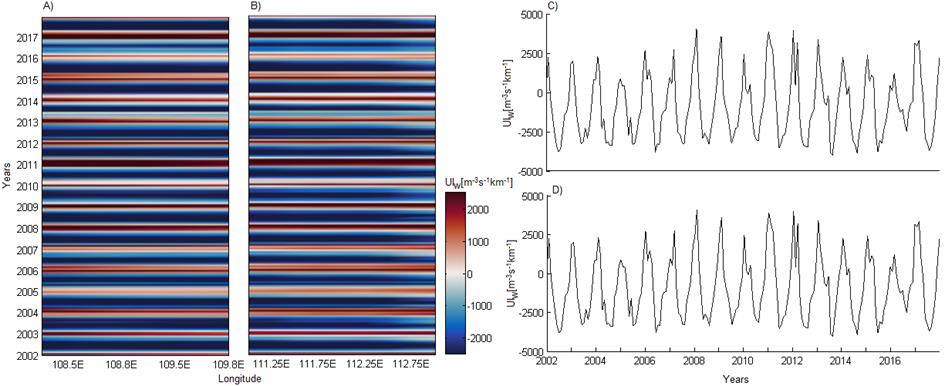
Figure 2. The interannual evolution of UIET (A, B) and its spatially averaged (C, D) values from 2002 to 2017 along the western (A, C) and eastern (B, D) parts of our domain on the southern Java coast.
The monthly mean climatology of UIET clearly shows that the positive UIET (downwelling-favorable) occurs in December-March (NW monsoon), while the negative UIET (upwelling-favorable) occurs in May-September (SE monsoon) (Figure 3A, B). Spatially averaged UIET reveals positive values in December-March with maximum values in January, while negative values occur in April-November with minimum values in July-August (Figure 3C, D). The absence of the UIET signal occurs in the middle of March and November (white shading in Figure 3A, B).
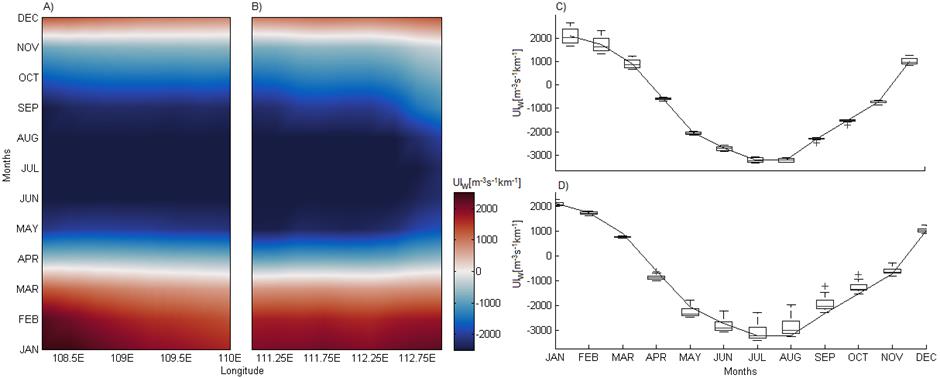
Figure 3. Monthly mean climatology (A, B) and spatially averaged monthly mean climatology (C, D) at the western (A, C) and eastern (B, D) points of UIET from 2002 to 2017.
SST-based Upwelling Index (UISST)
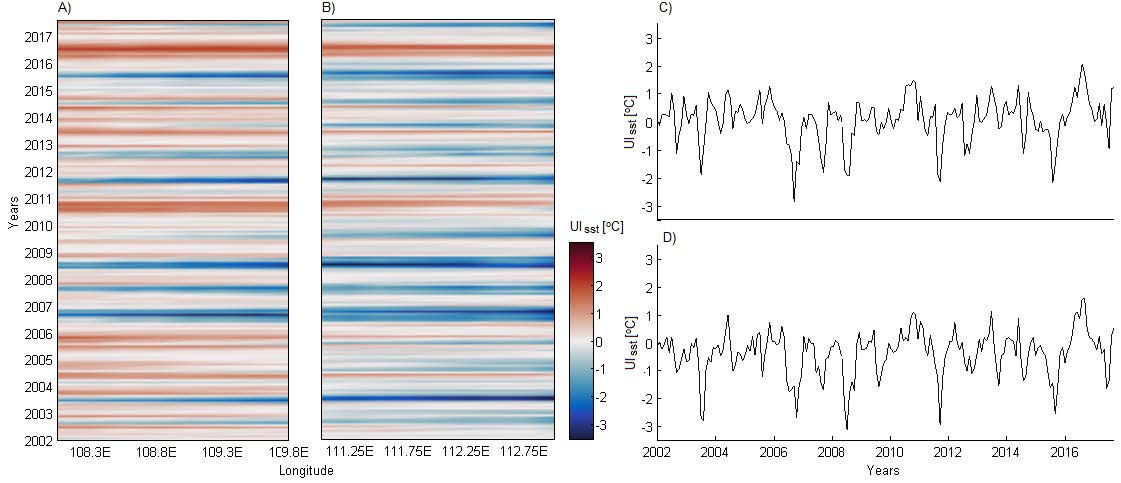
Figure 4. The interannual evolution of UISST (A, B) and its spatially averaged (C, D) values from 2002 to 2017 along the western (A, C) and eastern (B, D) parts of our domain on the southern Java coast.
The monthly mean climatology of UISST reveals that the eastern points have a longer duration of cold SST (May-November) than the western points (June-October). The colder SST (UISST<0) started to occur at the end of May at the easternmost point, while it occurs at the end of June at the westernmost point (Figure 5A, B). The cold-water boundary was widest at the easternmost point, then it gradually narrows towards the west, indicating a longer duration of upwelling favorable SST on the east side. The pattern of cold water (blue shading) forms a horizontally funnel-like that is increasingly conical to the west, as shown in Figures 5A and 5B. The spatially averaged UISST on both sides shows the most obvious differences between coastal and oceanic points and represents the coldest SST near the coast from July to September (Figure 5C, D), peaking in September (August) on the western side (the eastern side). This result reveals that the eastern points are cooling about 1 month earlier than the western points.
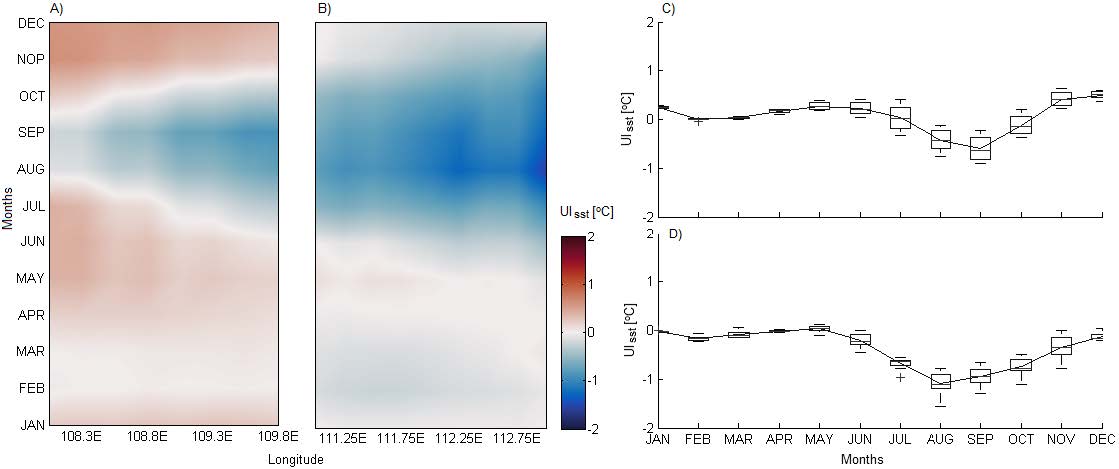
Figure 5. Monthly mean climatology of UISST (A, B) and spatially averaged monthly mean climatology of UISST (C, D) at the western (A, C) and eastern (B, D) points from 2002 to 2017.
Chl-a - based Upwelling Index (UICHL)
The interannual of Chl-a exhibits a seasonal pattern on both sides, with the highest Chl-a concentration values occurring in the middle to near the end of the year or during the SE monsoon, approximately June to November each year (> 1.5 mg.m-3 ) and the lowest at the beginning of the year or during the NW monsoon, approximately December to March each year (1 mg.m-3 ) (Figure 6A, B). This seasonal pattern was more pronounced on the plot of spatially averaged Chl-a at both sides of the points (Figure 6C, D). There are several striking features, some of which are: From January to June, Chl-a was lower than the background value of 0.2 mg.m-3 along longitude 108.3 E. The Chl-a was the highest and had the longest duration (the highest peak in Figure 6C, D, and the thickest yellow band in Figures 6A, B, respectively) during the SE monsoon in 2006, the appearance of some peaks that were higher during the SE monsoon in 2007, 2008, and 2015 than others, and the lowest peaks in 2010 and 2016.
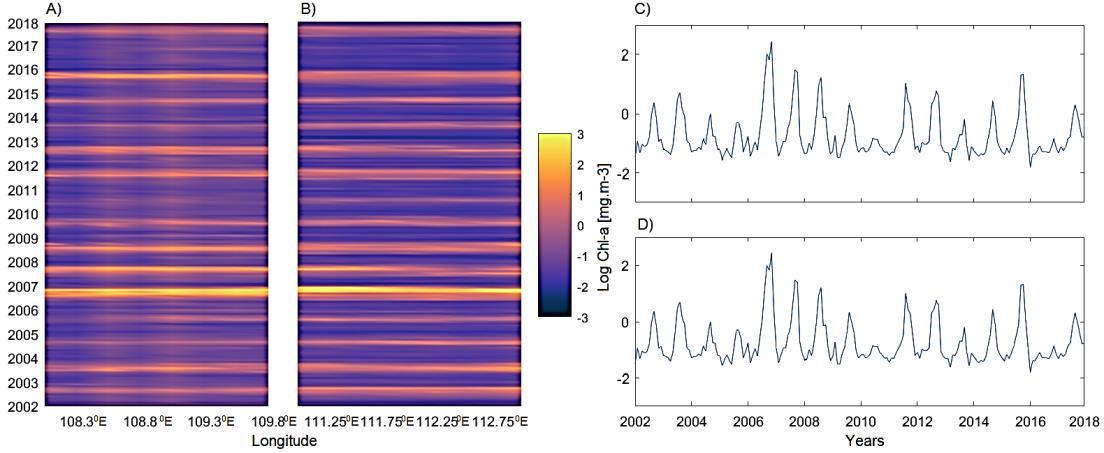
Figure 6. The logarithmic evolution of UICHL (A, B) and its spatially averaged (C, D) along the western (A, C) and eastern (B, D) boundaries of our domain on the southern Java coast from 2002 to 2017. The line parallel to the x-axis in Figures C and D denotes the threshold value of UICHL of 0.2 mg.m-3.
The monthly mean climatology shows that the Chl-a was higher than its background value (0.2 mg.m-3) throughout the year at most of our points of analysis, except at the westernmost point (108˚E) and along 112–112.5˚E from December to May and from the middle of January to the end of March, respectively (Figure 7A, B). The spatially averaged clearly shows that Chl-a was lower in December-March, higher in June-November, and highest in September on both sides (Figure 7C, D)
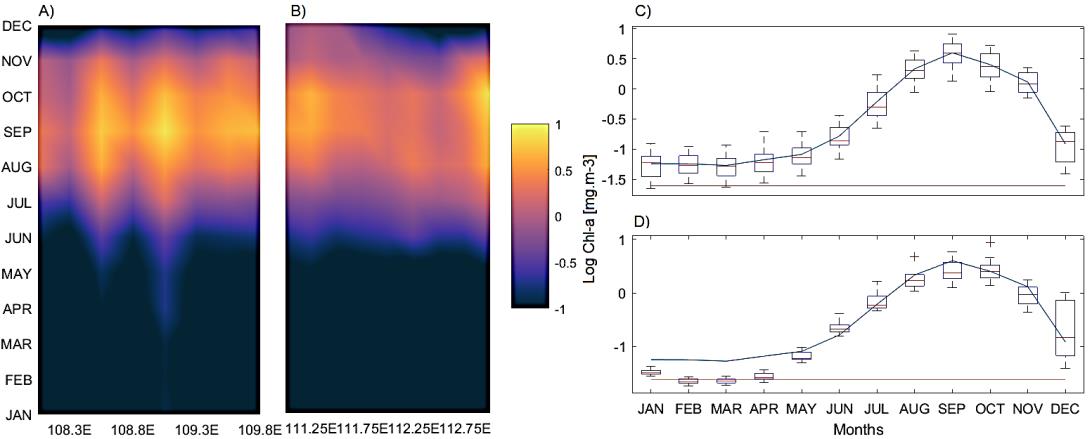
Figure 7. Monthly mean climatology of UICHL (A, B) and its spatially averaged climatology (C, D) from 2002 to 2017 at western (A, C) and eastern (B, D) points. The line parallel to the x-axis in Figures C and D denotes the threshold value of UICHL of 0.2 mg.m-3.
The number of upwelling-favorable days
The number of consecutive days under upwelling favorable conditions (UIET < 16 m3 s-1 km-1) on both sides shows that the Ekman transport upwelling favorable conditions start to occur in April, about 22 days on average, and around one month in March until October (30 – 31 days) (Figure 8A, B). From December to February, the absence and minima value of upwelling-favorable occur. However, high resistivity zones (Figure 11c) appeared on the x-position ranged from 4 m to 101 m distance along the profile at depth y, of 28 m. These regions have resistivity values ranging from 2756 Ωm to 37843 Ωm. The zones were appeared to be partially weathered basement rock. This procedure led to development of geologic section as given in Figure 11(d).
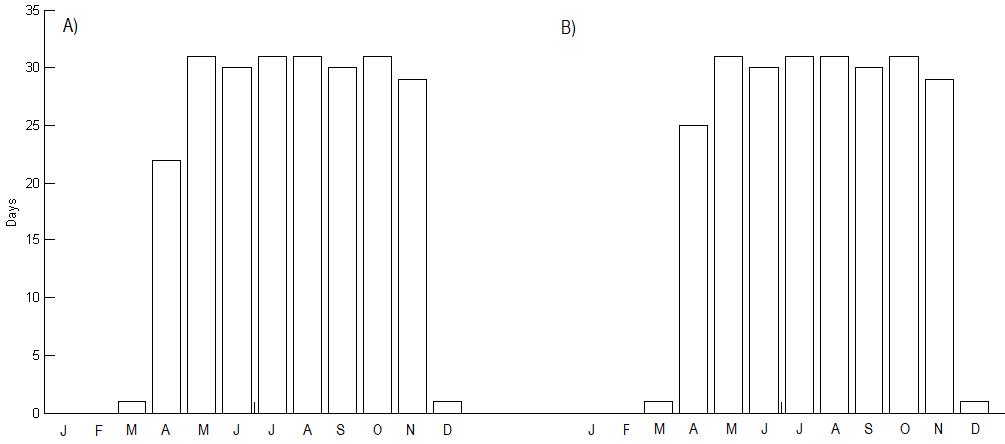
Figure 8. Average number of days per month with UIET=16 m3 s-1 km-1 at 109°E, and-8.25°S (A) and 112°E, and 8.75°S (B) from 2002 to 2017.
By using the UISST threshold of-0.48 C, the number of consecutive days under upwelling favorable conditions occurs only in two months (August and September) at the western points with the highest number of upwelling days in September (20 days) (Figure 9A). Meanwhile, the eastern points have a higher number of consecutive days under favorable conditions than the western points. Upwelling favorable conditions occur for a whole month from July to November (30–31 days) (Figure 9B).
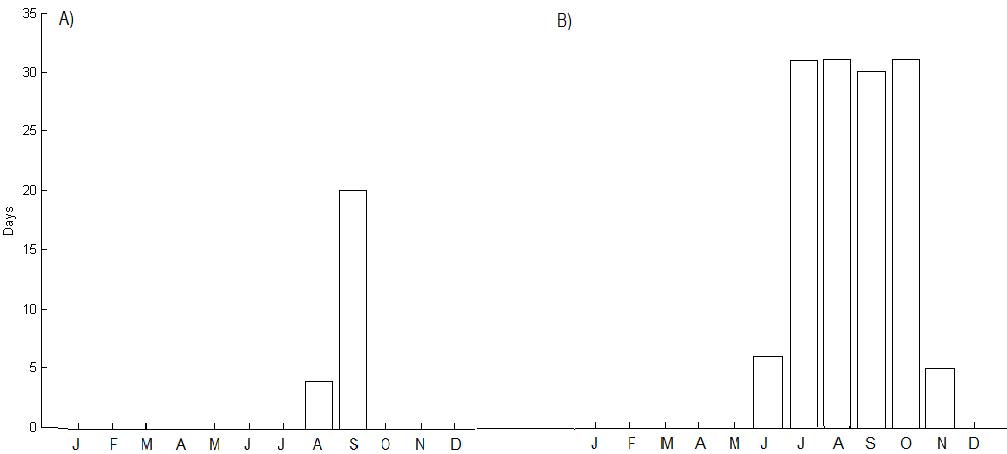
Figure 9. Average number of days per month based on the UISST threshold of -0.48˚C at 109°E, and-8.25°S (A) and 112°E, and 8.75°S (B) from 2002 to 2017.
According to the result, since the Chl-a at most of the points was above the background value of 0.2 mg.m-3 throughout the year, then the number of days with high Chl-a was obtained by applying the background value of 0.5 mg.m-3. A high Chl-a (Chl-a > 0.5 mg.m-3) occurs for about one month (30–31 days) in August-September, and it was absent in January-April on both sides (Figure 10A, B). At the eastern points, the high Chl-a event occurs two month earlier (1 days in May) than the western points (26 days in June). In June and December, it occurs more frequently at the eastern points (18 days and 10 days, respectively) than at the western points (0 days).
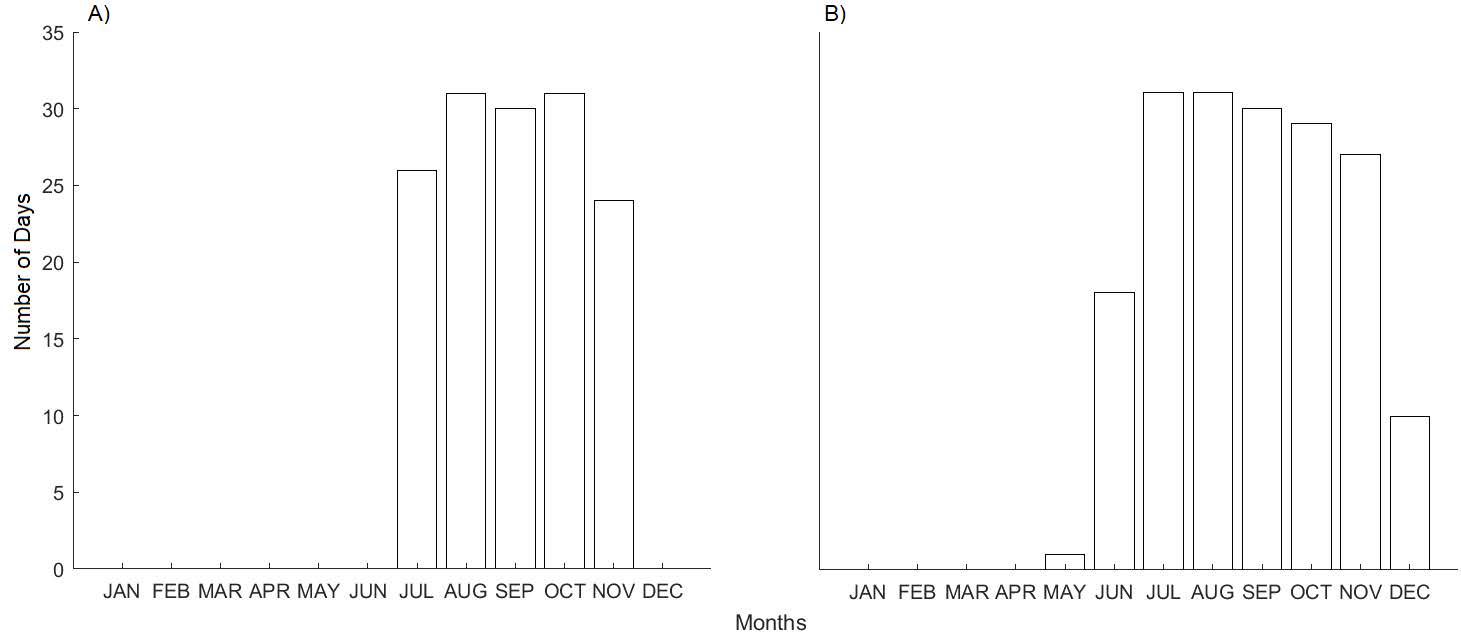
Figure 10. The number of days with a high Chl-a concentration based on the UICHL threshold of 0.5 mg.m-3 at at 109°E, and-8.25°S (A) and 112°E, and 8.75°S (B) from 2002 to 2017.
Correlation between all UIs
The cross correlation analysis revealed that UIET led UICHL by about 49–52 days at the western points and about 59–64 days at the eastern points, with a negative correlation of -0.64 and -0.66 respectively (Figure 11A, B). It means that an above-average value of Ekman transport offshore leads to an above-average value of chlorophyll-a concentration by about 49–52 days (59-64 days) at the western points (eastern points). UISST was 8–12 days ahead of UICHL in the west and 6–12 days ahead of UISST in the east, with a negative correlation of -0.63 and -0.74 respectively (Figure 11C, D). In other words, an above-average temperature difference between the coastal and oceanic points (the cooler the coastal area) is likely to lead to an above-average value of chlorophyll-a concentration by about 8–12 days (6-12 days) at the western points (eastern points).
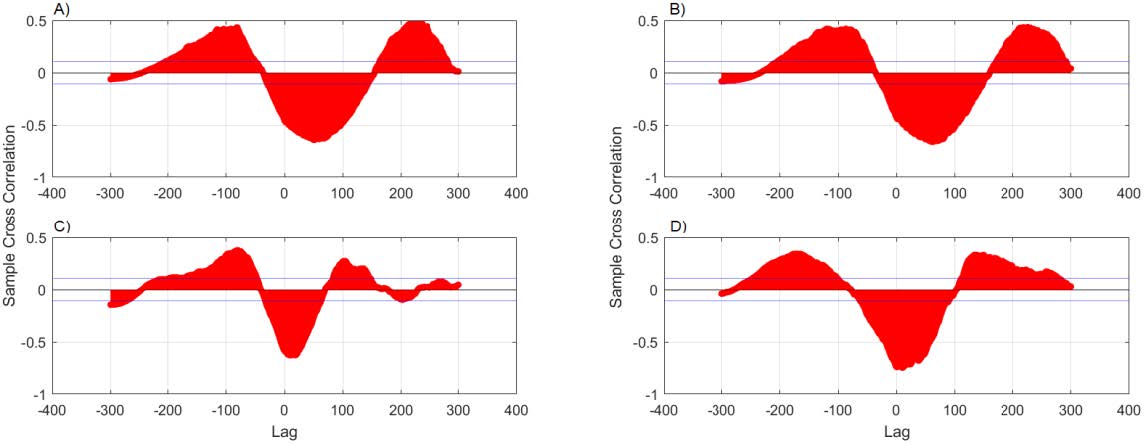
Figure 11. Cross correlation results between UIET and UICHL (A, B) and between UISST and UICHL (C, D) at the western (A, C) and eastern (B, D) points.
DISCUSSION
The South Java upwelling conditions were analyzed over 16 years (2002–2017) in terms of upwelling index based on the physical parameters that accompany this process. The physical parameters referred to are SST and wind, since the southern coasts of Java exhibit the most immense SST variability and the strongest winds (Susanto et al., 2001). Unlike the previous study, this study was carried out more closely in the shelf area (isobath 40–200 m). The interannual and monthly mean climatology of upwelling index based on the wind (UIET) show a strong seasonal pattern (Figures 2, 3). The downwelling-favorable winds (UIET > 0) occur in the early years (about December to March each year (NW monsoon), while the upwelling favorable winds (UIET<0) occur in the middle to the end of the year (about May to November each year (SE monsoon). Upwelling along the Java-Sumatra Indian Ocean coast is a response to regional winds associated with the monsoon (Wyrtki, 1962; Asanuma et al., 2003; Susanto et al., 2006; Ningsih et al., 2013). During the SE monsoon, southeasterly winds from Australia generate upwelling along the Java-Sumatera coast, but conditions are reversed during the NW monsoon when the northwesterly wind blows from Asia. The spatially averaged UIET reveals positive values in December-March with maximum values in January, while negative values occur in April-November with minimum values in July-August (Figure 3C, D).
In terms of SST, the inter-annual UISST shows a seasonal pattern in general (a red-blue pattern that occurs mostly every year in Figure 4) with some complex variation in certain years. Negative UISST (upwelling favorable) starts to occur in the middle of the year (SE monsoon) until near the end of the year, except in 2010 and 2016, where cold SST is absent and UISST tends to be positive (downwelling favorable). Reversely, positive UISST (downwelling-favorable) occurs mostly at the beginning of the year (NW monsoon) from December to January but not in February, where it still shows positive UISST (Figure 4A, B). The absence of cold SST in 2010 and 2016 can be associated with ENSO as it coincided with the La Nina event at that time (Voskresenskaya et al., 2018). La Nina causes increased Indonesian throughflow (ITF) transport, which brings warmer water from the Indonesian Seas to the Indian Ocean. (Susanto et al., 2001) show that ITF is responsible for suppressing the cooling effect of upwelling along the south coast of Java. Using the ITF contribution percentage (ICP) index, Tisiana et al. (2014) shows that the ITF plays a significant role in controlling the South Java upwelling, particularly the upwelling of the east part of South Java. It can be seen that the spatially averaged (Figure 4C, D) shows different UISST intervals each year, which indicates a large variation of SST in our domain. According to Susanto et al. (2001) and Susanto et al. (2006), the greatest variability in sea surface temperature is associated with the monsoon via anomalous easterly winds and ENSO via the Indonesian throughflow (ITF). A dipole in the Indian Ocean resulting from air-sea interaction inherent to the Indian Ocean, known as the Indian Ocean Dipole (IOD), is another force that influences the interannual variability of cooler SST as suggested by Saji (2018). According to Qu and Meyer (2005), the large SST depression appears only during IOD events, and then the upwelling signature appears. According to Figure 5, the eastern and eastern points have different cold-water durations and peaks. The eastern points have about 7 months (May-November) of cold water with the coldest SST in August, while the western points have about 5 months (June-October) of cold water with the coldest SST in September.
The interannual Chl-a plots show a seasonal pattern with different peaks indicating interannual variation (Figure 6). The clear yellow shade in mid to late 2006 in Figure 7A, B, which is shown by the highest peak in Figure 6C, D, indicates the occurrence of Chl-a blooming coinciding with positive IOD as previously reported by Iskandar et al. (2009). All ocean and atmosphere dynamics, from local to regional scale (monsoon, tide, Kelvin and Rossby waves, ITF, ENSO, and IOD) that could influence the South Java upwelling system, as mentioned before, were manifested as different ranges and peaks in the Chl-a plot each year (Figure 6). Monthly mean climatology shows that higher Chl-a (> 1 mg.m-3) occurs almost exclusively during the SE monsoon from late June to early September at most of the points of analysis (Figure 7). All points show a value of Chl-a above the specified background value (0.2 mg.m-3) throughout the year, except at the easternmost point (108-108.3˚E) and points between 111.8 and 112.7˚E. This result is relevant to Yang et al. (2019), and we suggest that the South Java sea shelf and its adjacent area can be classified as mesotrophic according to Antoine et al. (1996). Figure 7C, D shows that high Chl-a occurs during the SE monsoon from May to November and low during the NW monsoon from December to March, which is consistent with previous studies (Duan et al., 2019; Wyrtki, 1962). Chl-a began to rise one month earlier at the eastern (May) than at the western (June) points (Figure 7C, D) and peaked in September. This result reveals that high Chl-a in the South Java upwelling was longitudinally different, which means it has a longer duration at the eastern points (111.8–112.7˚E, 5 months) than at the western points (108–108.3˚E, 4 months).
Since cross-correlation between UISST and UICHL results in the highest correlation coefficient (0.74) with the smallest lag time (6–12 days) in the eastern points (Figure 11D), we suggested that South Java upwelling can be identified better using SST than through Ekman mass transport or wind, particularly in the east. This result was relevant to the studies mentioned earlier about the upwelling index in the South Java upwelling system (Wirasatriya et al., 2020; Naulita et al., 2020). In addition, our points of analysis, which are lying on the shelf, could be the reason UI based on the Ekman mass transport was not explained well by the upwelling event as stated by Aïssa et al. (2014). Our results confirm the mechanism of the South Java upwelling that although the wind is the main driver of upwelling (Susanto et al., 2005; Wirasatriya et al., 2018; Wirasatriya et al., 2020; Budiman et al., 2021a, 2021b), the wind strength is distributed differently along the coast, which results in different Ekman mass transport strengths of UIET (Wirasatriya et al., 2020).
This study uses remotely sensed and reanalyzed data, no in-situ data was used. Future studies are encouraged to combine in situ experiments with satellite-based measurements and reanalysis data for better analysis and results. Chester and Jickells (2012) stated that satellite and model-derived estimates are greatly preferable but are indirect and that a particular limitation is that the satellites only see the surface layer of the oceans. The Chl-a variation was only correlated with 2 variables, which were SST and wind. Even though the analysis presented here focuses largely on the monthly climatology, the data used here has a relatively long time series (almost two decades). They have provided sufficient results relevant to previous research.
CONCLUSION
The South Java Sea shelf can be categorized as a mesotrophic region where the Chl-a reaches a value of more than 0.2 mg m-3 throughout the year. As a result, we suggested that this value can’t be used as the background value of Chl-a in this region to identify the upwelling event. The upwelling event in our domain (108 - 114˚E) can be explained better through the upwelling index based on the SST (UISST) than through the Ekman mass transport (UIET) since it has a strong correlation with Chl-a. Our results confirmed the earlier study regarding the upwelling index of southern Java at longitudes of 108 to 114˚E, where UISST can more appropriately explain the upwelling in this region.
Finally, combining different observational (in situ and satellite data) and modeling tools is highly recommended to evaluate our studies, particularly in the same domain or points. We expect that this study will supply additional information to help understand the productive dynamics of the South Java coast, leading to better management decisions regarding fisheries, tourism centers, and environmental policies.
ACKNOWLEDGEMENTS
ASB acknowledges Lembaga Ilmu Pengetahuan Indonesia (LIPI) for supporting this study through the Doctoral ByResearch Program. We acknowledge the E.U. Copernicus Marine Service Information that provided satellite data. The manuscript is part of doctoral theses in the Faculty of Fisheries and Marine Sciences, Institut Pertanian Bogor (IPB), Bogor, Indonesia.
AUTHOR CONTRIBUTIONS
Asep Sandra Budiman compiled the datasets, performed the analysis, interpreted the results and wrote the draft manuscript. Dietriech Geoffrey Bengen and Zainal Arifin was involved in planning, supervising the research, and revising sections of the manuscript. I Wayan Nurjaya and Muchamad Furqon Azis Ismail aided in interpreting the results, designing the figures and structure of the manuscript, and worked on the manuscript. All authors provided critical feedback and contributed to the final writing of the manuscript. All authors have read and approved of the final manuscript.
CONFLICT OF INTEREST
The authors declare that they hold no competing interests.
REFERENCES
Aïssa, Mordane, S., Orbi, A., Chagdali, M., Hilmi, K., Atillah, A., Lluís Pelegrí, J., and Hervé, D. 2014. An improved coastal upwelling index from sea surface temperature using satellite-based approach - The case of the Canary Current upwelling system. Continental Shelf Research, 81: 38–54.
Alvarez, I., Gomez-Gesteira, M., deCastro, M., Lorenzo, M.N., Crespo, A.J.C., and Dias, J.M. 2011. Comparative analysis of upwelling influence between the western and northern coast of the Iberian Peninsula. Continental Shelf Research, 31: 388–399.
Antoine, D., Andrt, J.M., and Morel, A. 1996. Oceanic primary production: Estimation at global scale from satellite (Coastal Zone Color Scanner) chlorophyll. Global Biogeochemical Cycles, 10: 57–69.
Asanuma, I., Matsumoto, K., Okano, H., Kawano, T., Hendiarti, N., and Sachoemar, S. I. 2003. Spatial distribution of phytoplankton along the Sunda Islands: The monsoon anomaly in 1998. Journal of Geophysical Research: Oceans, 108: 1–14.
Atmadipoera A.S., Agitha S. Jasmine, Purba, M. and Kuswardani, A.R. 2020. Upwelling characteristics in the southern Java waters during strong La Nina 2010 and super El Nino 2015. Jurnal Ilmu dan Teknologi Kelautan Tropis, 12: 257–276.
Bray, N.A., Hautala, S., Chong, J., and Pariwono, J. 1996. Large-scale sea level, thermocline, and wind variations in the Indonesian throughflow region. Journal of Geophysical Research, 101: 12,239-12,254, 1996.
Brieva, D., Ribbe, J., and Lemckert, C. 2015. Estuarine , Coastal and Shelf Science Is the East Australian Current causing a marine ecological hot-spot and an important fi sheries near Fraser Island , Australia ? Estuarine, Coastal and Shelf Science, 153: 121–134.
Budiman, A.S., Bengen, D.G., Nurjaya, I.W., Arifin, Z., and Ismail, M.F.A. 2021a. Physical forces driving chlorophyll-a variability in the South Java Sea Shelf : a spatio-temporal analysis. IOP Conference Series: Earth and Environmental Science, 890 012001, 2021.
Budiman, A.S., Bengen, D.G., Nurjaya, I.W., Arifin, Z., and Ismail, M.F.A. 2021b. The Spatio-Temporal Variability of Chlorophyll-A and Its Physical Variables in the South Java Sea Shelf. Journal of Hunan University Natural Sciences, 48: 21-36, 2021.
Chester, R. and Jickells, T. 2012. Marine Geochemistry. A John Wiley & Sons, Ltd., The Atrium, Southern Gate, Chichester, West Sussex, PO19 8SQ, UK. 148: 438p, 2012.
Cipollini, P., Cromwell, D., Challenor, P.G., and Raffaglio, S. 2001. Rossby waves detected in global ocean colour data. Geophysical Research Letters, 28: 323–326.
Corredor-acosta A., Acosta A., Pizarro-koch M., Medell J., and Sald G.S. 2020. Spatio-temporal variability of chlorophyll-a and environmental variables in the panama bight. Remote Sensing. 2018, 10: 834.
Dewi, A.K., Gaol, J.L., Siregar, V.P., and Atmadipoera, A.S. 2020. Bigeye tuna fishing ground analysis using oceanographic features in Eastern Indian Ocean off Southern Java. IOP Conference Series: Earth and Environmental Science, 429: 012043.
Duan, Y., Liu, H., Yu, W., Liu, L., Yang, G., and Liu, B. 2019. The onset of the Indonesian–Australian summer monsoon triggered by the first-branch eastward-propagating Madden–Julian oscillation. Journal of Climate, 32: 5453–5470.
Everett, J.D., Baird, M.E., Roughan, M., Suthers, I.M., and Doblin, M.A. 2014. Progress in Oceanography Relative impact of seasonal and oceanographic drivers on surface chlorophyll a along a Western Boundary Current. Progress in Oceanography, 120: 340–351.
Fernandez, E. and Lellouche, J.M. 2018. Product User Manual For the Global Ocean Physical Reanalysis product GLOBAL_REANALYSIS_PHY_001_030. April, 1–15.
Ffield and Gordon. 1996. Tidal Mixing Signatures in the Indonesian Seas. Journal of Physical Oceanography, 26: 1924-1937.
Gingele, F.X., Deckker, P.D., Girault, A., Guichard, F. 2002. History of the South Java Current over the past 80 ka. Palaeogeography, Palaeoclimatology, Palaeoecology, 183: 247–260.
Gualdi, S., Guilyardi, E., Navarra, A., Masina, S., and Delecluse, P. 2003. The interannual variability in the tropical Indian Ocean as simulated by a CGCM. Climate Dynamics, 20: 567–582.
Horii, T., Ueki, I., and Ando, K. 2018. Coastal upwelling events along the southern coast of Java during the 2008 positive Indian Ocean Dipole. Journal of Oceanography, 74: 499-508.
Iskandar, I., Mardiansyah, W., Masumoto, Y., and Yamagata, T. 2005. Intraseasonal Kelvin waves along the southern coast of Sumatra and Java. Journal of Geophysical Research, 110: 1–12.
Iskandar, I., Tozuka, T., Sasaki, H., and Masumoto, Y. 2006. Intraseasonal variations of surface and subsurface currents off Java as simulated in a high-resolution ocean general circulation model. Journal of Geophysical Research, 111: C12015.
Iskandar, I., Rao, S.A., and Tozuka, T. 2009. Chlorophyll-a bloom along the southern coasts of Java and Sumatra during 2006. International Journal of Remote Sensing, 30: 663–671.
Iskandar, MR., Ismail, M.F.A, Arifin, T., and Chandra, H. 2021. Marine heatwaves of sea surface temperature off south Java. Heliyon. 7: 1-8.
Ismail, M.F.A, Ribbe, J., Karstensen, J. and Rossi, V. 2019. Remote sensing of upwelling off Australias north-east coast. Ocean Science.
Ismail, M.F.A., Ribbe, J., Arifin, T., Taofiqurohman, A., and Anggoro, D. 2021. A census of eddies in the tropical eastern boundary of the Indian Ocean. Journal of Geophysical Research: Oceans, 126: e2021JC017204.
Kämpf, J., Jochen, and Chapman, P. 2016. Upwelling systems of the world. Springer International Publishing Switzerland, 443p.
Kunarso, Hadi, S., Sari Ningsih, N., Baskoro, M.S., Wirasatriya, A., and Kuswardani, A.R.T.D. 2020. The classification of upwelling indicators base on sea surface temperature, chlorophyll-a and upwelling index, the case study in Southern Java to Timor Waters. IOP Conference Series: Earth and Environmental Science, 530: 12020.
Menezes, V.V. and Vianna, M. L. 2019. Quasi-biennial Rossby and Kelvin waves in the South Indian Ocean: Tropical and subtropical modes and the Indian Ocean Dipole. Deep-Sea Research Part II: Topical Studies in Oceanography, 166(April): 43–63.
Moses, W.J., Gitelson, A.A., Perk, R.L., Gurlin, D., Rundquist, D.C., Leavitt, B.C., Barrow, T.M., and Brakhage, P. 2011. Estimation of chlorophyll- a concentration in turbid productive waters using airborne hyperspectral data. Water Research, 46: 993–1004.
Naulita, Y., Arhatin, R.E., and Nabil. 2020. Upwelling index along the South Coast of Java from satellite imagery of wind stress and sea surface temperature. IOP Conference Series: Earth and Environmental Science, 429: 12025.
Ningsih, N.S., Rakhmaputeri, N., and Harto, A.B. 2013. Upwelling Variability along the Southern Coast of Bali and in Nusa Tenggara Waters. Ocean Science Journal, 48: 49-57.
Ningsih, N.S., Sakina, S.L., Susanto, R.D., and Hanifah, F. 2020. Zonal Current Characteristics in the Southeastern Tropical Indian Ocean (SETIO). Ocean Science, 1–37.
Pujiana, K. and McPhaden, M.J. 2020. Intraseasonal Kelvin Waves in the Equatorial Indian Ocean and Their Propagation into the Indonesian Seas. Journal of Geophysical Research: Oceans, 125: 1–25.
Qu, T. and Meyer, G. 2005. Seasonal characteristics of circulation in the Southeastern Tropical Indian Ocean. Journal of Physical Oceanography, 35: 255–267.
Quadfasel, D. and Cresswell, G.R. 1992. A note on the seasonal variability of the South Java Current. Journal of Geophysical Research, 97: 3685-3688.
Rudiastuti, A.W., Syafi’i, A.N., and Kusuma, H.A. 2019. Spatial pattern of tides in Indonesia using altimetry data. Proceedings of SPIE, 11372.
Saji, N.H. 2018. The Indian Ocean Dipole. Oxford Research Encyclopedia of Climate Science, 1(March): 1–35. http://climatescience.oxfordre.com/view/10.1093/acrefore/9780190228620.001.0001/acrefore-9780190228620-e-619.
Saji, N.H., Goswami, P.N., Vinayachandran, P.N., and Yamagata, T. 1999. Dipole mode in the tropical Indian Ocean. Nature, 401(September):360–363. http://www.nature.com/doifinder/10.1038/43854%0Apapers3://publication/doi/10.1038/43854.
Soeriaatmadja, R.E. 1957. The Coastal Current South of Java. Marine Research in Indonesia, 3: 41.
Sprintall, J., Chong, J., Syamsudin, F., Morawitz, W., Hautala, S., Bray, N., and Wijffels, S. 1999. Dynamics of the South Java Current Indo-Australian Basin. Geophysical Research Letter, 26: 2493–2496.
Susanto, R.D., and Marra, J. 2005. Along the Southern Coasts of Java and Sumatra. Oceanography, 18: 1996–1999.
Susanto, R.D, Gordon, A.l., and Zheng, Q. 2001. Upwelling along the coasts of Java and Sumatra and its relation to ENSO. Geophysical Research Letter, 28(April): 1599–1602.
Susanto, R.D., Moore, T.S., and Marra, J. 2006. Ocean color variability in the Indonesian Seas during the SeaWiFS era. Geochemistry, Geophysics, Geosystems, 7: 1–16.
Syamsudin, F. 2004. Semiannual Kelvin Waves Propagation along the South Coast of Sumatra-Jawa-Bali and the Lesser Sunda Islands Observed by TOPEX / POSEIDON and ERS-1 / 2 Satellites. Proceedings ITB on Engineering Science, 36: 133-139.
Tisiana, R., Kuswardani, D., and Qiao, F. 2014. Influence of the Indonesian Throughflow on the upwelling off the east coast of South Java Influence of the Indonesian Throughflow on the upwelling off the east coast of South Java. Chinese Science Bulletin, 59: 4516-4523.
Utari, P.A., Setiabudidaya, D., Khakim, M.Y.N., and Iskandar, I. 2019. Dynamics of the South Java Coastal Current revealed by RAMA observing network. Terrestrial, Atmospheric and Oceanic Sciences, 30: 235–245.
Voskresenskaya, E.N., Marchukova, O.V., Maslova, V.N., and Lubkov, A.S. 2018. Interannual climate anomalies in the Atlantic-European region associated with La-Nina types. IOP Conference Series: Earth and Environmental Science, 107.
Wirasatriya, A., Kunarso, K., Maslukah, L., Satriadi, A., and Armanto, R.D. 2018. Different responses of chlorophyll-a concentration and Sea Surface Temperature (SST) on southeasterly wind blowing in the Sunda Strait. IOP Conference Series: Earth and Environmental Science, 139.
Wirasatriya, A., Setiawan, J.D., Sugianto, D.N., Rosyadi, I.A., Haryadi, H., Winarso, G., Setiawan, R.Y., and Susanto, R.D. 2020. Ekman dynamics variability along the southern coast of Java revealed by satellite data. International Journal of Remote Sensing, 41: 8475–8496.
Wood, Roughan, M., and Tate, P.M. 2012. Finding a proxy for wind stress over the coastal ocean. Marine and Freshwater Research, 63: 528–544.
Wyrtki, 1962. The upwelling in the region between Java and Australia during the south-east monsoon". Marine and Freshwater Research, 13: 217-225, 1962.
Yang, G., Zhao, X., Li, Y., Liu, L., Wang, F., and Yu, W. 2019. Chlorophyll variability induced by mesoscale eddies in the southeastern tropical Indian Ocean. Journal of Marine Systems, 199: 103209.
OPEN access freely available online
Chiang Mai University Journal of Natural Sciences [ISSN 16851994]
Chiang Mai University, Thailand
https://cmuj.cmu.ac.th
Asep Sandra Budiman1, 2, *, Dietriech Geoffrey Bengen2, I Wayan Nurjaya2, Zainal Arifin1, and Mochamad Furqon Azis Ismail1
1 National Research and Innovation Agency, Jakarta 14430, Indonesia.
2 Faculty of Fisheries and Marine Sciences IPB University Bogor 16128, Indonesia.
Corresponding author: Asep Sandra Budiman, E-mail: assandra81@gmail.com
Total Article Views
Editor: Supon Ananta,
Chiang Mai University, Thailand
Article history:
Received: December 6, 2021;
Revised: April 14, 2022;
Accepted: May 23, 2022;
Published online: June 10, 2022