 ISSN: 2822-0838 Online

Correlation of 2D Electrical Resistivity and Self-Potential Methods for the Assessment of the Integrity of Goronyo Dam NW Nigeria
Abdulrahaman Idris Augie*, Mohammed Saleh, Oluwatoyin Ologe, Kazeem Adeyinka Salako, Adewuyi Abdulwaheed Rafiu and Muhammad Naziru YahayaPublished Date : 2022-07-11
DOI : https://doi.org/10.12982/CMUJNS.2022.043
Journal Issues : Number 3, July-September 2022
Abstract In this research, combined 2D electrical resistivity and self-potential (SP) methods were employed to locate anomalous electrical conductivity around the Goronyo dam in order to determine the condition of the embankment of the earth dam. The data were taken with the reference to resistivity and SP values using Wenner configuration. The results obtained from these techniques shows that the area was underlain by four stratigraphic layers, namely; clayey sand, wet sandy clay, laterite and partially weathered basement complex rock as compared with the resistivities of common rocks and borehole lithology of the area. The low SP (< 200 mV)/high resistivity zones in the overburden of profiles P1, P2 and P3 shows the presence of partially weathered basement complex rocks which was probably due to compactness and dryness around the dam. However, the zones of high SP (≥ 200 mV)/low apparent resistivity regions (z1 and z2) of profiles P1 (2 Ωm to 27 Ωm), P2 (3 Ωm to 25 Ωm) and P3 (3 Ωm to 14 Ωm) have revealed the weak zones associated with wet sandy soil. Results obtained from 2D electrical resistivity (z1) technique have correlated well with the results of SP sections (z2). These regions of weak zones occupied the x-distance along the profiles; P1/or S2 (120 m to 200 m and 250 m to 400 m), P2/or S2 (1 m to 156 m and 192 m to 400 m) and P3/or S3 (48 m to 400 m) with their corresponding depth y, ranging from 23 m to 30 m, 26 m to 30 m and 23 m to 30 m.
Keywords: 2D Electrical Resistivity Tomography (ERT), Self-Potential (SP), Dam, Subsurface, Seepage, Condition
Citation: Augie, A.I., Saleh, M., Ologe, O., Salako, K.A., Rafiu, A.A., and Yahaya, M.N. 2022. Correlation of 2D electrical resistivity and self-potential methods for the assessment of the integrity of Goronyo dam NW Nigeria. CMU J. Nat. Sci. 21(3): e2022043.
INTRODUCTION
A dam is referred to as a barrier to hold back the flow of water, thereby creating a large body of water called a reservoir. They are structures of various forms constructed across streams or rivers to hold back their flow (Michalis and Sentenac, 2016). Dams are fundamental components in present day culture and address huge financial qualities. The need for a dam is decided by the purpose(s) to which the water is being impounded (Lin et al., 2013) In Nigeria, several needs for the construction of dams have been identified, including production of electricity; supply of water for irrigation, industrial use and domestic consumption; and more importantly flood control (Augie et al., 2019A). Dams can be grouped into three (3) categories depending on the materials in-used when being constructed. These are; Earth fill dam, Rockfill dam and Concrete gravity dam (Osazuwa and Chii, 2010).
The respectability of a dam bank can be sabotaged by the presence of land highlights, like deficiencies, breaks, gaps, jointed or shear zones under the dam pivot or discontinuities in the structure itself (Chinedu, 2013). All dams have some drainage as the seized water looks for easiest courses of action through the dam and its establishment. Leakage should be controlled to forestall disintegration of the embankment or establishment or harm to substantial constructions (Augie et al., 2020A). Inward disintegration of the establishment or embankment brought about by drainage is known as funneling. Damages resulting from internal erosion can lead to expensive remediation (Michalis and Sentenac, 2016).
The capacity of a rock unit to lead electrical flow relies upon its porosity, level of interconnection between the pores (porousness) and level of water immersion in the rock. Some minerals such as native metals and graphite conduct electricity via the passage of electron (Mogaji, 2016; Wahyu et al., 2017). Nonetheless, most rock-forming minerals are insulators and electrical current is carried through a rock mainly by the passage of ions in pore waters. Thus, most rocks conduct electricity by electrolytic rather than electronic processes (Oseji, 2010).
Electrical resistivity is one of the most sensitive geophysical methods for monitoring changes of electrical properties in subsurface (Aizebeokhai et al., 2010; Kang et al., 2016). Electrical resistivity techniques include the estimations of the clear resistivity of soils and shakes as capacity of profundity or position (Loke, 1999; Dahlin and Zhou, 2004; Oduduru and Mamah, 2014). The electrical resistivity surveys can help in revealing low resistivity zones that could be influenced by seepage conditions inside the body of the dam (Augie et al., 2019A).
The Goronyo dam in Sokoto State was rated the second-largest dam in the country after Kainji dam. It impounds the Rima River in some parts of Goronyo, Gada and Sabon Birni local government areas of Sokoto State in northern Nigeria (Augie et al., 2019A). It was completed in 1984 and commissioned in 1992 (Sembenelli, 1992). The dam is an earth fill dam structure with a tallness of 21 m and an absolute length of 12.5 km. It has a capacity limit of 976 million cubic meters. The dam will be basic in controlling floods and passing on water in the dry season for the coordinated Zauro polder project downstream in Kebbi State (Augie et al., 2020A).
It was in late August 2010 rainstorms caused the dam to fill to dangerous levels. While trying to decrease the danger of disappointment, the entryways were opened on 1 September 2010, causing significant flooding in the downstream town of Kagara. On 8 September the spillway from the dam totally fizzled, causing substantially more far and wide flooding. The tempest that caused the flooding might be essential for an environmental change design, with rising temperatures and more serious precipitation in the stormy season. These led the dam to broke through its barriers, killed over 100 people and rendered over 200,000 homeless in Sokoto and Kebbi states (Osinbajo, 2017).
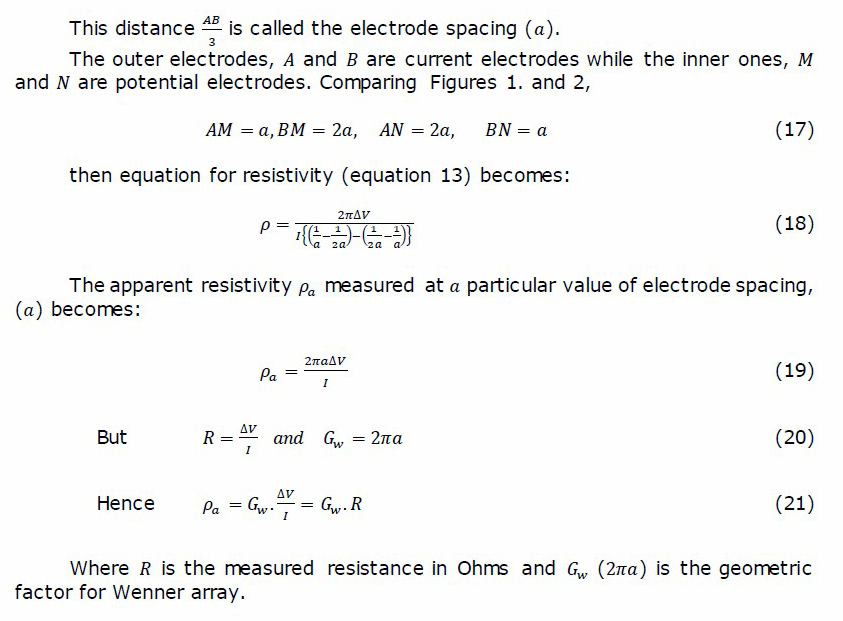
This study investigates the condition of Goronyo dam using Electrical Resistivity and SP techniques. These techniques were employed to evaluate the integrity of the dam and have been used for a long time to map boundaries between layers having different conductivities as suggested by Authors: Loke (2000), Augie et al. (2019A); Augie et al. (2020A); Ologe and Augie (2020); Bawa et al. (2020). ERT and SP arrays were installed on the crest to assess the structural integrity of the dam based on the resistivity and SP signatures using Wenner electrode configuration. Wenner array was adopted because of it is relatively sensitive to vertical changes in the subsurface resistivity below the center of the array (Loke, 2000). The signal strength is inversely proportional to the geometric factor used to calculate the apparent resistivity value for the array. And this geometric factor (2πa) is smaller than that for other arrays (Griffiths and Turnbull 1985; Griffiths et al., 1990). Among the common arrays, the Wenner array has the strongest signal strength (Augie et al., 2020B). This can be an important factor if the survey is carried in areas with high background noise especially in the area Goronyo earth dam as compared the geological setting of the area as well as the nature of earth materials contains in the embankment (Figure 4). Two Dimensional (2D) geoelectrical prospecting provides both vertical and lateral distribution of resistivity (Ωm) and potential difference (mV) respectively beneath the whole profile (Griffiths and Barker, 1993; Loke, 2002).
Low resistivity/or high SP zones presented in this study were considered as sensitivity sections for seepage in the ERT Method as well as SP method, that could be influenced by seepage conditions inside the body of the dam (Olayinka and Yaramanci, 2000). The geophysical results presented in this research provide a key information about the on-going performance of dam infrastructure. These could lead to provide a safety operation and proper maintenance of dam infrastructure that are usually taken into account for social and economic impacts in case of a failure. The geophysical outcomes in this research also highlighted the distribution of concealed flow paths under the embankment which helped in characterizing the condition of reservoir and the dam.
In geoelectrical methods, current is driven through one pair of current-electrodes (A and B) and the potential differences is measured with the aid of pair of potential-electrodes (M and N) connected to a sensitive voltmeter called Resistivity meter (Oldenburg and Li 1999; Augie et al., 2019B). This will possibly determine an effective or apparent resistivity of the subsurface as shown in Figure 1 below:
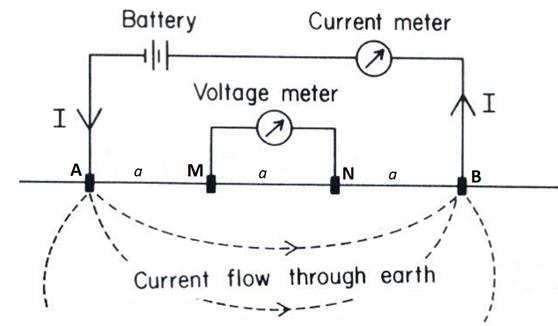
Figure 1. Diagram used to determine potential difference two points (Augie et al., 2019B)
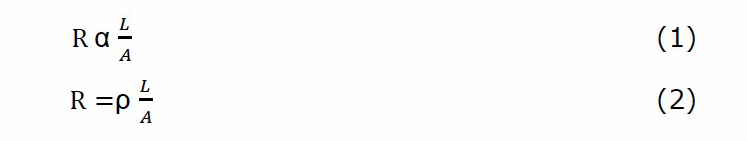
Ologe and Augie (2020) described that resistance (R) which usually measured in ohm of a rock or particular sample is directly proportional to its length (L) of the resistive material (i.e. earth materials) and inversely proportional to its cross-sectional area (A) as given in equation (1):
where

Where; K is geometrical factor of the electrode arrangement.
Considering Wenner configuration which have been adopted in this study (Figure 2), all the four electrodes A, M, N and B are planted along a profile such that
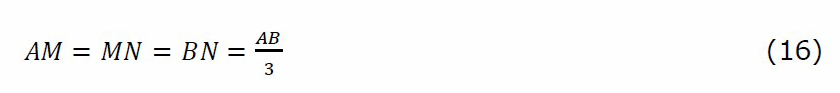
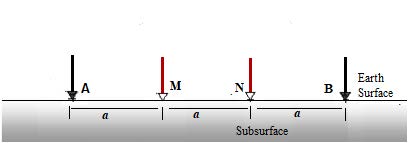
Figure 2. The Wenner electrode configuration. (Augie et al., 2020B)
MATERIAL AND MATHODS
The study area
The study area lies within the northwestern part of Sokoto State bounded in the north by Niger Republic between latitudes 13025′0″N and 13040′0″N, and longitudes 5050′0″E and 605′0″E. The areas consist of; Gada, Sabon Birni and Goronyo local government areas of Sokoto state. It occupied the total areas of 225 Km2 (Figure 3). Geologically, the area falls under sedimentary basin of northwestern Nigeria which known as the Sokoto Basin. It consists the following earth materials; sandstones, ironstones, siltstones, laterites, meta-conglomerate, diorite, migmatite, undifferentiated schist including some gneiss and quartz-mica schists (Figure 4).
About one third of the land area in Sokoto State is underlain by crystalline basement rocks (Bawa et al., 2020). These outcrop in the southern part of area as well as in the east. However, the major part of the area is underlain by younger sedimentary rocks consisting mainly of sandstones, siltstones, clays shale’s, limestones and laterites (Paul and Bayode, 2012). The sedimentary rocks in mapped area can be grouped into four major rock types: siltstone (with fine-grained sandstone), medium to coarse-grained sandstones, shale and limestone. In a sedimentary basin very rarely does one type of rock cover a large geographical area and stratigraphic thickness. The Goronyo dam area lies in the northern part of the Sokoto basin and is underlain by sedimentary rocks that consists of the aforementioned earth materials (Olugbenga and Augie, 2020).
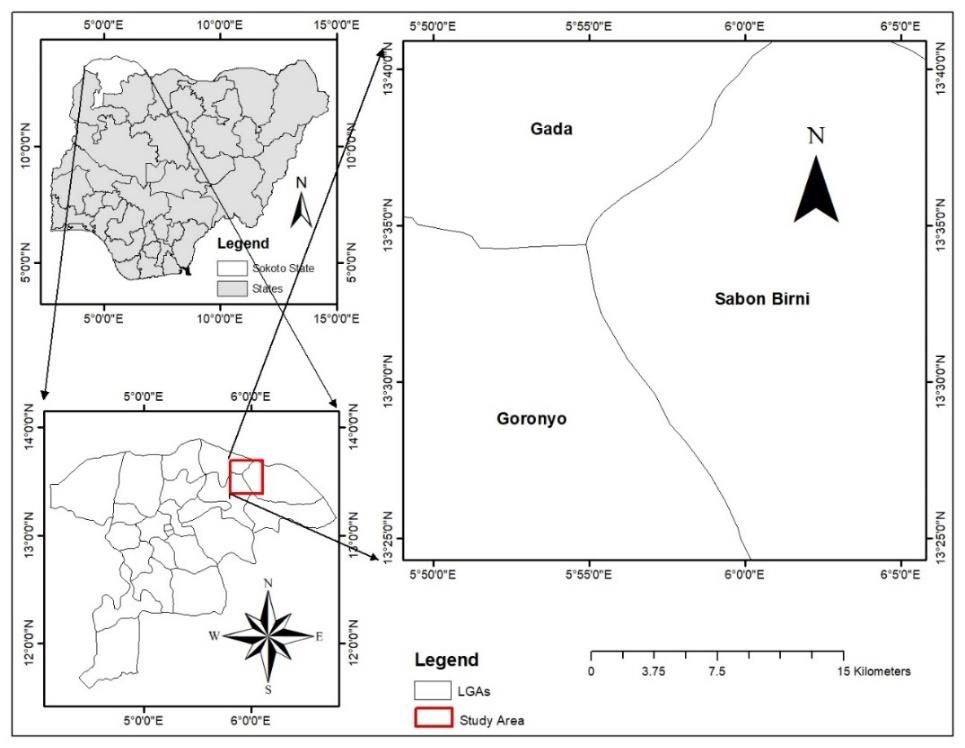
Figure 3. Location of the Study Area.
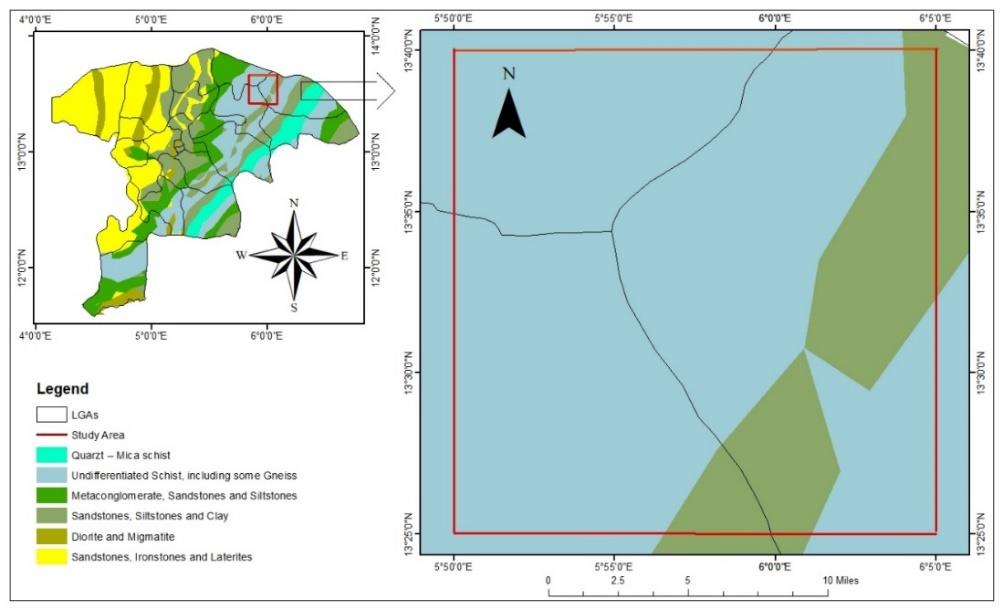
Figure 4. Geological Setting of the Study Area. (Olugbenga and Augie, 2020)
Methodology
In this study, 2D electrical survey also known as electrical resistivity imaging/or tomography (ERI) was carried out around the Goronyo earth dam in Sokoto NW Nigeria. The method provides both vertical and lateral distribution of resistivity and spontaneous potential respectively beneath the whole profile (Loke and Dahlin, 2002). The technique was applied using the 4 numbers equally spaced collinear array of electrodes connected to a multi-core cable. The separation between the potential electrode and the current electrodes depends was 3 m. An Ohmega (resistivity meter) coupled with an electronic switching unit was used to automatically select the relevant electrodes especially potential electrode pair and current electrode pair for each measurement. The Ohmega used, has the capability of measuring earth resistance and spontaneous potential (SP). It has a transmitter with automatic or user selectable currents (in mili-amps); 0. 5, 1, 2, 5, 10, 20, 50 and 200 mA.
The data was taken using Wenner configuration with the aid of resistivity meter coupled with electrode selector and powered by 12 V battery. Measurements were done at expanded electrode spacing’s (a) in multiple of 3 m. Usually, increasing in electrode spacing will increase the injected current flows to greater depths as suggested by Loke (2000). The adopted Wenner array electrode spacing (a) was set up at different distance along the profiles and this varies from 3 m, 6 m, 9 m, 12 m, 15 m, 18 m, 21 m, 24 m, 27 m up to 30 m in order to unwind the arrangements of geologic formation at various profundities comprehensive way. For this, the depth of investigation in this research using Wenna Alpha array (Ze/a × amax = 0.519 × 30 m) would be 15.57 m (Loke, 2000).
For the 1st measurement, electrodes number 1, 2, 3 and 4 (C1, P1, P2 and C2) were utilized. First current electrode 1 (C1) was utilized at 0 m, first potential electrode 2 (P1) was used at 3 m, second potential electrode 3 (P2) was used at 6 m and second current electrode 4 (C2) was utilized at 9 m (Figure 6). For the subsequent measurement, electrodes number 2, 3, 4 and 5 were utilized for C1 at 3 m, P1at 6 m, P2 at 9 m and C2 at 12 m respectively. This procedure was repeated along the two profiles (P1/S1 and P2/S2) line of 400 m at right abutment and one profile (P3/S3) of 200 m at left abutment of the Goronyo earth dam using 1a spacing (Figure 5). The measurements were also obtained for 2a, 3a, 4a, 5a, 6a, 7a, 8a, 9a and 10a spacing at each profile.
At each measurement, the product of the resistance measured and the corresponding value of the geometric factor Gw, (see equation 20) gave the measured ground apparent resistivity, SP data were also obtained. The acquired data were processed with RES2DINV program developed by Loke and Barker (1999), Geotomo Software and modified by Loke (2000) which automatically determines a 2D resistivity model for the subsurface.
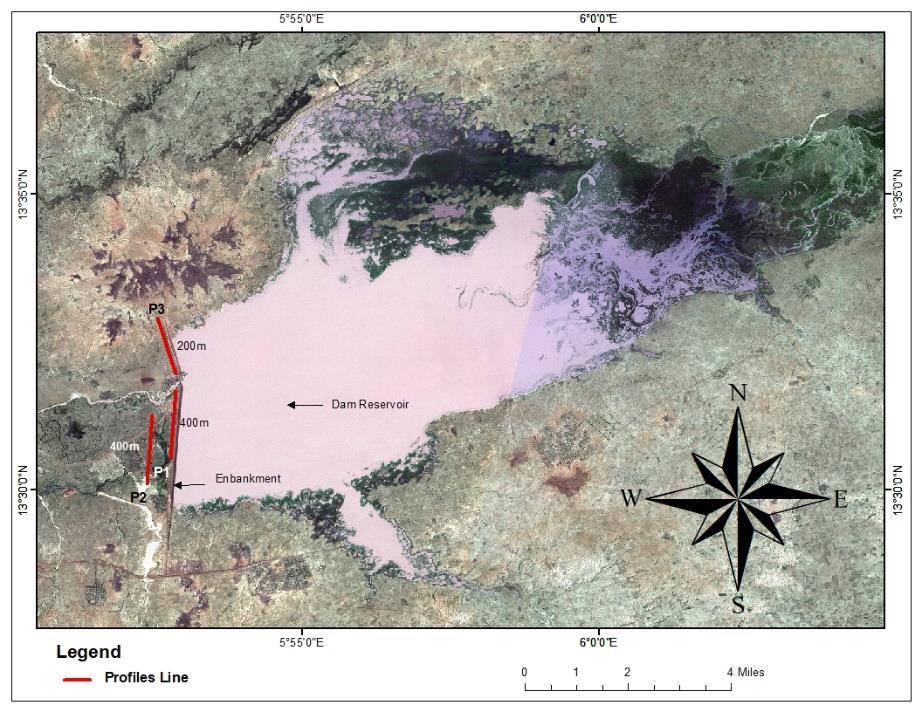
Figure 5. Field Survey Layout Using Wenner Electrode Configuration (Augie et al., 2019A)
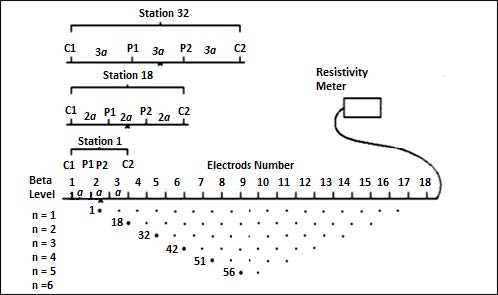
Figure 6. Sequence of Measurement to Build up Pseudosection in Wenner Array (Loke, 1999)
RESULTS AND DISCUSSION
Results from 2D electrical resistivity technique gives three cross sections for each profile namely, the measured resistivity section, the calculated resistivity section and the inverse (model) resistivity section (z1-parameter). The sections have vertical axis (y-axis) corresponding to depth of investigation and the horizontal distance (x-axis) representing along the profile. The inverse section of each profile was interpreted in terms of geological setting/borehole lithology of Goronyo local government area as described by SARDA (1988) and also resistivity values of common rocks adopted in the same formations by Authors; Osazuwa and Chii (2010).
For profile one (P1), Figure 7(a) is the measured apparent resistivity pseudo section which represents the data set acquired in the field, Figure 7(b) is the calculated apparent resistivity pseudo section which represents a synthetic model used to estimate the size of the pixels at different layers and Figure 7(c) represents the Inverse model resistivity section which was used to generate the corresponding geologic section as given in Figure 7(d). The inverse section (Figure 7c) showed regions of low, moderate and high resistivity values. Looking at the inverse section under x-position 1m distance along the profile, the layers having moderate resistivity (z1), of 30 Ωm to 91 Ωm were spotted with bottom of the deepest layer (y) appeared at 11 m. When these resistivity values have coincided with the regions of the clay sand (SARDA, 1988; Osazuwa and Chii, 2010). Thus, was extended to region x, ranging 1 m to 64 m along the profile. Observing the x-positions of 120 m and 250 m along the profile having the low resistivity z1, of 2 Ωm to 27 Ωm with bottom of the deepest layer (y) appeared at 28 m. These zones were considered to be wet sandy soil as compared in relation to Table 1. Its further extended to 120 m to 210 m and 250 m to 400 m along the profile of x-direction. These regions of wet sandy soil are the indications of the presence of weak zones which may be due to high moisture content resulting from the seepage of water leaking through this layer. Looking at model section under x-position 48 m to 140 m of the third layer which have the moderate resistivity values z1, ranging from 91 Ωm to 302 Ωm the bottom of the deepest layer (y) appeared at about 28 m. The layer was considered to be lateritic as compared with resistivity values in relation to Authors; Osazuwa and Chii (2010) and SARDA (1988). The region (laterite) was extended from 48 m to 140 m along the profile.
Table 1. Resistivity values adopted for this work (Osazuwa and Chii, 2010).
|
Rock Type |
Resistivity Range (Ωm) |
|
Wet Sandy Clay |
1-30 |
|
Clayey Sand |
31-100 |
|
Laterite. |
101-350 |
|
Highly Weathered Basement Complex Rock. |
100-600 |
|
Partially Weathered Basement Complex Rock. |
600 and above |
Similarly, the inverse section under x-positions 3 m and 120 m in the have high resistivity values ranging 1,004 Ωm to 11,059 Ωm at about 28 m depth (y). These layers have resistivity coincided with partially weathered basement rock. These regions further occupied the positions of 3m to 50m and 120 m to 288 m distance (x) along the profile. The results of inverse model section (Figure 7c) were indicated in geologic section as given in Figure 7d.
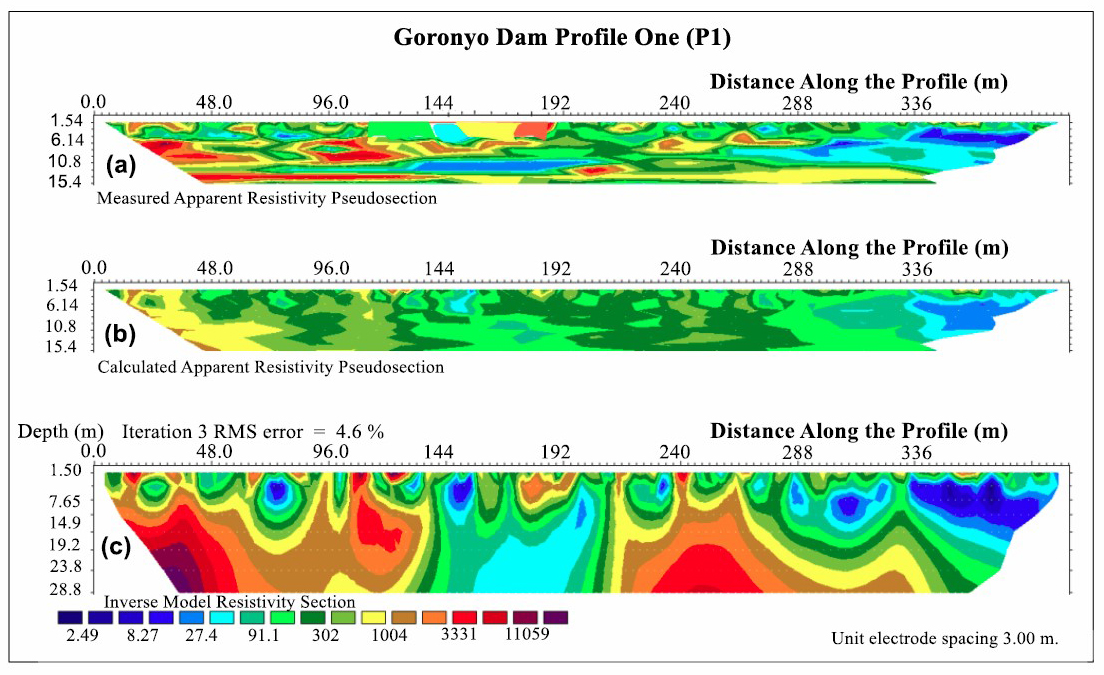
Figure 7. (a) Measured and (b) Calculated Apparent Resistivity Pseudosection with (c) the Inverse Model Resistivity Section for the Dataset along Profile One (P1).
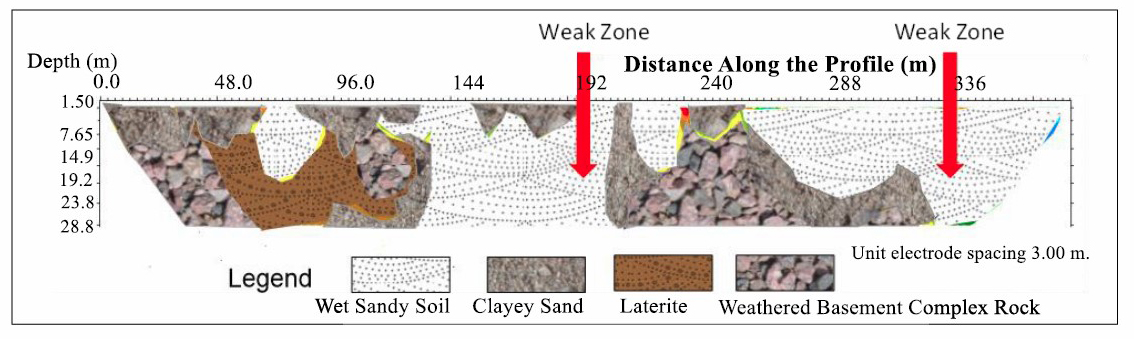
Figure 7d. Interpreted Inverse Model of 2D Section for P1 Showing Lithology and Anomaly of Interest (Weak Zone within Bedrock)
The results of SP section along the profile one (S1) was in Figure 8. The length of the profile was 400m and measurement initiated from the north side of the profile at profundity of around 30 m. Noticing this map very intently under the x-positions from 120 m to 200 m and 250 m to 400 m along the profile of the layer having high SP values ranging from 200 mV and above (z2), at depth y, ranging from 23 m to 30 m. These zones were considered to be weak zones due to the high SP values (≥ 200 mV). High SP regions were due to high fluid flow which could resulted in high moisture content (Shao et al., 2021) which cause the seepage of water leaking through the zones. These weak regions are viewed as dangerous when they broaden profound into the bedrock as they could give miniature channels to leakage of water from the lake under the impact of hydraulic gradient.
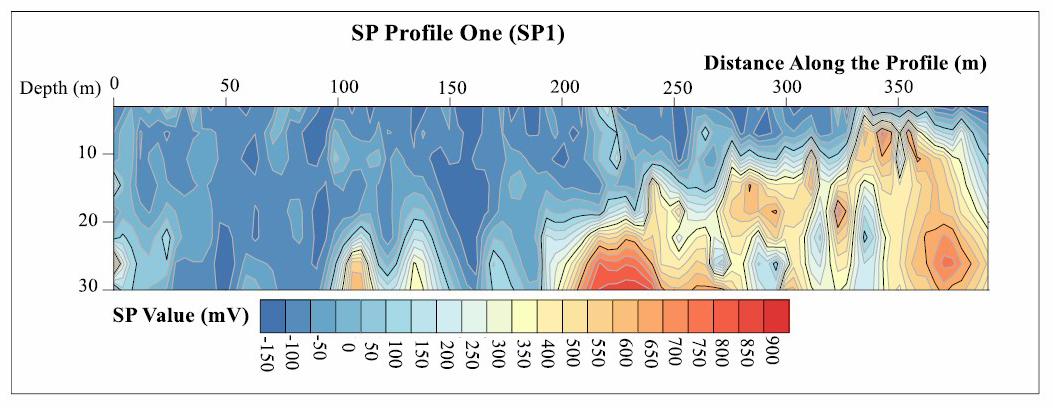
Figure 8. SP 2D Section for Profile One (S1)
The measured, calculated and inverse sections for P2 are given in Figure 9. The inverse section showed regions of low, moderate and high resistivity values. Low resistivity zones have layers of resistivity values (z1) ranged from 3 Ωm to 25 Ωm which occupied the x-positions of 1 m to 156 m and 192 m to 400 m along the profile. These regions were spotted with bottom of the deepest (y) layer appeared at about 26 m. These zones were considered to be wet sandy soil in relation to Authors; Osazuwa and Chii (2010) and SARDA (1988). Wet sandy soil could be an indication of the presence of weak zones which may be due to high moisture content within the regions. These may result from the seepage of water leaking through these layers. Likewise, the moderate resistivity zones have values (z1) ranged from 30 Ωm to 69 Ωm appeared under the x-positions of 1 m to 198 m and 279 m to 400 m along the profile. These regions were spotted at the depth y, of 10 m. These layers were similarly considered to be Clay Sand. The inverse section under x-position 105 m to 336 m along the profile have resistivity 188 Ωm to 513 Ωm appeared at the depth y, about 28m. When these resistivity values are considered in relation to aforementioned Authors, the layers were referred to as laterite. However, high resistivity regions have values z1, ranging from 1,396 Ωm to 3,802 Ωm appeared at button of the deepest layer of about 28 m. These zones have resistivity coincided partially weathered basement rock. These regions (x) were ranging from 232 m to 399 m along the profile at the depth y, of 28 m. Results of inverse model section (Figure 9c) were transformed into geologic section (Figure 9d).
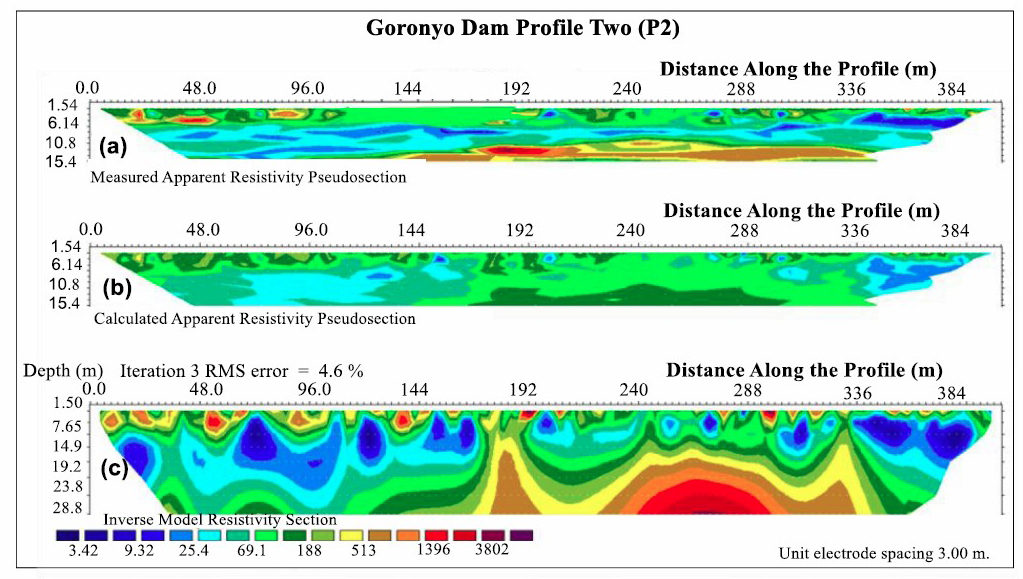
Figure 9. (a) Measured and (b) Calculated Apparent Resistivity Pseudosection with (c) the Inverse Model Resistivity Section for the Data set along Profile 2 (P2).
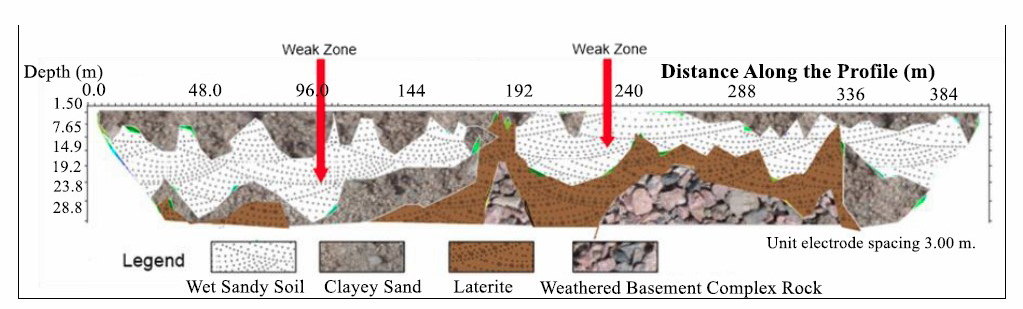
Figure 9d. Interpreted Inverse Model of 2D for P2 Showing Lithology and Anomaly of Interest (Weak Zone within Bedrock).
The results for SP measurements along profile two (S2) were given in Figure 10. Observing this section (Figure 10) very closely under the x-positions 1 m to 156 m and 192 m to 400 m along the profile with their corresponding depth y, ranging from 23 m to 30 m and 11 m to 30 m. These regions (z2) show high SP values ≥ 200mV respectively. High SP areas were because of high liquid stream (Shao et al., 2021) and this identified as geologic weak zones through which water from lake could leak out by seepage. These could affect the storage capacity of the dam as well as the competence of the embankment.
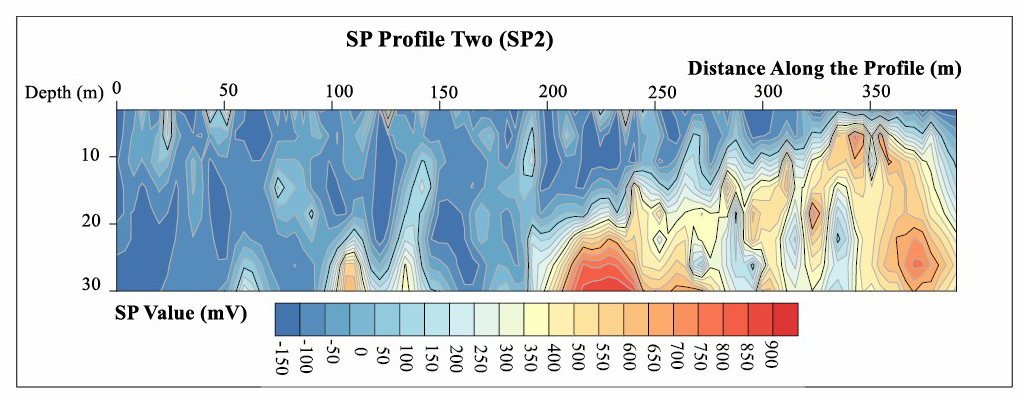
Figure 10. SP 2D Section for Profile 2 (S2)
Figure 11 shows the measured, calculated and inverse sections for the profile 3. The inverse models consist of three difference zones which are; low, moderate and high resistivity regions. Low resistivity zones denoted with values (z1) ranged from 3 Ωm to 14 Ωm placed at the surface depth y, of 14 m. These were extended to regions x, that ranged 48 m to 200 m along the profile (Figure 11c). When these low resistivity values are compared in relation to Authors; Osazuwa and Chii (2010) and SARDA (1988), the zones coincided with that of wet sandy clay. These type rocks could be an indication of the presence of weak zones which resulting from the seepage of water leakage. The inverse section also showed regions of moderate resistivity values z1, ranged from 30 Ωm to 54 Ωm placed at the depth y, of 28 m. These regions x, lied from 72 m to 184 m distance along the profile and was considered to be clay sand. The regions with resistivity values z1, ranged from 201 Ωm to 743 Ωm were considered to be laterite. These occupied some sections of the model from 1 m to 34 m distance x, along the profile at the depth y, of 28 m (Figure 11c).
However, high resistivity zones (Figure 11c) appeared on the x-position ranged from 4 m to 101 m distance along the profile at depth y, of 28 m. These regions have resistivity values ranging from 2756 Ωm to 37843 Ωm. The zones were appeared to be partially weathered basement rock. This procedure led to development of geologic section as given in Figure 11(d).
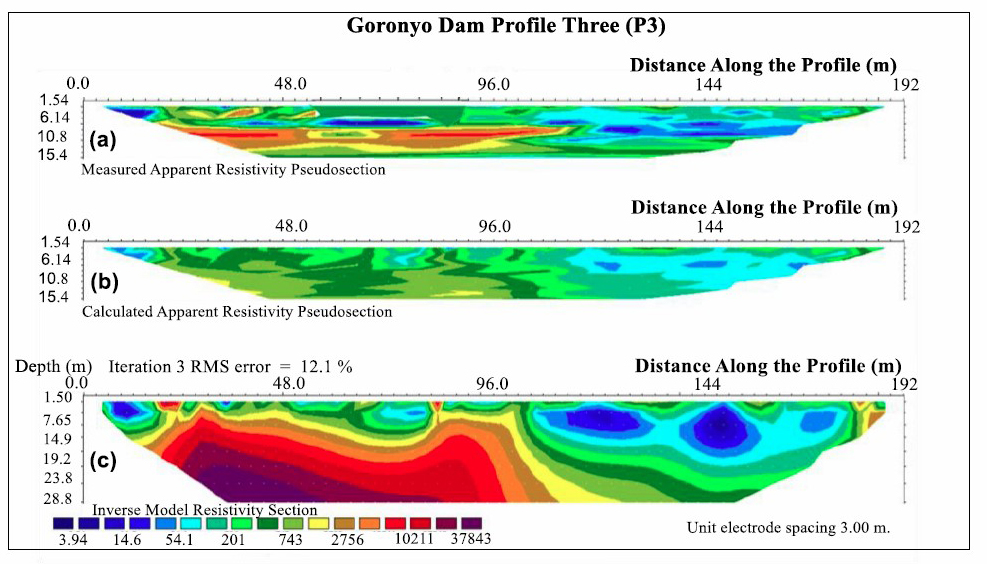
Figure 11. (a) Measured and (b) Calculated Apparent Resistivity Pseudosection with (c) the Inverse Model Resistivity Section for the Data set Along Profile three (P3).
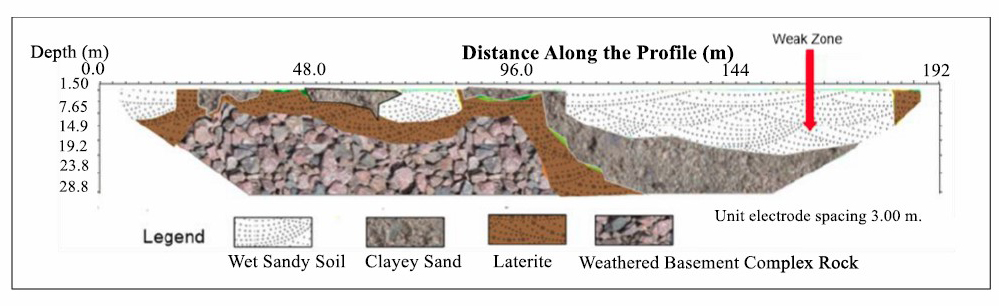
Figure 11d. Interpreted Inverse Model of 2D for P3 Showing Lithology and Anomaly of Interest (Weak Zone within Bedrock).
SP 2D Section for profile three was given in Figure 12. The results of SP data plotted against x-distance and a-spacing shows the high SP signatures z2, appeared from 48 m to 200 m along the profile with corresponding depth y, ranging from 23 m to 30 m. These regions of high SP values z2, (≥ 200 mV) were due to high fluid flow and this brought about high dampness content which cause the drainage of water spilling through the zones. These frail zones are viewed as dangerous when they broaden profound into the bedrock as they could give miniature channels to leakage of water from the lake under the impact of pressure driven inclination. However, there are also zones of low SP values in the profile which may be due to evapo-transpiration or animal movements that may led to consolidation in the area.
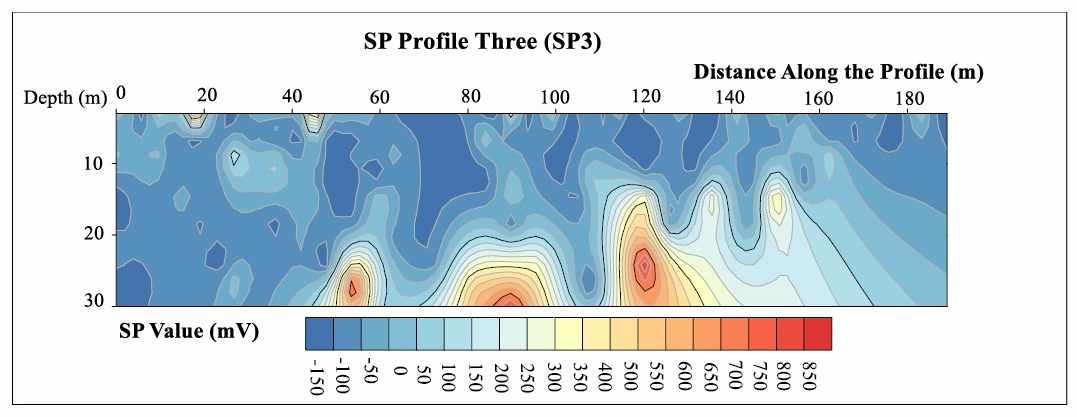
Figure 12. S P 2D Section for Profile 3 (S3).
Identification of water flow path
Possible channels through the weak zones were identified along profile one along the x-distance are from; 120 m to 200 m and 250 m to 400 m at the depth y, ranging from 23 m to 30 m (Figure 14). For profile two, x-distance are from; 1 m to 156 m and 192 m to 400m appeared at the depth y, ranging from 11 m to 30 m on right abutment of the dam (Figure 13). likewise, profile three x-distance are from; 48 m to 200 m at depth y, of 23 m to 30 m on left abutment of the dam reservoir (Figure 14).
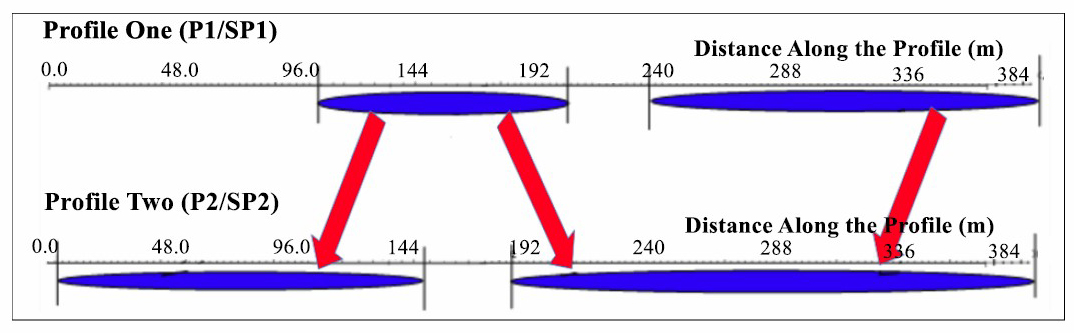
Figure 13. Profile 1 and 2 Showing Flow Path on the Right Abutment of the dam.
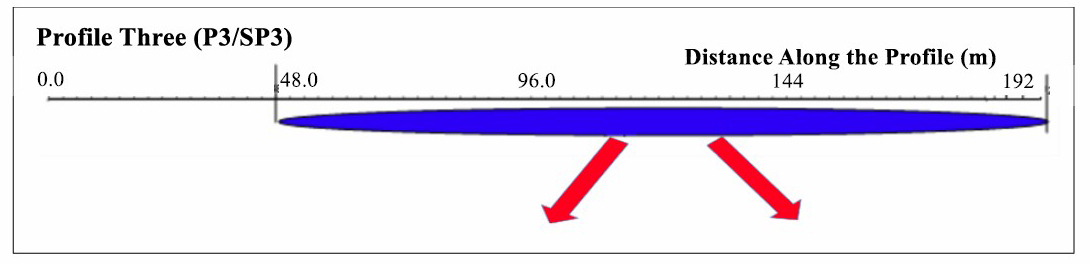
Figure 14. Profile 3 Showing Flow Path on the Left Abutment of the Dam.
Cross-correlation of resistivity and SP results
This sub section of result interpretation gives the correlation between the geologic sections obtained from inverse detailed resistivity section and SP value sections. The details are provided in the following:
For profile one (P1), the inverse resistivity model (Figure 7d) and SP section (Figure 8) were compared and their results of geophysical parameters z1 and z2, shows similar possible positions of weak zones at which the dam could lost the water through the embankment. Both Figure 7d and Figure 8 identified the zones covered the x-positions of 120 m to 200 m and 250 m to 400 m along the profile respectively. In comparison, SP section and inverse resistivity model for the profile covered the same corresponding y-position (depth) of 23 m to 30 m. Thus, these regions were identified as a geologic weak zone through which water from lake could leak out by seepage which could affect the storage capacity of the dam.
Figures 9d &10 of profile two (P1 and S1) were also compared and the result revealed the same weak zones which were considered to be wet sandy soil. Both resistivity model and SP sections covered the same x-positions of 1 m to 156 m and 192 m to 400 m at corresponding depth y, of 26 m to 30 m. These regions have tendency of water flow due to high SP and low resistivity signatures.
Similarly, Figures 11d & 12 of profile three (P3 and S3) were compared and the result the same possible regions of leakage of the water through the embankment. Both covers the x-distance along the profile of 48 m to 400 m at the depth y, of ranging from 23 m to 30 m. These zones were considered to be wet sandy soil as compare with resistivities of common rocks. Hence, these zones were recognized as a geologic feeble zone through which water from lake could spill out by seepage which could influence the capacity limit of the dam just as the ability of the dike.
CONCLUSION
Geoelectric method involved 2D electrical resistivity and SP techniques were used as a tool for identifying and precisely locating weak zones and faults that have subtle geomorphic expression in Goronyo earth dam. Its thereby highlights the importance of direct field observations in the interpretation of 2D electrical resistivity model and SP section together with geological settings of the area.
The results from inverse resistivity models for profiles P1, P2 and P3 have indicates the indicate the presence of weak zones (potential seepage paths) within the right and left abutment of the Goronyo earth dam. These results from 2D electrical resistivity technique have correlated well with the result found in SP sections, z2 for profiles S1, S2 and S3. The regions of low resistivity/or high SP values (z1 and z2) along profiles one to three have x-distance along; P1/or S2 (120 m to 200 m and 250 m to 400 m), P2/or S2 (1 m to 156 m and 192 m to 400 m) and P3/or S3 (48 m to 400 m) with their corresponding depth y, ranging from 23 m to 30 m, 26 m to 30 m and 23 m to 30 m. These weak zones have highlighted on the distribution of concealed flow paths under the embankment thereby helped in characterizing the condition of reservoir and the dam. However, high resistivity/or low SP areas could be an indication of presence of partially weathered basement complex rocks which is probably due to compactness and dryness around the Goronyo earth dam.
ACKNOWLEDGEMENTS
The authors are grateful to the Administrator of Goronyo dam for approval and facilitating the collection of the geophysical data. Their appreciation also goes to the Department of Physics, Bayero University Kano for providing the instruments.
AUTHOR CONTRIBUTIONS
Mr. Abdulrahaman Idris Augie (PhD student) took the lead in writing the manuscript. Prof. Mohammed Saleh designed and supervised the field survey. Dr. Oluwatoyin Ologe, Dr. Kazeem Adeyinka Salako, Dr. Adewuyi Abdulwaheed Rafiu and Mr. Muhammad Naziru Yahaya have contributed to the analysis and interpretation of the results. All authors have read and approved of the final manuscript.
CONFLICT OF INTEREST
No potential conflict of interest was reported by the author(s).
REFERENCES
Aizebeokhai, A.P., Olayinka, A.I., and Singh, V.S. 2010. Application of 2D and 3D geoelectrical resistivity imaging for engineering site investigation in a crystalline basement terrain, southwestern Nigeria. Journal of Environmental Earth Sciences. 61: 1481–1492.
Augie, A.I., Saleh, M., Aku, M.O., and Bunawa, A.A. 2019A. Assessment of the integrity of Goronyo dam Sokoto north western Nigeria using geoelectrotomographic technique. Bayero Journal of Physics and Mathematical Sciences. 10: 231 –243.
Augie, A.I., Alhassan, Y., and Magawata, U.Z. 2020B. Preliminary geophysical assessment of soil contaminants around wacot rice factory Argungu, north-western Nigeria. WASET International Journal of Geological and Environmental Engineering. 14: 190 – 195.
Augie, A.I., Saleh, M., and Gado, A.A. 2020A. Geophysical investigation of abnormal seepages in Goronyo dam Sokoto, north western Nigeria using self-potential method. International Journal of Earth, Energy and Environmental Sciences. 14: 103 – 107.
Augie, A.I., Shariff, O., and Sani, A.A. 2019B. Hydrogeophysical investigation for groundwater potential in Kalgo area, north western Nigeria using electrical resistivity method. Savanna Journal of Basic and Applied Sciences. 1: 180-189.
Bawa, Y.I., Augie, A. I., and Saleh, M. 2020. 2D geo-electrical assessment of subsurface salinization on perennial agricultural activities at Kurfi Fadama Sokoto NW Nigeria. Savanna Journal of Basic and Applied Sciences. 2: 144-152.
Chinedu, A.D. 2013. Electrical resistivity imaging of suspected seepage channels in an earthen dam in Zaria, north-western Nigeria. Open Journal of Applied Sciences. 3: 145–154.
Dahlin, T. and Zhou, B. 2004. A numerical comparison of 2D resistivity imaging with 10 electrode arrays. Geophysical Prospecting. 52: 379–398.
Griffiths, D.H. and Barker, R.D. 1993. Two-dimensional resistivity imaging and modelling in areas of complex geology. Journal of Applied Geophysics. 29: 211-226.
Griffiths, D.H. and Turnbull, J. 1985. A multi-electrode array for resistivity surveying. First Break. 3: 16-20.
Griffiths, D.H., Turnbull, J., and Olayinka, A.I. 1990. Two-dimensional resistivity mapping with a computer- controlled array. First Break. 8: 121-129.
Kang, H., Um, M., and Park, D. 2016. Assessing the habitat suitability of dam reservoirs: a quantitative model and case study of the Hantan River dam South-Korea. Multidisciplinary Digital Publishing Institute, 8: 450–493.
Lin, C.P., Hung, Y.C., Yu, Z.H., and Wu, P.L. 2013. Investigation of abnormal seepages in an earth dam using resistivity tomography. Journal of GeoEngineering. 8: 61–70.
Loke, H.M. 1999. Electrical imaging surveys for environment and engineering studies (practical guide to 2D and 3D survey). Earth Sciences. 44: 131–152.
Loke, M. 2000. Rapid least-square inversion of apparent resistivity pseudosections. Earth Sciences. 64: 31–52.
Loke, M.H. and Barker R.D. 1996. Rapid least-squares inversion of apparent resistivity pseudo-sections using a quasi-Newton method. Geophysical Prospecting. 44: 131-152.
Loke, M.H. and Dahlin, T. 2002. A comparison of the Gauss-Newton and quasi-Newton methods in resistivity imaging inversion. Journal of Applied Geophysics. 49: 149-162.
Michalis, P. and Sentenac, P. 2016. Geophysical assessment of dam infrastructure: the mugdock reservoir dam case study. Joint International Symposium on Deformation Monitoring. 3: 6–12.
Mogaji, K.A. 2016. Geoelectrical parameter-based multivariate regression borehole yield model for predicting aquifer yield in managing groundwater resource sustainability. Integrative Medicine Research. 10: 584–600.
Oduduru, P.I. and Mamah, L.I. 2014. Integration of electrical resistivity and induced polarization for subsurface imaging around Ihe pond Nsukka, Anambra basin Nigeria. Pacific Journal of Science and Technology. 15: 306-317.
Olayinka, A.I. and Yaramanci, U. 2000. Use of block inversion in the 2-D interpretation of apparent resistivity data and its comparison with smooth inversion. Journal of Applied Geophysics. 45: 63-82.
Oldenburg, D.W. and Li., Y. 1999. Estimating depth of investigation in dc resistivity and IP surveys. Geophysics. 64: 403-416.
Ologe, O. and Augie, A.I. 2020. Geophysical investigation for pre-engineering construction works in part of Ilorin, northcentral Nigeria. WASET International Journal of Geological and Environmental Engineering. 14: 341-347.
Olugbenga, T.T. and Augie, A.I. 2020. Estimation of crustal thickness within the sokoto basin north-western Nigeria using bouguer gravity anomaly data. WASET International Journal of Geological and Environmental Engineering. 14: 247–252.
Osazuwa, I.B. and Chii, E.C. 2010. Two-dimensional electrical resistivity survey around the periphery of an artificial lake in the precambrian basement complex of northern Nigeria. International Journal of Physical Science. 5: 238–245.
Oseji, J.O. 2010. Geoelectric investigation of groundwater resources and aquifer characteristics in Utagba-Ogbe kingdom Ndokwa land area of Delta State Nigeria. Journal of Enviromental Chemistry and Ecotoxicology. 2: 38–46.
Osinbajo, B. 2017. How dam damned Sokoto, Kebbi communities. Sokoto Nigeria - News Paper (Daily Trust).
Paul, I.I. and Bayode, E.N. 2012. Watershed characteristics and their implication for hydrologic response in the upper Sokoto basin Nigeria. Journal of Geography and Geology. 4: 147–155.
SARDA. (1988). Sokoto Agricultural and Rural Development Authority: Sokoto Fadama.
Sembenelli, C. 1992. Goronyo Main and Secondary Dam (2nd ed.). Sokoto, Nigeria: Milano.
Shao, P., Shang, Y., Hasan, M., Yi X., and Meng, H. 2021. Integration of ERT, IP and SP Methods in Hard Rock Engineering. Applied Sciences. 11: 10752.
Wahyu, S., Trimadona, P., and Pratomo, M. 2017. 2D resistivity and induced polarization measurement for manganese ore exploration. Journal of Physics: Conference Series. 739(2016).
OPEN access freely available online
Chiang Mai University Journal of Natural Sciences [ISSN 16851994]
Chiang Mai University, Thailand
https://cmuj.cmu.ac.th
Abdulrahaman Idris Augie1, *, Mohammed Saleh2, Oluwatoyin Ologe1, Kazeem Adeyinka Salako3, Adewuyi Abdulwaheed Rafiu3 and Muhammad Naziru Yahaya4
1 Department of Applied Geophysics, Federal University Birnin Kebbi, Nigeria.
2 Department of Physics, Bayero University Kano, Nigeria.
3 Departmant of Geophysics, Federal University of Technology Minna, Nigeria.
4 Department of Physics with Electronic, Federal University Birnin Kebbi, Nigeria.
Corresponding author: Abdulrahaman Idris Augie, E-mail: ai.augie@fubk.edu.ng
Total Article Views
Editor: Supon Ananta,
Chiang Mai University, Thailand
Article history:
Received: January 4, 2022;
Revised: April 20, 2022;
Accepted: April 26, 2022;
Published online: May 3, 2022