 ISSN: 2822-0838 Online

Clavulanic Acid - Susceptible Peptide Spectra Tested with Agar Disk Diffusion and Epsilometer test of Urinary Tract Infected Escherichia coli Isolated from the Community-Acquired Infection
Pitchaya Singhavejsakul, Piyahatai Niamsup, Naruenan Malairungsakul, Yosita Chaisaen, Phurich Pooriwarangkakul, Wutigri Nimlamool, Phadungkiat Khamnoi, Thanapat Sastraruji, and Siriwoot Sookkhee*Published Date : 2022-03-31
DOI : https://doi.org/10.12982/CMUJNS.2022.035
Journal Issues : Number 2, April-June 2022
Abstract The present study aimed to investigate clavulanic acid susceptible peptide spectra in 174 community-acquired urinary tract infected Escherichia coli isolates using VITEK® MS. They were collected from bacteriuria samples at Diagnostic Laboratory Unit between January and May 2016. One hundred and fourteen multidrug resistant isolates were detected. Among these isolates, 13, 53, and 48 isolates were classified as the non, high, and low ESBL-producers, respectively by using Epsilometer strip test. Spectrum analysis was calculated for investigating the enzyme spectrum. The mass analysis and spectrum identification of ESBL-producing isolates were elucidated using the VITEK® MS apparatus. Among 58 peptide spectra, seven E. coli-specific spectra located at 3126, 3433, 6317, 6411, 7159, 9537, and 10301 Dalton (Da) were commonly detected in ≥ 85% of the total samples. Among the high ESBL-producing isolates, the spectrum intensity of four ceftazidime-resistant spectra which were located at 4613, 5613, 6508, 9713 Da was significantly increased after being exposed to ceftazidime as the ceftazidime-resistant spectra. Using agar disk diffusion, four clavulanic acid-susceptible spectra, 3433, 4613, 4768, and 9713 Da, were significantly detected after being co-exposed to ceftazidime and amoxicillin/clavulanic acid. Interestingly, the spectrum intensity of the significant spectrum, 9713 Da, was decreased after being co-exposed to ceftazidime plus clavulanic acid using an Epsilometer strip test. The interesting peptide spectra at 9713 Da significantly exhibited the clavulanic acid-susceptibility after being co-exposed to ceftazidime and clavulanic acid in both assays and could be suspected to be the ESBL indicative peptide spectra in the high ESBL-producing isolates.
Keywords: VITEK® MS, Escherichia coli, ESBL, Clavulanic acid-susceptible peptide spectra, Community-acquired urinary tract infection
Citation: Singhavejsakul, P., Niamsup, P., Malairungsakul, N., Chaisaen, Y., Pooriwarangkakul, P., Nimlamool, W., Khamnoi, P., Sastraruji, T., and Sookkhee, S. 2021. Clavulanic acid - susceptible peptide spectra tested with agar disk diffusion and Epsilometer test of urinary tract infected Escherichia coli isolated from the community-acquired infection. CMU J. Nat. Sci. 21(2): e2022035.
INTRODUCTION
Nowadays, the problem of multidrug-resistance arises significantly due to the overuse of antibiotics (Lushniak, 2014). The most common community-acquired, multidrug-resistant bacteria are the uropathogenic Escherichia coli (Lee et al., 2018). Some strains of E. coli were reported to possess the mechanisms regarding antibiotic resistance. Four important mechanisms include the production of degrading enzymes, the expression of efflux pumps, the overexpression of porin, and the alteration of binding protein are well-known recognized. One of the degrading enzymes, Extended Spectrum β-Lactamase (ESBL) plays a role as the most common mechanism of antibiotic-resistant E. coli (Aslam et al., 2018; Lee et al., 2018). The overproduction of ESBL is leading to the high-level resistance of E. coli and other Gram-negative bacilli. This expression and production could be detected by using various techniques, for example, SDS-PAGE, 2D-PAGE, protein purification, and Matrix-Assisted Laser Desorption/Ionization Time-of-Flight Mass Spectrometry (MALDI-TOF MS) technique. Rapid detection of ESBL-producing clinical isolates is crucial for appropriate choice of antibiotic treatment and infection control. At present, this technique is carried out to identify bacterial pathogens and can be applied to predict antibiotic resistance. Despite the understanding of multidrug-resistant pathogens, the conventional methods for analyzing of distinguishing each species require unnecessarily excessive time (Cherkaoui et al., 2010). However, at present, the use of the MALDI-TOF MS technique via VITEK MS to differentiate species has been accepted as giving precise results compared to the conventional method while being more rapid (Ha et al., 2019). This technique additionally provides information regarding species and drug-resistance spectrum (Singhal et al., 2015). According to Sauget et al (Sauget et al., 2018), their research studied the antibiotic susceptibility of E. coli using MALDI-TOF MS and found that their sensitive spectra demonstrated the more decreased levels of spectra intensity. According to these previous studies as described above, the determination of antibiotic-resistant related spectra can contribute to the routine laboratory diagnosis at Maharaj Nakorn Chiang Mai Hospital to determine the antibiotic resistance within a shorter time compared to that of the conventional procedure.
This experimental study was conducted to investigate the significant peptide spectra which are related to ESBL production in considering clavulanic acid susceptibility in community-acquired E. coli isolates which recovered from the midstream voided urines for aiming to reduce the time for diagnostic laboratory process. Hence, patients can rapidly receive the appropriate antibiotic.
MATERIALS AND METHODS
Bacterial sample
The sample size was calculated with G*Power program version 3.1.9.4 by paired T-test with a priori power analysis (McCrum-Gardner, 2010). The significance level (α) was determined at 0.05, the power level (1-β) at 0.8 and the effect size at 0.4 (assuming that the effect sizes were large). The calculated sample size was at least 52 isolates.
One hundred and seventy-four isolates of the community-acquired infection of E. coli which recovered from midstream voided bacteriuria culture plates in January to May 2016 at Diagnostic Laboratory Unit, Maharaj Nakorn Chiang Mai Hospital, Chiang Mai, Thailand. The cultivable E. coli after proven by biochemical methods were performed in the present study. Colony morphology on MacConkey agar, sugar fermentation, and other relevant biochemical tests were performed to identify the species. To confirm the species of the population identified, 21 isolates of Shigella flexneri were biochemically identified to differentiate their species-specific spectra apart from E. coli spectra due to the limitations of VITEK MS in the identification of E. coli and Shigella. Purified isolates were separately stored at -80°C, Department of Microbiology, Faculty of Medicine, Chiang Mai University. They have been under the responsibility of Assist. Prof. Dr. Siriwoot Sookkhee. The positive control organisms were E. coli ATCC 25922 and ATCC 8739.
Antibiotic susceptibility
According to the Kirby-Bauer disk diffusion assay, a single colony was inoculated in Mueller Hinton Broth (MHB), then thoroughly swabbed on the surface of Mueller Hinton agar (MHA) before the antibiotic disc was placed. After incubating for 18-24 hours, inhibition zones were measured in millimeters and interpreted following the CLSI guideline of 2018 (National Committee for Clinical Laboratory Standards, 2018). The discs from 13 drugs selected in the present study were ampicillin (AMP, 30 µg), cefoxitin (FOX, 30 µg), cefotaxime (CTX, 30 µg), ceftazidime (CAZ, 30 µg), amoxicillin/clavulanic acid (AMC, 30 µg), norfloxacin (NOR, 10 µg), ciprofloxacin (CIP, 5 µg), imipenem (IPM, 10 µg), meropenem (MEM, 30 µg), piperacillin/tazobactam (TZP, 30 µg), amikacin (AK, 30 µg), gentamicin (CN, 30 µg), and tetracycline (TE, 30 µg). After considering their multidrug-resistant properties, the isolates were interpreted and categorized into susceptible, intermediate resistant and resistant groups. In the susceptible group, the isolates were susceptible to ≥ nine drugs. An isolate was considered as the resistant group if it was susceptible to ≤ six drugs. Other isolates which were susceptible to between seven and eight drugs, the intermediate resistant group, were excluded in the present study.
ESBL Detection
Double Disk Synergy Test (DDST) conducted by placing a AMC disc facing a CAZ or CTX disc 20 mm apart from on MHA was performed to determine the ESBL-producing E. coli. Isolates showing inhibition zone size of ≤ 22 mm with CAZ or ≤ 27 mm with CTX were interpreted as screening test ESBL positive. To distinguish the subpopulations of the resistant group, E-test was performed by placing a CAZ strip on one side and CAZ plus clavulanic acid (CAZplusCLAV) on the other side. MIC levels of both sides were detected. The ratio between MIC of CAZ (MICCAZ) alone and MIC of CAZplusCLAV (MICCAZplusCLAV) was calculated. The ratio cut-off of MICCAZ/MICCAZplusCLAV at 250 were from our preliminary study were performed to interpret as the high (≥250-fold) and low (<250-fold) ESBL producing isolates, respectively. Isolates showing the ratio < 8-fold were confirmed as ESBL negative or called non-ESBL producing isolates.
Identification of species-specific and ESBL indicative peptide spectra
MALDI-TOF MS was performed via VITEK® MS apparatus to identify species-specific and ESBL indicating peptide spectra by using a laser frequency of 50 Hz, laser wavelength 337 nm, ion source voltage 20 kV, and lens voltage 6 kV. The steps of MALDI-TOF MS started by fixing the sample in a crystalline matrix and showered it by laser, then the sample molecule was ionized, and the particle moved through the detector. Finally, the detector recorded the different times due to the differences in molecular weight forming the spectra of each sample. According to the agar diffusion assay, the detected spectra were categorized after being exposed to CAZ alone, and co-exposed to CAZ and AMC. According to the ESBL E-strip test, the detected spectra were analyzed after being exposed to CAZ alone, and co-exposed to CAZ and CLAV. The significant spectra would be present in mass (Da) and spectrum intensity (intensity arbitrary %).
Data analysis
SPSS Statistics (Statistical Package for the Social Sciences) was used to analyze the significant difference of spectra. Identifications of species-specific spectra found in the frequency at 85% of total isolates were calculated. Susceptible and stress spectra specifically found in each group were analyzed by Paired T-test after being exposed to CAZ. After determined with E-strip test, Paired T-test was also performed to compare the significant spectrum of E. coli between the intensity of CAZ and the intensity of CAZ plus clavulanic acid. The level of statistical significance (α) = 0.05, the power level (1-β) = 0.8.
RESULTS
Among 174 community-acquired urine collected E. coli isolates, 30 (17.24%), 30 (17.24%), and 114 (65.52%) isolates were classified into the susceptible, intermediate resistant, and resistant groups according to their antibiotic susceptibilities. One hundred and fourteen isolates of the resistant group were selected to further study.
The tested isolates showed different results in their antibiotic susceptibility. According to the susceptible agents, MEM (100%), AK (100%), and CN (100%) were the most effective agents against the tested E. coli. Out of 13 agents tested, four were found effective only for less than 10% of the isolates tested. They were CTX, CAZ, AMP, and TE. ESBL productions were detected in 101 (88.60% of 114) resistant isolates after being tested using the double-disk diffusion and ESBL E-strip tests. The antimicrobial susceptibility of total tested isolates and only the ESBL producing groups against a spectrum of 13 selected drugs were presented in Figure 1. According to the cut-off of the MICCAZ/MICCAZplusClav ratio, 13, 53, and 48 resistant isolates were categorized into the non, high, and low ESBL-producing groups, respectively.
Total of 58 peptide spectra, seven spectra which located at 3126 (91.04%), 3433 (86.57%), 6317 (95.52%), 6411 (90.67%), 7159 (92.91%), 9537 (86.94%), and 10301 (86.57%) Da were commonly detected more than 85% of the total samples and may be suggested as the E. coli-specific spectra which differently shown from the spectra of tested S. flexneri, the close species that gave the misidentification. The scattering data exhibit as % frequency in all tested isolates (Figure 2).
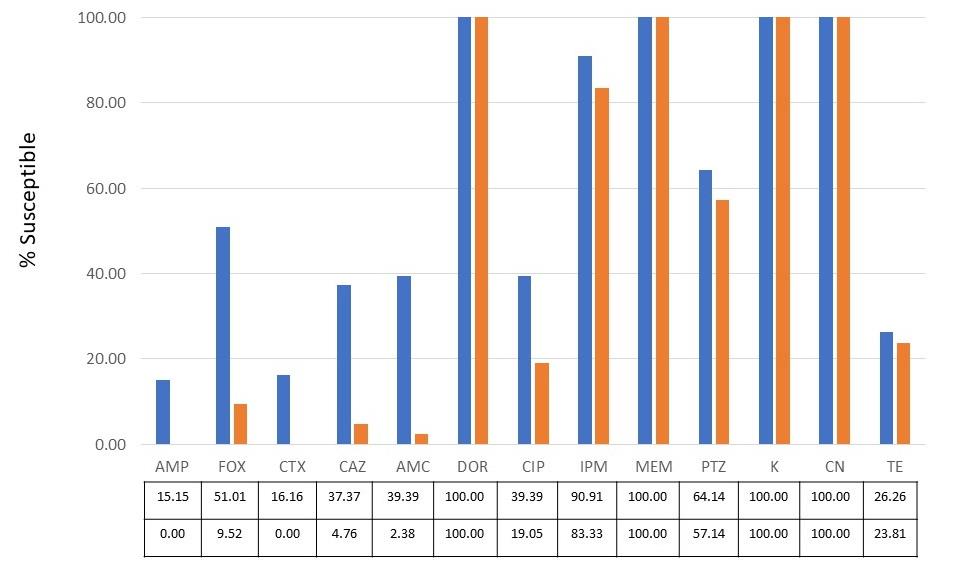
Figure 1. Percentage susceptibility of 13 antibiotics toward total tested isolates (blue bar) and ESBL-producing group (orange bar) as shown in the details in the box.
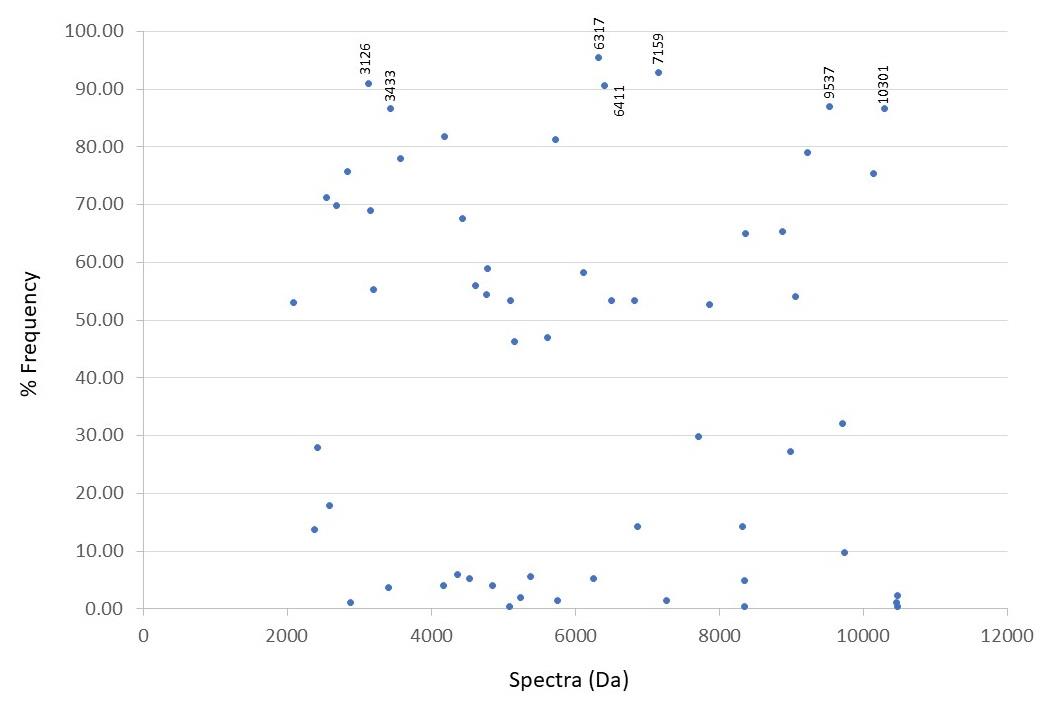
Figure 2. Percentage frequency of numbers of spectra detected in total tested isolates.
The significant spectra after comparing the CAZ-exposed and CAZ-nonexposed areas are shown in Table 1. Apart from seven E. coli-specific spectra, seven out of 51 spectra including 2689, 3578, 4185, 4438, 5726, 8369, and 10139 Da exhibited a significant decrease in spectrum intensity after being exposed to CAZ (P < 0.05). These spectra were supposed to be the CAZ-susceptible spectra. Four of these spectra, 4185 (P = 0.039), 4438 (P = 0.048), 5726 (P = 0.024), and 10139 (P = 0.002) Da could be detected only in the susceptible group. One spectrum, 3578 Da, could be significantly detected both in the susceptible (P = 0.043) and non-ESBL-producing groups (P = 0.001). A significant spectrum, 8369 Da, was also detected both in the susceptible (P = 0.003) and ESBL-producing groups (P = 0.013) while a significant spectrum was demonstrated at 2689 Da only in the non-ESBL-producing group (P = 0.007). Four spectra which were located at 4613 (P = 0.008), 5613 (P = 0.018), 6508 (P = 0.045), and 9713 (P = 0.016) Da have detected a significant increase of spectrum intensity after being exposed to CAZ only in the ESBL producing groups. They may be supposed as the CAZ-resistant or stress spectra. They should be also confirmed after comparing the exposure with CAZ alone, and the co-exposure with CAZ and AMC. Interestingly, only one significant spectrum located at 9713 Da was distinguishingly increased in the ESBL producing group (n=114) but not demonstrated in the susceptible (n = 60) and non-ESBL-producing (n = 10) groups.
The significant spectra were only detected in the high ESBL-producing group which showed the decreasing of spectrum intensity after co-exposed to CAZ and AMC (blue bar) compared with CAZ-exposed alone (orange bar) as shown in Figure 3. Two clavulanic acid-susceptible spectra located at 4613 and 9713 Da in Figure 3A exhibit a significant reduction after being exposed to clavulanic acid at P = 0.018, and < 0.001, respectively. They may be suspected to be ESBL indicative peptide spectra. However, the spectrum 4613 Da was also detected in the susceptible group. It should be also confirmed in the experiment of the E-strip test between CAZ and CAZplusClav.
|
Table 1. Susceptible, stress, and resistant spectra found in the susceptible, resistant with ESBL, and non-ESBL-producing groups.
|
|||||||||||||
|
Spectra (Da) |
Susceptible |
Resistant with non-ESBL-producing |
Resistant with ESBL-producing |
Interpretation of |
|||||||||
|
Spectrum intensity |
% paired |
P-value |
Spectrum intensity |
% paired |
P-value |
Spectrum intensity |
% paired |
P-value |
CAZ-exposed spectra |
||||
|
CAZ exposed |
CAZ non exposed |
CAZ exposed |
CAZ non exposed |
CAZ exposed |
CAZ non exposed |
||||||||
|
2689 |
46474 |
79434 |
86 |
NS |
51062 |
70516 |
91 |
0.007 |
49355 |
69958 |
91 |
NS |
Susceptible |
|
3578 |
30530 |
69068 |
50 |
0.043 |
40063 |
63233 |
74 |
0.001 |
38045 |
66226 |
83 |
NS |
Susceptible |
|
4185 |
45828 |
79217 |
68 |
0.039 |
61184 |
80875 |
78 |
NS |
56444 |
68468 |
83 |
NS |
Susceptible |
|
4438 |
74779 |
123212 |
45 |
0.048 |
70699 |
100587 |
52 |
NS |
71776 |
105548 |
65 |
NS |
Susceptible |
|
4613 |
117674 |
94135 |
50 |
NS |
99283 |
77635 |
26 |
NS |
87207 |
44227 |
35 |
0.008 |
Resistant |
|
5613 |
21504 |
22825 |
45 |
NS |
21603 |
11325 |
35 |
NS |
22581 |
10854 |
30 |
0.018 |
Resistant |
|
5726 |
14532 |
22344 |
82 |
0.024 |
15194 |
18331 |
78 |
NS |
12191 |
16936 |
74 |
NS |
Susceptible |
|
6508 |
14320 |
22833 |
18 |
NS |
9986 |
17716 |
52 |
NS |
14134 |
11102 |
35 |
0.045 |
Resistant |
|
8369 |
16357 |
42860 |
64 |
0.003 |
40341 |
44491 |
78 |
NS |
22057 |
39953 |
74 |
0.013 |
Susceptible |
|
9713 |
ND |
ND |
|
|
ND |
ND |
|
|
78079 |
45396 |
57 |
0.016 |
Resistant |
|
10139 |
7607 |
10267 |
73 |
0.002 |
7088 |
9581 |
70 |
NS |
6959 |
8035 |
52 |
NS |
Susceptible |
Note: NS, Not significant (P > 0.05); ND, Not detected; % paired, The percentage of isolate finding the spectra after being exposed and non-exposed to CAZ; Bold number shows the significant spectra.
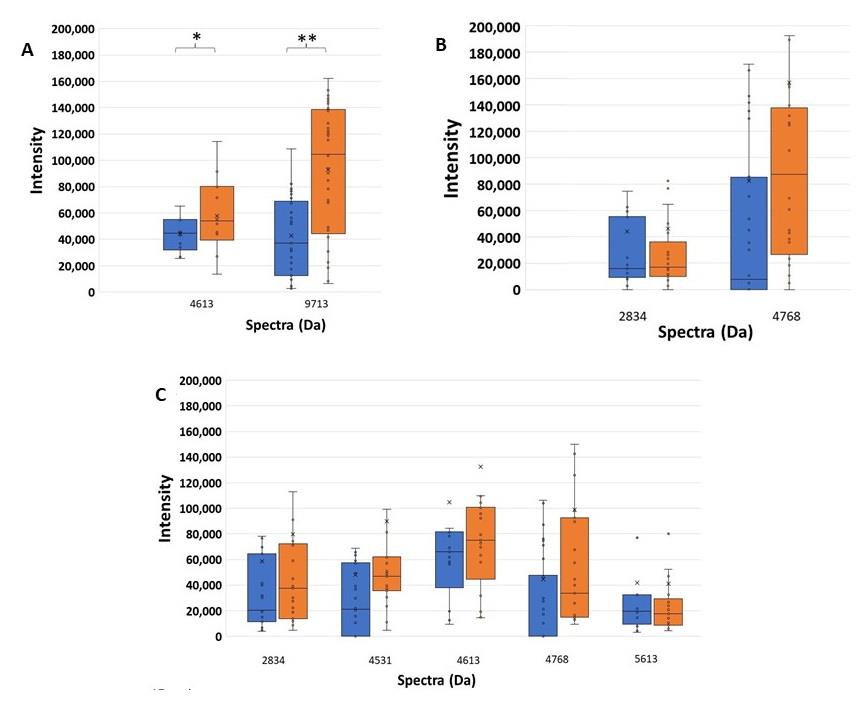
Figure 3. Higher spectrum intensity of CAZ-resistant spectra comparing between the exposure of CAZ and AMC (blue), and CAZ alone (orange) of peptide spectra in (A) the high ESBL-producing, (B) the low ESBL-producing, and (C) the susceptible groups. *, P - value < 0.05; **, P - value ≤ 0.001.
Among the AMC resistant spectra, 3, 3, and 5 significant spectra were detected in the high, low ESBL-producing, and susceptible groups. The intensities of these spectra were not decreased with the effect of clavulanic acid. These spectra may be categorized as AMC- or clavulanic acid- resistant spectra, and then were not interpreted to be ESBL indicative peptide spectra. Three significant spectra, 3204, 3578, and 4438 Da were demonstrated in the high ESBL-producing group. Three significant spectra, 3578, 7872, 8875 Da were demonstrated in the low ESBL-producing group. Five significant spectra, 3578, 4185, 7872, 8369, 8875 Da were demonstrated in the susceptible group. These AMC-resistant spectra could be divided into four patterns. Firstly, a spectrum located at 3578 Da was significantly detected in the high, low ESBL-producing and susceptible groups, P < 0.001, = 0.001, and = 0.043, respectively. Secondly, two spectra located at 7872 and 8875 Da were significantly detected in the low ESBL-producing and susceptible groups, P < 0.001 and < 0.001, and P < 0.001 and < 0.001, respectively. Thirdly, two spectra located at 4185 and 8369 Da were significantly detected only in the susceptible group, P = 0.028 and = 0.003. Fourthly, two spectra, 3204 and 4438 Da were significantly detected only in the high ESBL-producing group, P = 0.052 and < 0.001, respectively.
To confirm the spectra related to ESBL production, the decreasing intensity of spectra should be detected in the co-exposure between CAZ and clavulanic acid (CAZplusClav side of ESBL E-strip). At a selected colony at each side of the E-strip test, their different spectrum intensities between the exposure with CAZ alone and CAZplusClav were illustrated. Among 144 detected spectra after tested using E-test, the increasing spectrum intensities of two spectra, 5097 and 5793 Da, were significantly different after compared between the exposure of CAZ and the co-exposure of CAZplusClav at the significant different values (P ≤ 0.001) among the spectrum intensity of the low and high ESBL-producing groups as shown in Figure 5. They were assumed as the clavulanic acid-resistant spectra of the low and high ESBL- producing groups.
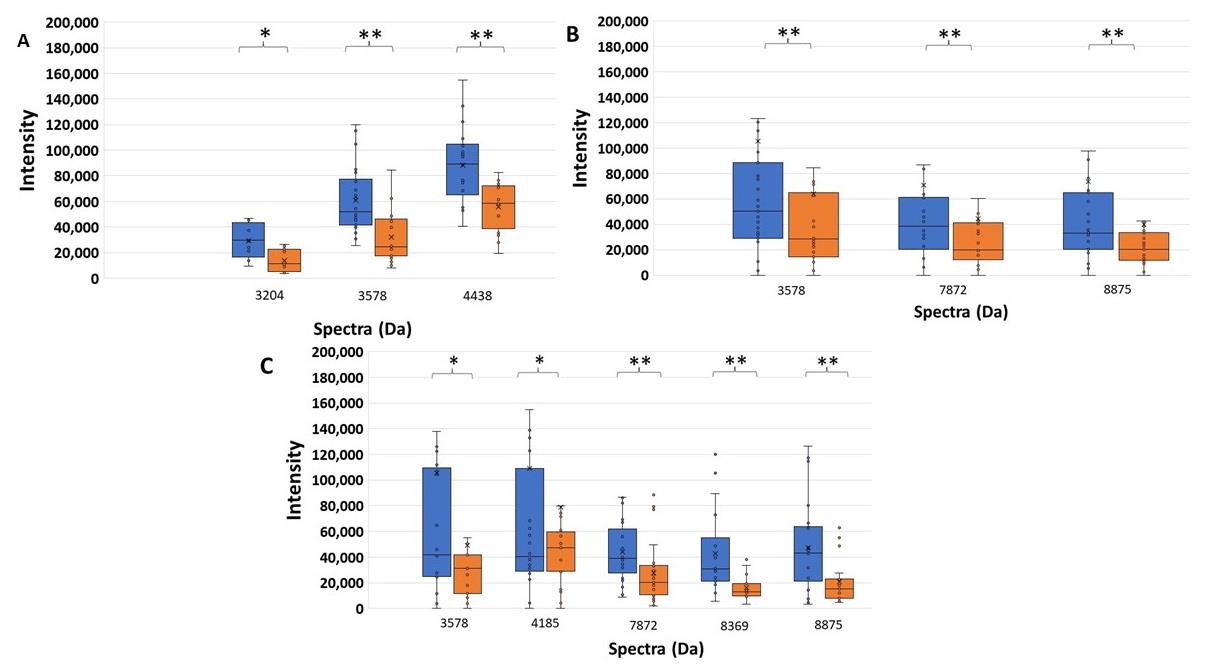
Figure 4. Higher significant spectrum intensity of AMC-resistant spectra comparing the exposure of CAZ and AMC (blue), and CAZ alone (orange) of peptide spectra in (A) the high ESBL-producing, (B) the low ESBL-producing, and (C) the susceptible groups. *, P - value < 0.05; **, P - value ≤ 0.001.
As the manner of ESBL enzyme, the suspected spectra should be decreased after co-exposed with CAZplusClav using E-test. It could be said that they were clavulanic-susceptible or ESBL-indicative peptide spectra. Only two significant spectra (P ≤ 0.001) demonstrated clavulanic acid susceptibility in the high ESBL-producing group including 4856 and 9713 Da as shown in Figure 6. They may play a role of ESBL manner after comparing the exposure with CAZ alone and the co-exposure with CAZplusClav in the high ESBL-producing group. There was no significant difference in spectrum intensity of 9713 Da in the low ESBL-producing group. It may be suggested that the suspected ESBL spectra could be illustrated only in the high ESBL-producing group as shown in Figure 7 while the spectrum 4856 Da demonstrated a significant difference in the low ESBL-producing group.
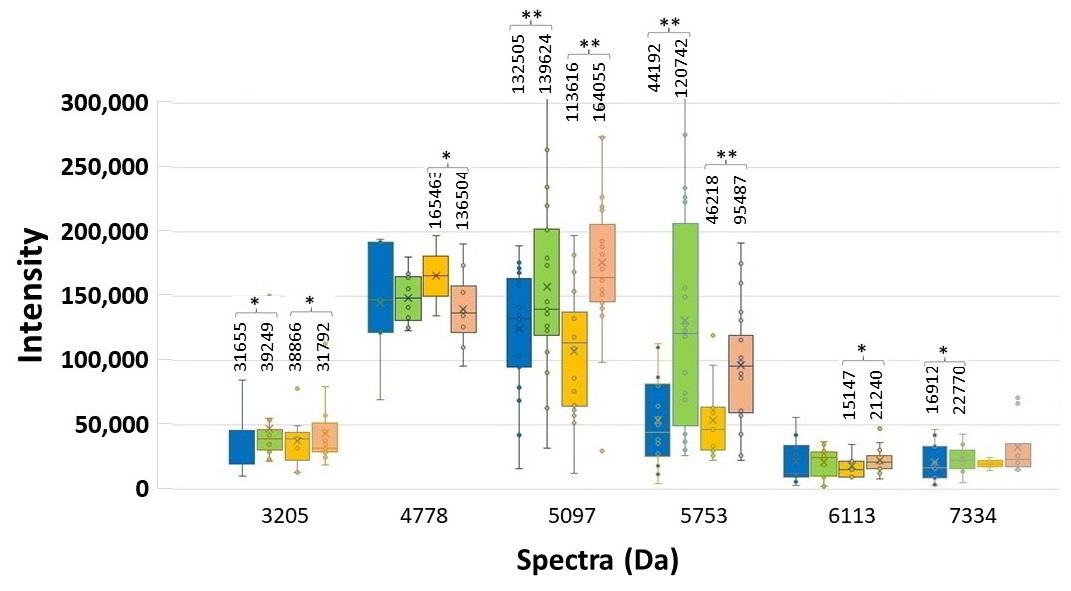
Figure 5. Spectrum intensity of each significant spectrum of the high and low ESBL-producing group. ESBL E-strip test was performed. CAZ-exposed spectra of low (blue bar) and high (orange bar) and, and CAZplusClav-exposed spectra of low (green bar) and high (pink bar) are illustrated with the median values. Significant difference at *P < 0.05; **P ≤ 0.001.
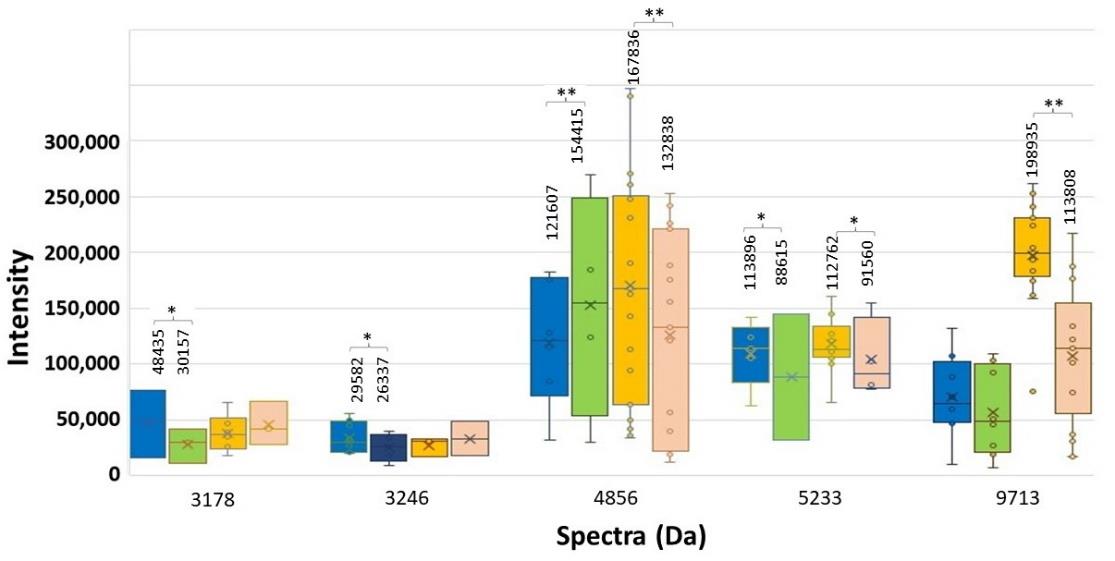
Figure 6. Spectrum intensity of each significant spectrum of the high and low ESBL-producing group. ESBL E-strip test was performed. CAZ-exposed spectra of low (blue bar) and high (orange bar) and, and CAZplusClav-exposed spectra of low (green bar) and high (pink bar) are illustrated with the median values. Significant difference at *P < 0.05; **P ≤ 0.001.
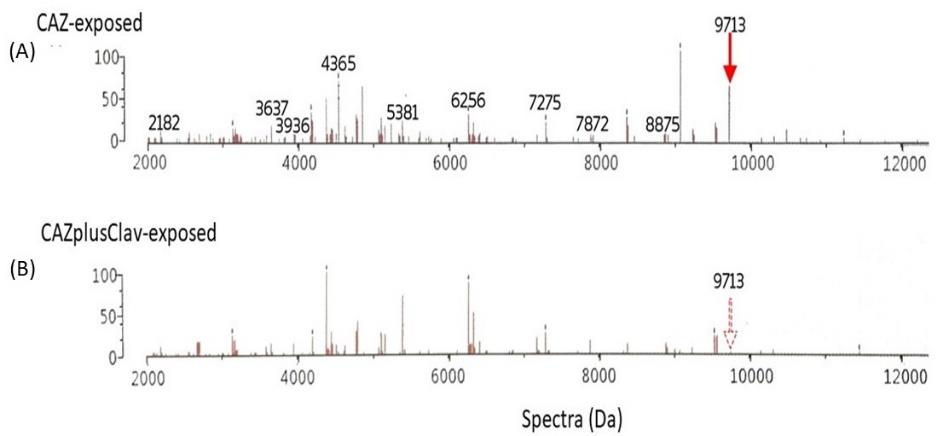
Figure 7. Comparison of the decreasing intensity of interesting spectrum at 9713 Da as the clavulanic acid-susceptible or ESBL peptide spectra in the high ESBL-producing group after exposure to CAZ (A) and CAZplusClav (B) using E-test. The figure shows the spectra in Da unit (x-axis) and % arbitrary intensity (y-axis).
DISCUSSION
MALDI-TOF MS is a technique by VITEK MS used in Maharaj Nakorn Chiang Mai Hospital for the identification of pathogenic microorganisms. Many studies indicated the method to be accurate in the identification of the bacteria at the species and genus level (Dubois et al., 2012; Luo et al., 2015) having 98.6% of sensitivity (Kim et al., 2015) and 99.5% of specificity (Su Topalca U, 2017). The technique is considered to be time-saving and cost-effective (Kwanhian, 2013). MALDI-TOF MS is currently limited to distinguish between Shigella spp. and E. coli (Richter et al., 2013). Consequently, urine specimen and TSI test (conventional identification) were performed to assure the exclusion of Shigella spp. Moreover, some studies stated that the technique was able to identify the ability of antibiotic susceptibility. The study by Centonze et al. (Centonze et al., 2018) indicated the relation between the 11109-spectrum detected by MALDI-TOF MS and Klebsiella pneumoniae carbapenemase (KPC) production. According to Li et al (Li et al., 2018), MALDI-TOF could detect AmpC production of Enterobacteriaceae and non-fermenting gram-negative bacteria. In the present study, this benefit of technique was carried out to identify statistically significant spectra found in the antibiotic exposed and nonexposed groups. The clavulanic acid-resistant spectra occur when the spectrum intensity of co-exposure with CAZ and clavulanic acid was higher than the CAZ-exposed alone. Clavulanic acid-susceptible spectra indicate the spectrum intensity of co-exposure with CAZ and clavulanic acid was lower than the CAZ-exposed alone.
Due to the susceptible manner of ESBL enzyme for clavulanic acid, it may be explained that the significant reductions of spectrum intensity were affected by the action of clavulanic acid. The spectrum intensity of ESBL spectra after co-exposure with CAZ and AMC should decline after comparison to the exposure with CAZ alone. It was demonstrated that the spectra at 4613 and 9713 Da were significantly susceptible to clavulanic acid and then suspected above to be ESBL indicative peptide spectra in the high ESBL-producing group as illustrated in Figure 3. They exhibited the median values of the spectrum intensity. It could be suggested that they may play a role as the resistant spectra, assumably the ESBL spectra. Their significant differences were not detected in the low ESBL-producing groups.
At the E-strip containing CAZ and CAZplusClav, the inactivation of the ESBL enzyme was interpreted from the decrease of spectrum intensity after being co-exposed to CAZplusClav. It was the clavulanic acid susceptible manner. An E-strip test was performed to be confirmed for the elucidating spectra in the low and high ESBL-producing groups. Among 11 spectra exhibiting the statistically significant difference of intensity in the low and high ESBL-producing groups. Besides, 6 out of 11, at 3205, 4778, 5097, 5753, 6113, and 7334 Da exhibited an increase in spectrum intensity after being co-exposed with CAZplusClav. However, there were only five spectra at 3178, 3246, 5151, 8448, 9713, and 10528 Da where the reductions of their spectra were found in both exposure of CAZplusClav by using the E-strip test. Interestingly, only significant spectra (P ≤ 0.001) were further mentioned. To conclude the ESBL indicative spectra results from the comparison between the CAZ-exposed and CAZ-nonexposed groups, the significant spectra were located at 4613, 5613, 6508, and 9713 Da. According to agar disk diffusion, two spectra, 4613 and 9713 Da were demonstrated as the suspected spectra. The investigation using the E-strip test showed three spectra including 4532, 4856, and 9713 Da were significantly decreased after being exposed to clavulanic acid that combined with ceftazidime. Due to the presence of significant spectra in all experiments, it may be concluded that spectra located at 9713 Da were suspected as ESBL indicative spectra especially in the high ESBL-producing group. Previously, the earlier study of our laboratory showed that four peptide spectra, 5968, 7153, 9713, and 10477 Da, were detected after being exposed with various β-lactams including ceftazidime (Lananta, 2021). In the same study also suggested that the spectra at 8371 and 9713 Da may be responsible as the hydrolysis of ceftazidime. Differently, results of the present study revealed that the peptide spectrum at 9713 Da was only the spectrum with responsible for clavulanic acid inactivation of ESBL for ceftazidime exposure of the high ESBL-producing E. coli.
CONCLUSION
It may be concluded that some proteomic spectrum at 9713 Da was only shown as the significant spectra in the high ESBL-producing group of E. coli and was suspected as the significant ESBL-indicative peptide spectra after being exposed with clavulanic acid in a high ESBL-producing group. This may help the clinicians to choose the antibiotic used from the presence of the interesting spectrum.
ACKNOWLEDGEMENTS
This work was financial supported by the Faculty of Medicine, Chiang Mai University. We would like to express our gratitude to Assist. Prof. Parichart Palee, Department of Medicine, Faculty of Medicine, Chiang Mai University, for her invaluable guidance that greatly assisted the MALDI-TOF MS technique. We wish to thank Mr. Bunyong Khuntawa and his colleagues at the Division of Central Laboratory, Maharaj Nakorn Chiang Mai Hospital, for their help in performing VITEK® MS to identify species and manipulate VITEK® MS. We are also grateful to our technicians who provide us laboratories.
AUTHOR CONTRIBUTIONS
Pitchaya Singhavejsakul and Piyahatai Niamsup wrote the research proposal, did the experiments, analyzed peptide spectra, and wrote the manuscript. Yosita Chaisaen and Phurich Pooriwarangkakul collected the peptide spectra and wrote the manuscript. Naruenan Malairungsakul did the experiment and collected the peptide spectra. Phadungkiat Khamnoi provided the VITEK-MS technique. Thanapat Sastraruji analyzed the data. Wutigri Nimlamool proved the manuscript. Siriwoot Sookkhee provided the conception and designed the experiment, consulted the research proposal and submitted the research funding, provided the bacterial isolates and techniques, and wrote the manuscript. All authors approved the final manuscript.
CONFLICT OF INTEREST
The authors declare that there is no conflict of interest.
ETHICS STATEMENT
No human or animal experiments were performed.
REFERENCES
Aslam, B., Wang, W., Arshad, M.I., Khurshid, M., Muzammil, S., Rasool, M.H., et al. 2018. Antibiotic resistance: a rundown of a global crisis. Infect Drug Resist, 11, 1645-1658.
Centonze, A.R., Bertoncelli, A., Savio, C., Orza, P., Bedenić, B., and Mazzariol, A. 2018. Evaluation of rapid KPC carbapenemase detection method based on MALDI-TOF VITEK MS spectra analysis. Journal of Medical Microbiology. 67: 1474-1479.
Cherkaoui, A., Hibbs, J., Emonet, S., Tangomo, M., Girard, M., Francois, P., et al. 2010. Comparison of two matrix-assisted laser desorption ionization-time of flight mass spectrometry methods with conventional phenotypic identification for routine identification of bacteria to the species level. Journal of Medical Microbiology. 48: 1169-1175.
Dubois, D., Grare, M., Prere, M.F., Segonds, C., Marty, N., and Oswald, E. 2012. Performances of the Vitek MS Matrix-Assisted Laser Desorption Ionization-Time of Flight Mass Spectrometry system for rapid identification of bacteria in routine clinical microbiology. Journal of Clinical Microbiology. 50: 2568-2576.
Ha, S.M., Kim, C.K., Roh, J., Byun, J.H., Yang, S.J., Choi, S.B., et al. 2019. Application of the whole genome-based bacterial identification system, TrueBac ID, using clinical isolates that were not identified with three Matrix-Assisted Laser Desorption/Ionization Time-of-Flight Mass Spectrometry (MALDI-TOF MS) systems. Annals of Laboratory Medicine. 39: 530-536.
Kim, Y., Park, K.G., Lee, K., and Park, Y.J. 2015. Direct identification of urinary tract pathogens from urine samples using the Vitek MS system based on Matrix-Assisted Laser Desorption Ionization-Time of Flight Mass Spectrometry. Annals of Laboratory Medicine. 35: 416-422.
Kwanhian, W. 2013. The bacteria identification automate in MALDI-TOF Mass Spectrometry system. Journal of Medical Technology and Physical Therapy. 25: 120-131.
Lananta, S., Siriratanagool, P., Sommanawan, N., Lerttrakarnnon, P., Boonchuay, S., Jirawattanapong, S., Manochomphu,S., Sastraruji, T., and Sookkhee, S. 2021. Different responses of ESBL indicative peptide spectra to various β- Lactam exposures among community acquired urinary tract infected Escherichia coli by using the MALDI-TOF technique. Chiang Mai University Journal of Natural Sciences. 20: e2021095.
Lee, D.S., Lee, S.J., and Choe, H.S. 2018. Community-acquired urinary tract infection by Escherichia coli in the era of antibiotic resistance. BioMed Research International. 2018: 7656752.
Li, C., Ding, S., Huang, Y., Wang, Z., Shen, J., Ling, H., et al. 2018. Detection of ampc β-lactamase-producing gram-negative bacteria by matrix-assisted laser desorption/ionization time-of-flight mass spectrometry. Journal of Hospital Infection. 99: 200-207.
Luo, Y., Siu, G.K.H., Yeung, A.S.F., Chen, J.H.K., Ho, P.L., Leung, K.W., et al. 2015. Performance of the VITEK MS matrix-assisted laser desorption ionization-time of flight mass spectrometry system for rapid bacterial identification in two diagnostic centres in China. Journal of Medical Microbiology. 64: 18-24.
Lushniak, B.D. 2014. Antibiotic resistance: a public health crisis. Public Health Reports. 129: 314-316.
McCrum-Gardner, E. 2010. Sample size and power calculations made simple. International journal of therapy and rehabilitation, 17: 10-14.
National Committee for Clinical Laboratory Standards. 2018. Performance standards for antimicrobial susceptibility testing M100. Twenty eighth ed. (Vol. Twenty eighth). Wayne, PA: National Committee for Clinical Laboratory Standards.
Richter, S.S., Sercia, L., Branda, J.A., Burnham, C.A., Bythrow, M., Ferraro, M.J., et al. 2013. Identification of enterobacteriaceae by matrix-assisted laser desorption/ionization time-of-flight mass spectrometry using the VITEK MS system. European Journal of Clinical Microbiology & Infectious Diseases. 32: 1571-1578.
Sauget, M., Bertrand, X., and Hocquet, D. 2018. Rapid antibiotic susceptibility testing on blood cultures using MALDI-TOF MS. PLoS One. 13: e0205603.
Singhal, N., Kumar, M., Kanaujia, P.K., and Virdi, J.S. 2015. MALDI-TOF mass spectrometry: an emerging technology for microbial identification and diagnosis. Front Microbiology. 6: 791.
Su Topalca U, S. N., Anliacik N, Bulut ME, Aktas E. 2017. The evaluation of urine samples by Gram-staining and Matrix Assisted Laser Desorption/Ionization Time-of-Flight Mass Spectrometry (MALDI-TOF MS) in rapid diagnosis of urinary tract infections. Şişli Etfal Hastanesi tıp bülteni. 51: 298-302.
OPEN access freely available online
Chiang Mai University Journal of Natural Sciences [ISSN 16851994]
Chiang Mai University, Thailand
https://cmuj.cmu.ac.th
Pitchaya Singhavejsakul1, Piyahatai Niamsup1, Naruenan Malairungsakul1, Yosita Chaisaen1, Phurich Pooriwarangkakul1, Wutigri Nimlamool2, Phadungkiat Khamnoi3, Thanapat Sastraruji4, and Siriwoot Sookkhee1, *
1 Department of Microbiology, Faculty of Medicine, Chiang Mai University, Chiang Mai 50200, Thailand
2 Department of Pharmacology, Faculty of Medicine, Chiang Mai University, Chiang Mai 50200, Thailand
3 Diagnostic Laboratory Unit, Maharaj Nakorn Chiang Mai Hospital, Faculty of Medicine, Chiang Mai University, Chiang Mai 50200, Thailand
4 Dentistry Research Center, Faculty of Dentistry, Chiang Mai University, Chiang Mai 50200, Thailand
Corresponding author: Siriwoot Sookkhee, E-mail: siriwoot.s@cmu.ac.th
Total Article Views
Editor: Veerasak Punyapornwithaya,
Chiang Mai University, Thailand
Article history:
Received: November 16, 2021;
Revised: March 9, 2022;
Accepted: March 10, 2022;
Published online: March 22, 2022