 ISSN: 2822-0838 Online

Evaluating Forest Cover Changes in Protected Areas Using Geospatial Analysis in Chiang Mai, Thailand
Kyuho Lee, Prasit Wangpakapattanawong, and Watit Khokthong*Published Date : 2022-03-31
DOI : https://doi.org/10.12982/CMUJNS.2022.030
Journal Issues : Number 2, April-June 2022
Abstract Protected areas have been developed in Thailand to conserve the natural environment required for wildlife and human beings, and to prevent disasters. It is necessary to address doubts about effectiveness of protected areas because regulations have been changed or are ignored in some communities and regions, especially in Chiang Mai province, which is facing the loss of natural forest areas under area transformations. Therefore, it is necessary to evaluate the effectiveness of forest protected areas. To do this, this study focused on analyzing multi-year land cover changes in Chiang Mai over two decades (1995-2015) with four land cover types: forest, agriculture, urban, and water bodies, inside and outside protected areas. The results suggest that the establishment of forest protected areas assisted to curtail urban expansion compared to non-protected areas. The protected areas effectively kept the number of divided forest patches small, and the forest patches were larger than in non-protected areas. We detected clearing of forests in protected areas, where they were transformed into agricultural areas. However, agricultural patches in protected areas were smaller and in higher densities than in non-protected areas. We conclude that the main contribution of forest cover loss in Chiang Mai is transition to agricultural areas, and that designated national parks and wildlife sanctuaries could help to effectively conserve such forest areas.
Keywords: Land cover change, Land transformation, Protected areas, Non-protected areas, Geographic Information Systems (GIS)
Citation: Lee, K., Wangpakapattanawong, P., and Khokthong, W. 2022. Evaluating Forest Cover Changes in Protected Areas Using Geospatial Analysis in Chiang Mai, Thailand. CMU J. Nat. Sci. 21(2): e2022030.
INTRODUCTION
Historical forest cover can have a strong impact on forested protection areas in Thailand (Suksawang, 2018). The Department of National Parks, Wildlife and Plant Conservation (DNP) is one of the outstanding governmental conservation agencies that plays significant roles in forest protection in Thailand by maintaining protected areas, which covered about 22.8% of Thailand’s land area in 2020 (DNP, 2017). Many national parks and wildlife sanctuaries were successfully established based on habitat suitability and these areas have been well managed under previous and present forest protection programs (Sharp and Nakagoshi, 1997; Singh et al., 2021). In addition, to sustain flora and fauna in Thailand, conservation areas and hotspots of threatened birds and mammals were widely established within the forest-protected areas (Techachoochert et al., 2018).
In northern part of Thailand, Chiang Mai province is naturally suited for ecotourism. In or near the boundaries of representative protected areas in Chiang Mai, homestays, stores, and farms are operated by local people and government organizations, e.g., Doi Suthep-Pui National Park (Elliott et al., 2018; Elliott et al., 2019) and Doi Inthanon National Park (Kaewnuch, 2017). So far, this situation has contributed to deforestation even though protected areas were established. Therefore, preventing forest cover change is challenging, and one way to do so is to ensure the effectiveness of protected areas where some management exist (Suksawang, 2018).
Complementary geographic information system (GIS) databases for landscape assessment and wildlife conservation helped to develop plans for protected areas in Chiang Mai (Nasa et al., 2008; Kongsawi et al., 2020). To improve the effectiveness of forest protected areas in Chiang Mai, geospatial analysis is needed to be applied to information on land cover maps. Accordingly, landscape studies such as of quantitative land cover change can partially support environmental protection (Abad-Segura et al., 2020). Trends in land cover change, such as expanding in a particular area or shrinking of patch size, are important factors in landscape studies, especially for valuable natural forests (Khokthong, 2019). The analysis may involve a designation of protected areas integrating with land-use change detection. In some protected areas, the forest cover and its spatial characteristics may be more affected by human activities, policies, and regulations because in these areas various goals of environmental conservation were considered, considering many factors such as human population and community demands (Trisurat et al., 2010; Singh et al., 2021). The protected area network also depends on government organizations (Trisurat, 2007). There may be doubts about the effectiveness of protected areas because regulations are easily changed or ignored by diverse stakeholders, while forest cover areas have been decreasing.
The objectives of the study were to 1) detect land cover changes in Chiang Mai province over two decades (1995-2015) using land cover maps and GIS tools, and in particular, 2) determine the effectiveness of designated protected areas on forest protection.
MATERIALS AND METHODS
Study area
Chiang Mai province is located between latitudes 17°5' 54″ N and 20° 8' 57″ N and between longitudes 98° 1' 54″ E and 99° 34' 25″ E, with an average elevation of 310 m above mean sea level (Chaikaew et al., 2009; Ruthamnong, 2017).
Data processing
Land cover maps generated from the European Space Agency (ESA) Climate Change Initiative (CCI) (ESA, 2017) were used to assess different land cover changes among different land protection categories. The land cover maps from 1995, 2005, and 2015 were downloaded. All land cover maps had 300 m pixel resolution using the World Geodetic System 84 (ESA, 2017). The boundary of Chiang Mai province in 2019 was extracted from the Humanitarian Data Exchange (HDX) v1.52.14, which is an open platform for sharing data and downloadable GIS files (HDX, 2019). All the downloaded land cover maps were extracted within the boundary of Chiang Mai province, then were reclassified from 37 original land cover types to four land cover types: forest (F), agriculture (A), urban (U), and water body (W), using the “Reclassify” tool (Table 1 and Figure 1). Then, the areas of national parks and wildlife sanctuaries, as nationally designated protected areas based on the GIS dataset from the United Nations Environment World Conservation Monitoring Centre (UNEP-WCMC and IUCN, 2021), were extracted from all the reclassified land cover maps using the “Clip by Mask” tool. To extract land covers in the non-protected areas, the “Erase” tool was used. All data processing was done using ArcMap software.
Table 1. Four reclassified land cover types.
|
Reclassified land cover |
Abbreviation |
Initial legends from ESA-CCI land cover |
|
Forest |
F |
Trees, shrubs, and mosaic cover of them |
|
Agriculture |
A |
Cropland, rainfed, and irrigated land |
|
Urban |
U |
Urban areas |
|
Water body |
W |
Water bodies (natural/artificial, standing/flowing) |
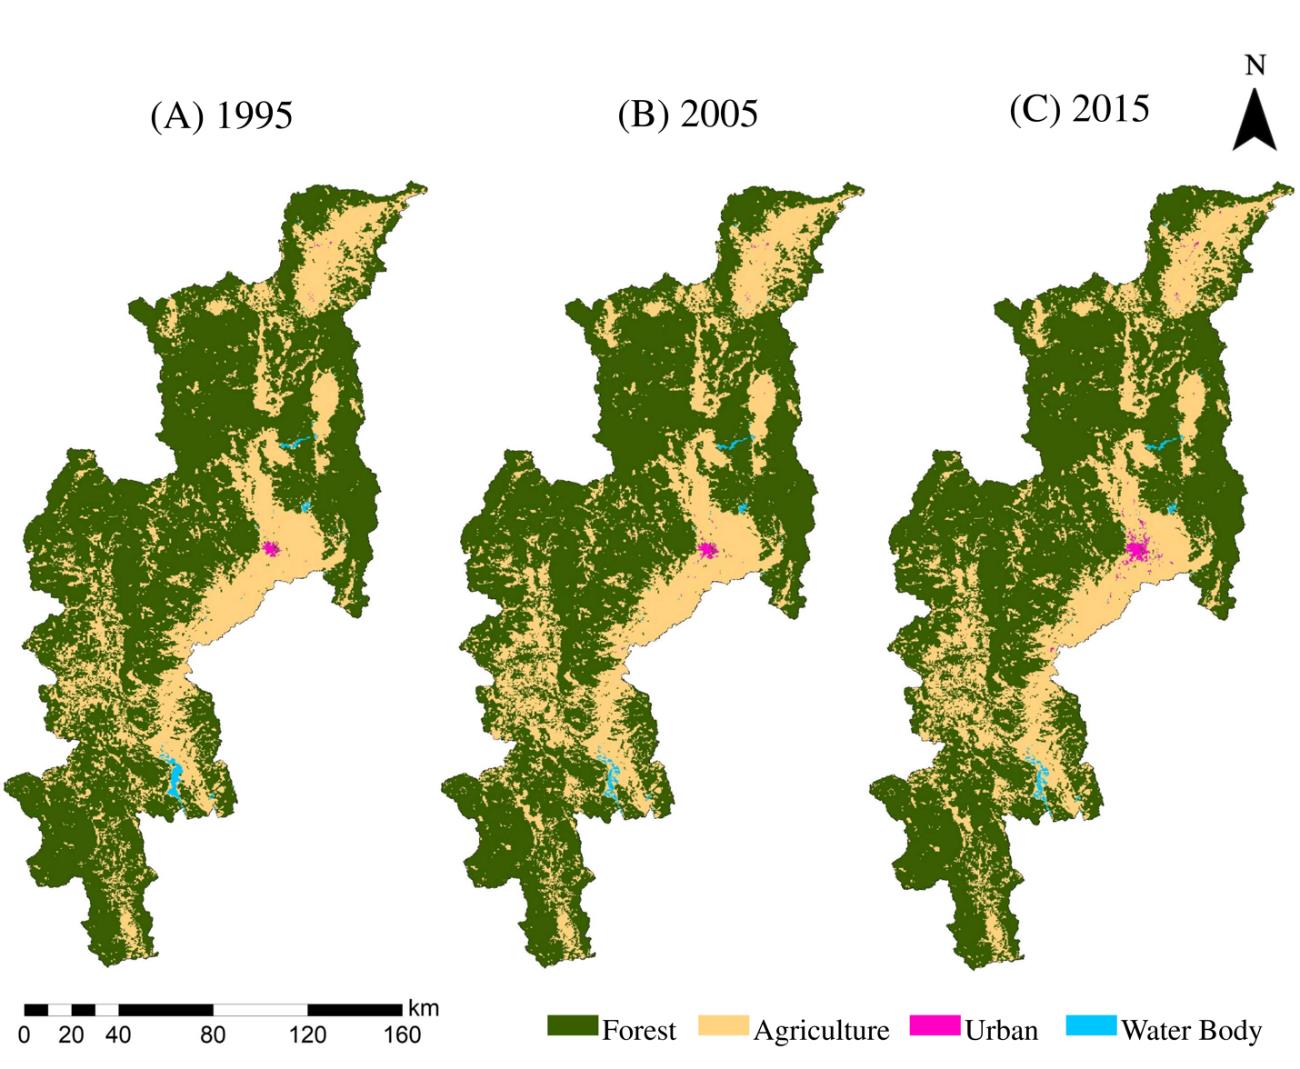
Figure 1. Land cover maps for the years (A) 1995, (B) 2005, and (C) 2015.
Analyses of land cover change and landscape indices
Change detection analysis of land cover was conducted for ten-year intervals (1995-2005, and 2005-2015) to observe different trends of land cover changes in national parks, wildlife sanctuaries, and non-protected areas. Changes over 20 years (1995-2015) were also analyzed. Then, the change in area for each land cover type was calculated by comparing to its initial cover for both the protected and non-protected areas (Table 2). Moreover, total area, mean patch area, largest patch index, and patch density as landscape indices, were analyzed in FRAGSTATS v4.2.1 (Tables 2 and 3). Mean patch area equals the average area (ha) of patches by the number of patches of the corresponding patch types (McGarigal, 2015). Largest patch index equals the area (m2) of the largest patch of the corresponding patch type divided by total landscape area (m2), multiplied by 100 (McGarigal, 2015). Patch density per 100 hectares (ha) equals the number of patches of the corresponding patch type divided by total landscape area (m2), multiplied by 10,000 and 100 (McGarigal, 2015). Mean patch area, largest patch index, and patch density comprehensively represent and help to compare quantitative differences among different land covers and protection categories.
Table 2. Land Cover Area in 1995, 2005, and 2015 and the percentage area changes of land cover occupied by each land protection category between 1995-2015.
|
Land covers |
Area in 1995 (ha) |
Area in 2005 (ha) |
|
|||||||
|
National park |
Wildlife sanctuary |
Non-protected |
Total |
National park |
Wildlife sanctuary |
Non-protected |
Total |
|||
|
Forest |
565,700 |
212,300 |
779,100 |
1,557,100 |
557,600 |
212,200 |
760,700 |
1,530,500 |
||
|
Agriculture |
103,800 |
32,200 |
512,200 |
648,200 |
112,400 |
32,500 |
530,800 |
675,700 |
||
|
Urban |
0 |
0 |
2,700 |
2,700 |
0 |
0 |
3,300 |
3,300 |
||
|
Water body |
3,500 |
0 |
5,200 |
8,700 |
3,100 |
0 |
4,100 |
7,200 |
||
|
Land covers |
Area in 2015 (ha) |
Gain and loss area between 1995-2015 (%) |
|
|||||||
|
National park |
Wildlife sanctuary |
Non-protected |
Total |
National park |
Wildlife sanctuary |
Non-protected |
Total |
|||
|
Forest |
557,500 |
211,400 |
761,600 |
1,530,500 |
-1.45 |
-0.42 |
-2.25 |
-1.71 |
||
|
Agriculture |
112,500 |
32,200 |
525,900 |
670,600 |
+8.38 |
0 |
+2.67 |
+3.46 |
||
|
Urban |
0 |
0 |
7,700 |
7,700 |
0 |
0 |
+185.19 |
+185.19 |
||
|
Water body |
3,400 |
0 |
4,500 |
7,900 |
-2.86 |
0 |
-13.46 |
-9.20 |
||
We defined land cover transformation categories, classifying changes from other types to forest as positive change, and other types to either urban or agriculture as negative change (LDN Methodological Note, 2017). In different protected areas and non-protected areas, we determined the area change in land cover types in different decades (1995-2005, 2005-2015, and 1995-2015) to demonstrate the effectiveness of the land protection category (Table 4). In addition, we created maps illustrating the detected changes, distinguishing between positive and negative changes, overlaid with national parks, wildlife sanctuaries, and non-protected areas in Chiang Mai province (Figure 2). This analysis was done using ArcMap software.
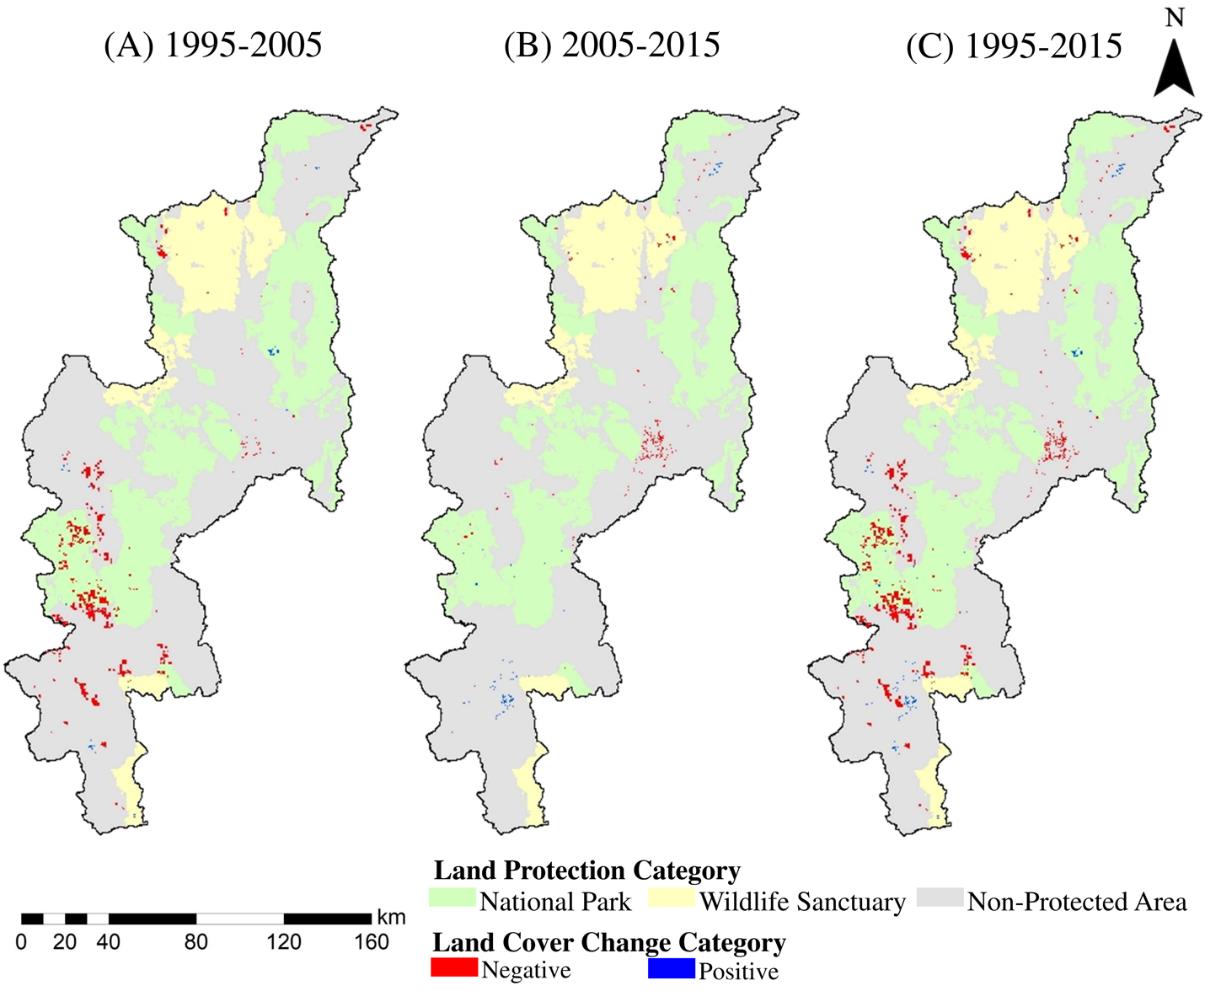
Figure 2. The distribution of protected areas and non-protected areas depicting changes detected with positive change (blue) and negative change (red).
RESULTS
The study area contained 17 national parks (30.37%) and five wildlife sanctuaries (11.02%). The non-protected areas were 58.61% of Chiang Mai’s total area (ca. 2,216,700 ha).
From 1995 to 2015, forest cover in Chiang Mai province decreased by 1.71% (Table 2). Besides, the largest patch index, and mean patch area of forests in the protected areas were higher than forests in the non-protected areas within two decades while forest patch densities in the non-protected areas were about three times higher than in forests in the protected areas (Table 3).
Table 3. Patch level indices explained spatial patterns of land cover in different land protection categories. The unit of mean patch area is ha, the unit of largest patch index is percent, and the unit of patch density is the number of patches per 100 ha (McGarigal, 2015).
|
Land covers
|
Patch indices |
Non-protected areas |
Protected areas |
|||||||
|
National park |
Wildlife sanctuary |
|||||||||
|
1995 |
2005 |
2015 |
1995 |
2005 |
2015 |
1995 |
2005 |
2015 |
||
|
Forest |
Mean Patch Area |
0.09 |
0.09 |
0.09 |
0.53 |
0.40 |
0.40 |
0.39 |
0.41 |
0.40 |
|
Largest patch index |
20.88 |
19.92 |
20.01 |
28.10 |
26.94 |
26.95 |
48.40 |
48.39 |
48.30 |
|
|
Patch density |
0.06 |
0.06 |
0.06 |
0.01 |
0.02 |
0.02 |
0.02 |
0.02 |
0.02 |
|
|
Agriculture |
Mean Patch Area |
0.05 |
0.06 |
0.06 |
0.01 |
0.01 |
0.01 |
0.01 |
0.01 |
0.01 |
|
Largest patch index |
17.75 |
17.83 |
17.56 |
3.57 |
5.05 |
3.86 |
3.10 |
3.10 |
3.69 |
|
|
Patch density |
0.06 |
0.06 |
0.06 |
0.10 |
0.09 |
0.09 |
0.09 |
0.09 |
0.09 |
|
|
Urban |
Mean Patch Area |
0.00 |
0.00 |
0.00 |
- |
- |
- |
- |
- |
- |
|
Largest patch index |
0.25 |
0.11 |
0.34 |
- |
- |
- |
- |
- |
- |
|
|
Patch density |
0.00 |
0.00 |
0.00 |
- |
- |
- |
- |
- |
- |
|
|
Water body |
Mean Patch Area |
0.01 |
0.01 |
0.01 |
0.02 |
0.02 |
0.02 |
0.00 |
0.00 |
0.00 |
|
Largest patch index |
0.17 |
0.22 |
0.11 |
0.28 |
0.21 |
0.21 |
0.01 |
0.01 |
0.01 |
|
|
Patch density |
0.00 |
0.00 |
0.00 |
0.00 |
0.00 |
0.00 |
0.00 |
0.00 |
0.00 |
|
In the non-protected areas, we found that over the two decades (1995-2015), 0.02% of the forest cover was lost by transformation into urban areas (Table 4). We found the change from forest to agriculture in both the protected and non-protected areas (Table 4), with the highest percentage (2.55%) in the non-protected areas. Between 1995-2015, in the national parks, we found highly positive land cover change from agricultural and water body areas to forest cover (Table 4).
In Table 2, the reduction of water body area over the two decades was 9.20%. The largest patch index and mean patch area of the water body were higher in national parks compared to other protection categories, and the patch densities of the water body in the non-protected areas were higher than in the protected areas (Table 3). Between 1995 and 2015, in the non-protected areas, 20.08% of the water body area was changed to agricultural areas, and in national parks, 11.06% of the water body area was converted to agriculture (Table 4). The water body type transformed to agriculture and forest only during the first decade (Table 4).
Table 4. Area transformations analyzed from land cover change detection in different years and land protection categories. Abbreviations represent the land cover types: F = forest, A = agriculture, U = urban, and W = water body. (+) and (-) represent positive and negative categories of land cover change, respectively.
|
Land cover transformation |
Changed area in national parks |
Changed area in wildlife sanctuaries |
Changed area in non-protected areas |
|||||||||||||
|
1995-2005 (ha) |
2005-2015 (ha) |
1995-2015 (ha) |
1995-2015 (%) |
1995-2005 (ha) |
2005-2015 (ha) |
1995-2015 (ha) |
1995-2015 (%) |
1995-2005 (ha) |
2005-2015 (ha) |
1995-2015 (ha) |
1995-2015 (%) |
|
||||
|
A to F (+) |
576 |
405 |
981 |
0.95 |
171 |
36 |
207 |
0.64 |
711 |
1,746 |
2,457 |
0.48 |
|
|||
|
W to F (+) |
45 |
- |
45 |
1.29 |
- |
- |
- |
- |
9 |
- |
9 |
0.17 |
|
|||
|
A to U (-) |
- |
- |
- |
- |
- |
- |
- |
- |
936 |
3,897 |
4,833 |
0.94 |
|
|||
|
F to A (-) |
8,775 |
495 |
9,270 |
1.64 |
378 |
765 |
1,143 |
0.54 |
19,125 |
720 |
19,845 |
2.55 |
|
|||
|
F to U (-) |
- |
- |
- |
- |
- |
- |
- |
- |
- |
126 |
126 |
0.02 |
|
|||
|
W to A (-) |
387 |
- |
387 |
11.06 |
- |
- |
- |
- |
1,044 |
- |
1,044 |
20.08 |
|
|||
Between 1995 and 2015, urban and agricultural areas increased about 185.19% and 3.46%, respectively (Table 2). The urban areas increased only in the non-protected areas and the sharpest increase was found between 2005 and 2015 (Table 2). The urban area was converted from the forest (0.02%) and agricultural (0.94%) areas (Table 4). For agriculture in the non-protected areas, between 1995 and 2015, the agricultural area increased at the expense of forest (2.55%) and water bodies (20.08%) (Table 4). The largest patch index and mean patch area for agricultural areas in the non-protected areas were higher than in the protected areas (Table 3). Agricultural areas had higher patch density in protected areas compared to non-protected areas (Table 3).
DISCUSSION
GIS and spatial analysis are of great interests, so this study used GIS tools to determine the effectiveness of forest protected areas and the land cover transformation patterns in comparison to non-protected areas. The study provided evidence that the designation of protected areas in Chiang Mai province for 20 years (between 1995 and 2015) was generally effective in forest conservation.
In the 22 national park and wildlife sanctuary sites, low percentages of deforestation were found (Table 2). In particular, urban expansion was detected in neither national parks nor wildlife sanctuaries, and the protected areas performed their functions, as indicated by the low percentage of transformation of forest cover to agriculture (Table 4). The largest patch index and the mean patch area of forest land were higher in protected areas than in the non-protected areas, meaning that designating protected areas kept large patches of forests (Table 3). Also, low forest patch density, which indicates fewer small fragmented or subdivided forest patches, can guarantee the effectiveness of forest protected areas compared to the non-protected areas (Table 3). On the other hand, illegal deforestation in Chiang Mai has become a major consideration in forest conservation. In recent years, forest restoration projects have operated in this region, both inside and outside the protected areas (Elliott et al., 2018). There have been tiny gains in area of forest cover after reforestation, but these may not compensate for the forest loss between 1995-2015 in the landscape. Moreover, forest degradation, which affected the forest area changes and contributed to reduced biodiversity, was partly from economic development (Elliott et al., 2019).
Recently, as a result of economic development, many of the forest areas in northern Thailand have been largely converted to agricultural lands (Charnsungnern and Tantanasarit, 2017; Kongsawi et al., 2020). Between 1995-2015, the total area under agriculture in Chiang Mai increased more in national parks than in non-protected areas (Table 2). Moreover, forests in all land protection categories were changed to agriculture (Table 4). Our results showed high densities of agricultural patches in protected areas; however, the mean patch area and the largest patch index of agriculture were higher in non-protected areas than in protected areas (Table 3). It thus seems that the previously forest-protected areas can still be effective for preventing expansion of the agricultural area.
Urban expansion, on the other hand, occurred in the non-protected areas as agricultural and forest areas were transformed into urban areas (Table 4). The largest patch index and patch density of urban area increased, but the mean patch area decreased (Table 3). The results can be interpreted as in Figure 1, which showed small sizes of urbanized patches that occurred greatly in Chiang Mai province, and Chiang Mai city center was expanded at the same time. Water body, another natural resource, was reduced by change into agricultural areas in both the national parks and the non-protected areas (Table 4). In particular, the sizes of water bodies were decreased, but the density was increased over the two decades (Table 3). At this point, it seems to be resulted from water consumption for agricultural purposes in the landscape.
This study presents evidence for forest cover changes by anthropogenic disturbances in Chiang Mai, e.g., agriculture and urban expansion. While the forest areas are decreasing, we consider policy developments and human activities to save wildlife and natural habitats in the landscape. Thus, for policy decisions, policymakers can address the disturbance issues to cope with the expansion of agricultural areas both in the non-protected areas and the protected areas. Another primary concern is that it is possible to develop additional infrastructure even in mountainous areas after the forests have been cleared as villagers can easily develop other land use types for tourism (Kaewnuch, 2017; Elliott et al., 2019). Under this circumstance, there would be negative impacts on natural resources used by the communities (Kaewnuch, 2017; Suwanna et al., 2017). We found that while the protected areas at least blocked urbanization in forest areas, forest transformation continued at a big scale as forest land was cleared for agricultural purposes. Especially, areas in southwestern Chiang Mai province showed more sites of negative land cover change (Figures 2A and 2C) that partly represented the conversion of natural and semi-natural ecosystems to agriculture. In this way, modeling of future forest areas under some land-use scenarios can highlight ongoing future deforestation and biodiversity loss (Trisurat et al., 2010; Poortinga et al., 2020). Therefore, proper social data integration and local management will be useful to highlight ongoing population growth and residential demands.
Using various applications for integrated-land use planning, this study identified land cover change by analyzing yearly comparable GIS data. We propose that GIS data and spatial analysis can improve the methods for assessing effectiveness of designating protected areas followed by forestry policies from DNP, and land use planning from other relevant government agencies in Thailand such as the Department of Land Development. Thailand took national target to increase natural forest coverage to 35% by 2037 (Thailand Environment Institute, 2019). Internationally, expanding coverage of protected area to 30% of global land and sea area by 2030 is going to be agreed at the Fifteenth meeting of Conference of the Parties to the Convention on Biological Diversity (CBD, 2021). To support future plan for extending forest protected area coverage, we also recommend testing other spatial factors and accuracy that can be integrated with remote sensing methods such as distances to urban areas, road paths, and terrain types (Sim, 2010; Cui et al., 2018).
CONCLUSION
This study highlights the recent effectiveness of protected areas for preventing forest cover change in Chiang Mai province, Thailand. The designated forest-protected areas had the potentials to sustain forest areas against urban expansion even though forests were converted to agricultural lands. Along with these upcoming quantitative targets towards expanding protected areas coverage, we recommend that there should be additional strict regulations to conserve forests before more forest remnants become converted to agricultural areas.
ACKNOWLEDGEMENTS
This study was supported by the Thailand Science Research and Innovation (TSRI, formerly the Thailand Research Fund, TRF) (Grant number RDG6230005). This research was also partially funded by Chiang Mai University. Kyuho Lee was supported by Master’s Degree Program in Environmental Science, Faculty of Science, Chiang Mai University, under the CMU Presidential Scholarship.
AUTHOR CONTRIBUTIONS
The study was designed by all authors. The article was written by all authors. All authors have read and approved the final manuscript.
CONFLICT OF INTEREST
The authors declare that they hold no competing interests.
REFERENCES
Abad-Segura, E., González-Zamar, M.-D., Vázquez-Cano, E., and López-Meneses, E. 2020. Remote sensing applied in forest management to optimize ecosystem services: advances in research. Forests. 11.
CBD (Convention on Biological Diversity). 2021. First Draft of the Post-2020 Global Biodiversity Framework. Available from https://www.cbd.int/article/draft-1-global-biodiversity-framework#:~:text=The post-2020 global biodiversity framework builds on the Strategic,in harmony with nature’ is
Chaikaew, N., Tripathi, N. K., and Souris, M. 2009. Exploring spatial patterns and hotspots of diarrhea in Chiang Mai, Thailand. International Journal of Health Geographics. 8.
Charnsungnern, M., and Tantanasarit, S. 2017. Environmental sustainability of highland agricultural land use patterns for Mae Raem and Mae Sa watersheds, Chiang Mai province. Kasetsart Journal of Social Sciences. 38: 169–174.
Cui, G., Lv, Z., Li, G., Benediktsson, J.A., and Lu, Y. 2018. Refining land cover classification maps based on dual-adaptive majority voting strategy for very high resolution remote sensing images. Remote Sensing. 10: 1–19.
DNP (The Department of National Parks, Wildlife and Plant Conservation). 2017. Database of nature reserves in Thailand; National Parks Office, Department of National Parks, Wildlife and Plant Conservation: Bangkok, Thailand.
Elliott, S., Chairuangsri, S., Kuaraksa, C., Sangkum, S., Sinhaseni, K., Shannon, D., … , and Manohan, B. 2019. Collaboration and conflict-developing forest restoration techniques for northern Thailand’s upper watersheds whilst meeting the needs of science and communities. Forests. 10: 732.
Elliott, S., Chairuangsri, S., Shannon, D., Nippanon, P., and Amphon, R. 2018. Where science meets communities: developing forest restoration approaches for northern Thailand. Natural History Bulletin of the Siam Society. 63: 11–26.
ESA (European Space Agency). 2017. Land cover CCI product user guide version 2. Available from http://maps.elie.ucl.ac.be/CCI/viewer/download/ESACCI-LC-Ph2-PUGv2_2.0.pdf
HDX (Humanitarian data exchange). 2019. Thailand - subnational administrative boundaries, the Royal Thai Survey Department. Available from https://data.humdata.org/dataset/thailand-administrative-boundaries
Kaewnuch, K. 2017. Tourist’s perspectives on environmental impacts in Doi Inthanon national park. Dusit Thani College Journal. 11.
Khokthong, W. 2019. Drone-based assessments of crowns, canopy cover and land use types in and around an oil palm agroforestry experiment. Ph.D. Dissertation. Georg-August-Universität Göttingen, Göttingen, Germany.
Kongsawi, V., Arunpraparut, W., and Rianthakool, L. 2020. Application of geo-informatics in predicting forest land use at the Doi Inthanon national park, Chiang Mai province. Thai Journal of Forestry. 39: 77–90.
LDN Methodological Note. 2017. Methodological note to set national voluntary land degradation neutrality (LDN) targets using the UNCCD indicator framework. Available from https://knowledge.unccd.int/publication/ldn-methodological-note
McGarigal, K. 2015. Fragstats: spatial pattern analysis program for categorical and continuous maps. University of Massachusetts, Amherst.
Nasa, M., Emphandhu, D., Pattanakiat, S., and Kitisin, S. 2008. Database system development of nature-based tourism in protected areas, Chiang Mai province. Proceedings of the FORTROP II: Tropical Forestry Change in a Changing World, 17–20 November 2008. Kasetsart University, Bangkok, Thailand.
Poortinga, A., Aekakkararungroj, A., Kityuttachai, K., Nguyen, Q., Bhandari, B., Soe Thwal, N., … , and Saah, D. 2020. Predictive analytics for identifying land cover change hotspots in the Mekong region. Remote Sensing. 12: 1472.
Ruthamnong, S. 2017. Spatial distribution of burned area and MODIS hotspot in Chiang Mai province, Thailand. Proceedings of International Conference on Mechanical, Electrical and Medical Intelligent System 2017.
Sharp, A., and Nakagoshi, N. 1997. National parks and protected areas in Thailand. Journal of International Development and Cooperation. 3: 53–67.
Sims, K.R.E. 2010. Conservation and development: evidence from Thai protected areas. Journal of Environmental Economics and Management. 60: 94–114.
Singh, M., Griaud, C., and Collins, C.M. 2021. An evaluation of the effectiveness of protected areas in Thailand. Ecological Indicators. 125.
Suksawang, S. 2018. Protected area complexes: a new approach to connectivity in Thailand. Thai Forest Bulletin (Botany). 46: 25–33.
Suwanna, A., Inta, K., Pisitsenakul, S., and Passadee, L. 2017. Participatory research in preparing sustainable tourism strategy plan in head watershed of Chiang Mai, Thailand. Proceedings of 13th International Conference on Humanities & Social Sciences 2017, Khon Kaen University, Thailand.
Techachoochert, S., Gale, G. A., Khudamrongsawat, J., and Round, P. D. 2018. Habitat association and conservation status of the endangered giant nuthatch (Sitta magna) in Thailand. Tropical Conservation Science. 11: 1-10.
Thailand Environment Institute. 2019. Thailand’s Sixth National Report on the Implementation of the Convention on Biological Diversity. Available from https://www.cbd.int/doc/nr/nr-06/th-nr-06-en.pdf
Trisurat, Y. 2007. Applying gap analysis and a comparison index to evaluate protected areas in Thailand. Environmental Management. 39: 235–245.
Trisurat, Y., Alkemade, R., and Verburg, P.H. 2010. Projecting land-use change and its consequences for biodiversity in northern Thailand. Environmental Management. 45: 626–639.
UNEP-WCMC and IUCN. 2021. Protected planet: the world database on protected areas (WDPA), Cambridge, UK. Available from http://protectedplanet.net.
OPEN access freely available online
Chiang Mai University Journal of Natural Sciences [ISSN 16851994]
Chiang Mai University, Thailand
https://cmuj.cmu.ac.th
Kyuho Lee1, Prasit Wangpakapattanawong2, 3, and Watit Khokthong2, 3,*
1 Master of Science Program in Environmental Science, Faculty of Science, Chiang Mai University, Chiang Mai 50200, Thailand
2 Environmental Science Research Center, Faculty of Science, Chiang Mai University, Chiang Mai 50200, Thailand
3 Biology Department, Faculty of Science, Chiang Mai University, Chiang Mai 50200, Thailand
Corresponding author: Watit Khokthong, E-mail: watit.khokthong@cmu.ac.th
Total Article Views
Editor: Korakot Nganvongpanit,
Chiang Mai University, Thailand
Article history:
Received: July 9, 2021;
Revised: February 4, 2022;
Accepted: February 8, 2022;
Published online: February 10, 2022