 ISSN: 2822-0838 Online

High Fat Diet and Ethanol-Induced Fatty Liver Disease Mouse Model
Nadta Sukkasem, Waranya Chatuphonprasert, and Kanokwan Jarukamjorn*Published Date : 2022-01-21
DOI : https://doi.org/10.12982/CMUJNS.2022.002
Journal Issues : Number 1, January-March 2022
Abstract A diet high in fat and/or alcohol is a major cause of fatty liver disease (FLD), which is a common precursor to chronic liver disease. As the pathogenetic mechanisms of FLD remain unclear, an appropriate animal model is critical to problem solving in this field. This study aimed to develop an FLD mouse model using a diet high in fat and/or ethanol. Five-week-old female ICR mice were given free access to a high fat diet (HFD, 60 kcal % fat of total food), or daily intragastrically administered ethanol (E, 0.5 g/kg/day), or a combination of HFD and ethanol (HFD+E). Hepatic histology was observed with oil red O (ORO) staining. Hepatic triglyceride (TG) levels, antioxidant enzyme activities, and mRNA expression levels of metabolic, antioxidant, and inflammatory genes, i.e. peroxisome proliferator activated receptor-alpha and gamma (Ppar-α and Ppar-γ), sterol regulatory element binding protein-1 (Srebp-1), acetyl-CoA carboxylase (Acc), fatty acid synthase (Fas), fat cluster of differentiation (Cd-36), catalase (Cat), superoxide dismutase 1 and 2 (Sod1 and Sod2), glutathione peroxidase (Gpx), nuclear factor-kappa b (Nf-ĸb), tumor necrosis factor-alpha (Tnf-α), and monocyte chemoattractant protein-1 (Mcp-1) were determined. HFD+E induced FLD in mice by increasing hepatic TG levels and expression of Acc and Fas metabolic genes and Cd-36 and Mcp-1 inflammatory genes, while simultaneously reducing the activity and expression of antioxidant enzymes. These findings confirm that HFD+E is a potent regimen for FLD induction in mice.
Keywords: High fat diet, Alcohol, Non-invasive, Antioxidation, Metabolic gene, Inflammatory gene
Citation: Sukkasem, N., Chatuphonprasert,W., and Kanokwan Jarukamjorn, K. 2022. High fat diet and ethanol-induced fatty liver disease mouse model. CMU J. Nat. Sci. 21(1): e2022002.
INTRODUCTION
Excessive consumption of a high fat diet (HFD) and/or alcohol is one major cause of chronic liver disease, especially fatty liver disease (FLD) (Farrell and Larter, 2006; Liu et al., 2014). FLD is a pathological condition in which fat accumulates in hepatocytes and is defined by accumulation of triglyceride (TG) at concentrations exceeding 5.5% or 55 mg/g liver. FLD is the first step in a spectrum of liver diseases that ranges from simple hepatic steatosis to steatosis with inflammation (steatohepatitis) and necrosis, to fibrosis, cirrhosis, and hepatocellular carcinoma (Basaranoglu et al., 2015; Browning and Horton, 2004). Nowadays, FLD is recognized as a major chronic liver disease worldwide (Wong et al., 2013). Around 30% of the population of Western countries suffer from FLD, while the prevalence in Asia has been reported to be between 15 and 30% (Bellentani et al., 2010; Wong et al., 2013). However, the pathogenetic mechanisms of FLD remain unclear (Van De Wier et al., 2017). Hepatic steatosis can be diagnosed by elevated blood ALT and AST enzyme levels and by liver imaging techniques such as magnetic resonance imaging (MRI) and computerized tomography (CT) (Paschos and Paletas, 2009). Nonetheless, Nalbantoglu and Brunt (2014) suggest that detection of specific pathological lesions by liver biopsy is the gold standard as it can identify both the range and state of the disease (Nalbantoglu and Brunt, 2014). Selection of an appropriate FLD animal model is critical to problem solving for effective therapy. Numerous animal models have been employed for studying FLD using either a HFD or a fatty acid supplemented diet with ad libitum alcohol. However, there can be high costs of maintenance and a requirement for invasive interventions that can limit the utility of some of these models. This study establishes a new non-invasive FLD model in mice that uses indicative markers of metabolic and antioxidant imbalance, and inflammatory induction as drivers of FLD. This model could serve as a well-controlled tool for preclinical testing of novel FLD therapies.
MATERIALS AND METHODS
Materials
HFD (60 kcal% fat of total food; cas no. D12492) was a product of Research Diets (New Brunswick, USA). Commercial rodent diet was a product of SmartHeart® (Perfect Companion Pet Care Company, Bangkok, Thailand). Oil red O (ORO), catalase (CAT) superoxide dismutase (SOD), glutathione (GSH) reductase, xanthine oxidase, nicotinamide adenine dinucleotide phosphate (NADPH), and 4-vinylpyridine (4-VP) were purchased from Sigma-Aldrich (Missouri, USA). ReverTra Ace® was a product of Toyobo Co., Ltd. (Osaka, Japan). Taq DNA polymerase was purchased from Vivantis® (Selangor, Malaysia). All other laboratory chemicals were of the highest purity from commercial suppliers.
Experimental design and treatments
Five-week-old female intelligent character recognition (ICR) mice were supplied by the Northeast Laboratory Animal Center (Khon Kaen University, Khon Kaen, Thailand) and housed in the Animal Unit of Faculty of Pharmaceutical Sciences, Khon Kaen University under controlled conditions at temperature of 23 ± 2ºC and humidity of 45 ± 2%. The Institutional Animal Care and Use Committee of Khon Kaen University approved the protocol for handling and treatment of animal (Approval No. IACUC-KKU-12/63). At all times, the mice were housed on corncob bedding stainless steel cages with ad libitum access to water and food. The mice were randomly divided (n=5 for each group) into 4 groups, namely (1) 0.5% carboxymethylcellulose 0.1 mL/mouse (control), (2) HFD, (3) ethanol 0.5 g/kg/day (E), and (4) HFD and ethanol 0.5 g/kg/day (HFD+E), and all groups were treated for 60 consecutive days. One day after the last treatment, the mice were sacrificed and organs were immediately collected for further analysis.
Determination of intracellular fat content using Oil Red O staining
Intracellular fat content assay was performed as previously described (Sukkasem, et al., 2020). A microscopic slide with embedded liver tissue was stained with ORO and evaluated for the pattern of hepatic histomorphology at 20x magnification using a Motic AE2000 inverted microscope (Motic Asia, Kowloon, Hong Kong). The image was analyzed and displayed on screen using the Motic image plus 3.0 software.
Determination of triglyceride (TG) accumulation
TG content was quantified using a commercially available TG assay kit (Cayman, Miami, USA). The spectrofluorometric intensity of supernatant was measured with excitation and emission wavelengths of 535 and 590 nm, respectively. The TG content was calculated compared to the standard TG (Al-Anzi and Zinn, 2010).
Assessment of superoxide dismutase (SOD) activity
SOD activity was assessed as previously described (Sriset et al., 2020). A sample mixture containing liver homogenate, chloroform, and ethanol was centrifuged at 13,000 ×g at 4ºC for 30 min and incubated with a reaction mixture of xanthine, xanthine oxidase, and nitrobluetetrazolium (NBT) for 20 min. Copper chloride (CuCl2) was added to stop the reaction. The absorbance was measured at a wavelength of 550 nm. The SOD activity was calculated compared to the standard SOD.
Assessment of catalase (CAT) activity
CAT activity was assessed as previously described (Sriset et al., 2020). The liver homogenate was incubated with H2O2 before adding ammonium molybdate to stop the reaction. The absorbance was measured at a wavelength of 405 nm. The CAT activity was calculated compared to the standard CAT.
Determination of glutathione profile
Determination of total GSH content
Total GSH content was determined as previously described (Sriset et al., 2020). Briefly, the liver homogenate was deproteinized by 5-sulfosalicylic acid (SSA) before centrifugation. The supernatant was then mixed with GSH reductase and 5, 5-dithio-bis-(2-nitrobenzoic acid) (DTNB) before adding NADPH to start the reaction. The absorbance was measured at a wavelength of 405 nm every 60 s for 5 min. The slope of absorbance per min was plotted and compared to the standard GSH to calculate the total GSH content.
Determination of the ratio of reduced to oxidized GSH
The oxidized GSH (GSSG) content was determined using the same procedure for determination of total GSH content after treatment of the sample with 4-VP (Sriset et al., 2020). And then the reduced GSH content was calculated by subtracting the GSSG content from the total GSH content.
Determination of glutathione peroxidase (GPx) activity
The GPx activity was assessed as previously described (Sriset et al., 2020). The liver homogenate was incubated with sodium azide at 30ºC for 10 min before starting the reaction by adding the GSH substrate and H2O2. The reaction was stopped with SSA before centrifugation. The GPx activity was measured as micromole of GSSG produced per min.
Assessment of reverse transcription and quantitative real-time polymerase chain reaction (RT/qPCR)
Total RNA was extracted by the guanidine-thiocyanate-phenol-chloroform method and the concentration was measured using a NanoDrop 2000c UV-spectrophotometer (NanoDrop Technologies, Inc., Thermo Fisher Scientific, MA, USA). Total RNA was converted to cDNA using ReverTra Ace® (Toyobo Co., Ltd., Osaka, Japan) at 25ºC for 10 min, 42ºC for 60 min, and 95ºC for 5 min. mRNA expression of metabolic, antioxidant, and inflammatory genes, i.e., peroxisome proliferator activated receptor-alpha and gamma (Ppar-α and Ppar-γ), sterol regulatory element binding protein-1 (Srebp-1), acetyl-CoA carboxylase (Acc), fatty acid synthase (Fas), fat cluster of differentiation (Cd-36), catalase (Cat), superoxide dismutase 1 and 2 (Sod1 and Sod2), glutathione peroxidase (Gpx), nuclear factor-kappa b (Nf-κb), tumor necrosis factor-alpha (Tnf-α), monocyte chemoattractant protein-1 (Mcp-1), and a reference gene, glyceraldehyde 3-phosphate dehydrogenase (Gapdh), were analyzed by qPCR with specific primers (Table 1) (Bio Basic Inc, Toronto, Canada) and calculated as previously described. The mRNA level was normalized with Gapdh and expressed as the fold difference to control using delta-delta-Ct calculation (Chatuphonprasert et al., 2020).
Table 1. Forward and reverse primers for qPCR.
|
Genes |
Forward and reverse primers (5’ ® 3’) |
Annealing temperature (°C) |
References |
|
|
Ppar-α |
F |
TGC AAA CTT GGA CTT GAA CG |
55.2 |
Tobita et al., 2018 |
|
R |
TGA TGT CAC AGA ACG GCT TC |
|||
|
Ppar-γ |
F |
GCC CTT TGG TGA CTT TAT GGA |
53.1 |
Al-Ahad Sabbagha et al., 2011 |
|
R |
GCA GCA GGT TGT CTT GGA TG |
|||
|
Srebp-1 |
F |
GGA GCC ATG GAT TGC ACA TT |
60.0 |
Xiaoli et al., 2019 |
|
R |
GGC CCG GGA AGT CAC TGT |
|||
|
Acc |
F |
TAT CCC AAC TCT TCC CTG |
60.0 |
Wang et al., 2016 |
|
R |
CCT TCA CAT AGC CTT TCT T |
|||
|
Fas |
F |
TCC CAG GTC TTG CCG TGC |
60.0 |
Sawano et al., 2015 |
|
R |
GCG GAT GCC TAG GAT GTG TGC |
|||
|
Cd-36 |
F |
TGC ATT TGC CAA TGT CTA GC |
60.0 |
Magliano et al., 2013 |
|
R |
CCC TCC AGA ATC CAG ACA AC |
|||
|
Cat |
F |
GCA GAT ACC TGT GAA CTG TC |
60.0 |
Sriset et al., 2019 |
|
R |
GTA GAA TGT CCG CAC CTG AG |
|||
|
Sod1 |
F |
AAG GCC GTG TGC GTG CTG AA |
60.0 |
Sriset et al., 2019 |
|
R |
CAG GTC TCC AAC ATG CCT CT |
|||
|
Sod2 |
F |
GCA CAT TAA CGC GCA GAT CA |
60.0 |
Sriset et al., 2019 |
|
R |
AGC CTC CAG CAA CTC TCC TT |
|||
|
Gpx |
F |
CCT CAA GTA CGT CCG ACC TG |
60.0 |
Sriset et al., 2019 |
|
R |
CAA TGT CGT TGC GGC ACA CC |
|||
|
Nf- κb |
F |
GAA ATT CCT GAT CCA GAC AAA AAC |
60.0 |
Yamamoto et al., 2009 |
|
R |
ATC ACT TCA ATG GCC TCT GTG TAG |
|||
|
Tnf-α |
F |
GTG GGT GAG GAG CAC GTA GT |
68.0 |
Lampronti et al., 2013 |
|
R |
CCG ATG GGT TGT ACC TTG TC |
|||
|
Mcp-1 |
F |
CAG ATC TCT CTT CCT CCA CCA CAC TAT |
68.0 |
Lampronti et al., 2013 |
|
R |
CAG GAC GCA ACT GTG AAC AAC |
|||
|
Gapdh |
F |
TCC GCA AAG ACC TGT ACA CC |
61.1 |
Design by Primer Pair 1 program |
|
R |
GAG TAC TTG CGC TTG GGA GG |
|||
RESULTS
Effects of FLD induction on bodyweight profile, hepatic triglyceride level, and hepatic histomorphology in mice
Mice fed HFD and ethanol (HFD+E) showed a significant increase in bodyweight profile compared to control, while those fed only ethanol (E) or high fat diet (HFD) showed a similar upward trend to the control (Figure 1A). All of the E, HFD, and HFD+E treatment groups showed significantly increased TG levels compared to the control, while HFD+E showed a greater increase in TG level compared to the HFD and E groups (Figure 1B). The HFD- and HFD+E-induced FLD mice, livers were enlarged with visible visceral fat deposits and a yellowish coloration. Examination of the ORO-stained liver sections revealed slight TG accumulation in the mice fed E only, while HFD and HFD+E induced TG accumulation that was widely distributed throughout the hepatocytes (red dot staining, Figure 1C).
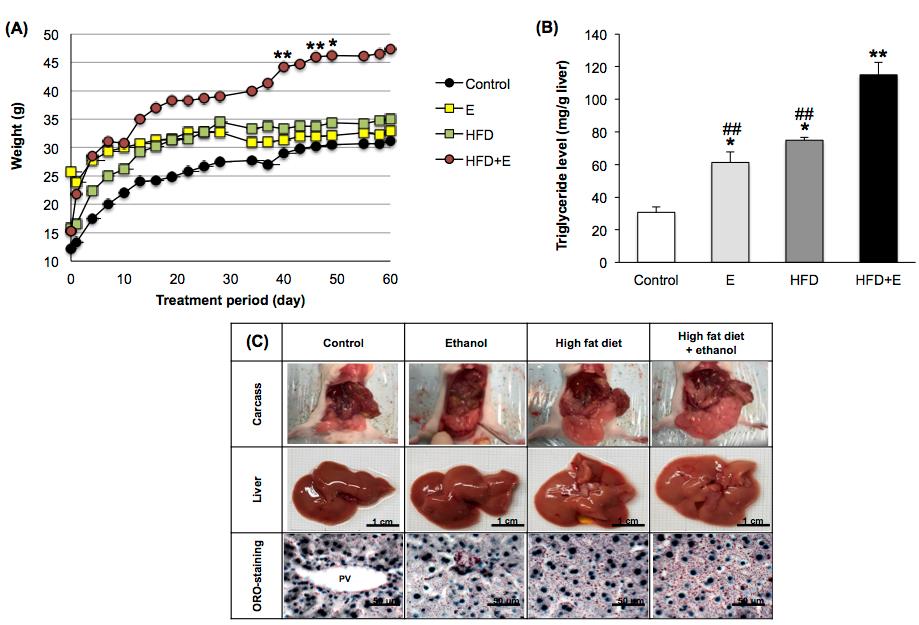
Figure 1. Effects of FLD induction on (A) bodyweight profile, (B) hepatic triglyceride level, and (C) morphological and histological features in mice. E, ethanol; HFD, high fat diet; HFD+E, high fat diet and ethanol. *P <0.05, ** P <0.001 VS Control; ##P < 0.001 VS HFD+E using one-way ANOVA with Tukey post hoc test.
Effects of FLD induction on the antioxidant system in mice
Antioxidant enzyme activities (CAT, SOD, and GPx) were significantly suppressed in E-, HFD-, and HFD+E-loaded mouse livers (Figures 2A-2C) and expression of each of the Cat, Sod1, Sod2, and Gpx genes was significantly decreased by all induction methods, compared to the control (Figure 2D). Total GSH and GSH contents were sharply reduced by E, HFD, and HFD+E, while GSSG was induced (Table 2). HFD+E lowered GSH content by significantly more than E and HFD.
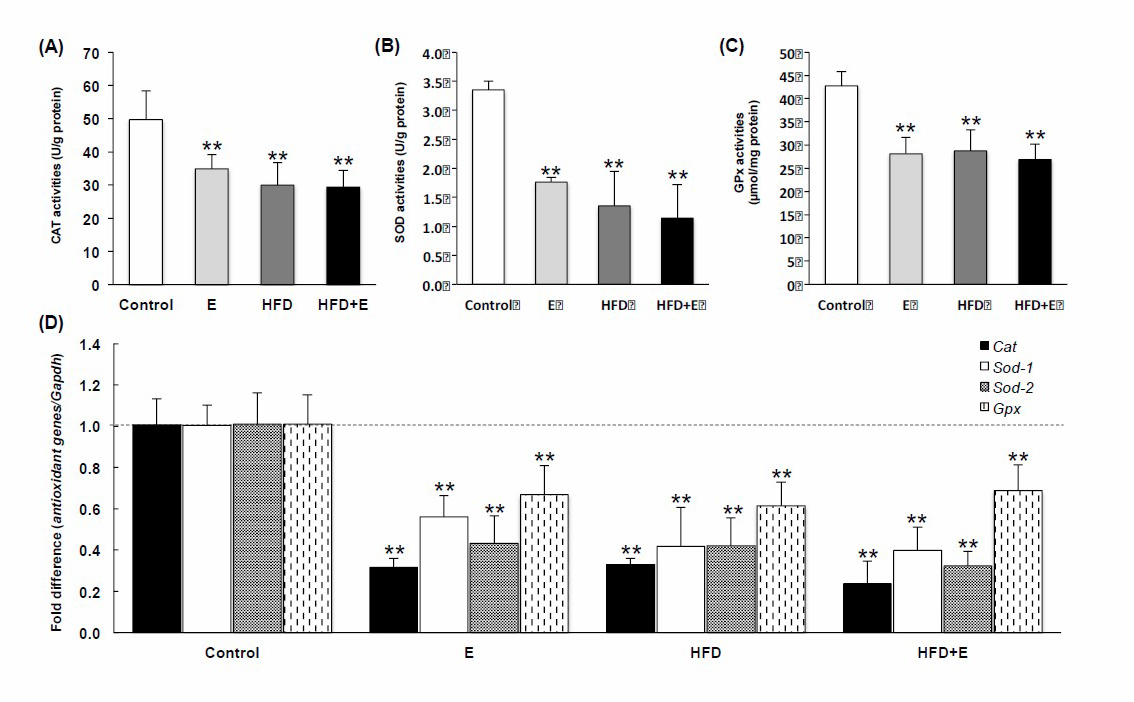
Figure 2. Effects of FLD induction on (A) CAT, (B) SOD, and (C) GPx activities, and (D) mRNA expression of antioxidant genes, Cat, Sod1, Sod2, and GPx, in mice. E, ethanol; HFD, high fat diet; HFD+E, high fat diet plus ethanol.
**P < 0.001 VS using one-way ANOVA with Tukey post hoc test.
Table 2. Effects of FLD induction on glutathione profiles in mouse livers.
|
|
Treatment |
Total GSH (nmole/mg protein) |
GSH (nmole/mg protein) |
GSSG (nmole/mg protein) |
||||||
|
Control |
133.91 |
± |
13.74 |
103.97 |
± |
13.01 |
29.05 |
± |
5.00 |
|
|
Ethanol |
104.71 |
± |
13.75* |
66.84 |
± |
5.15**## |
41.39 |
± |
9.79 |
|
|
High fat diet |
97.90 |
± |
20.66* |
66.83 |
± |
2.46**## |
43.39 |
± |
9.65 |
|
|
High fat diet and ethanol |
83.53 |
± |
23.82* |
52.77 |
± |
9.20** |
42.11 |
± |
11.22 |
|
Note: The data is expressed as mean ± SD (n = 5). Control, 0.5% carboxymethyl cellulose (vehicle); GSH, reduced glutathione; GSSG, oxidized glutathione. *P < 0.05, *P < 0.001 VS Control; ##P < 0.001 VS High fat diet and ethanol using one-way ANOVA followed by Tukey post hoc test
Effects of FLD induction on mRNA expression of metabolic genes in mice
FLD induction modified the expression of the studied metabolic genes in the mouse livers (Figure 3). Ppar-γ, Srebp-1, Acc, Fas, and Cd-36 were extensively upregulated in HFD+E-loaded mouse livers and Ppar-α was extensively down-regulated. Treatment with E elevated Acc and Cd-36 expression, while HFD alone increased Acc, Fas, and Cd-36 expression. HFD+E modified the expression of the Ppar-α, Ppar-γ, Srebp-1, and Cd-36 genes by more than E or HFD alone.
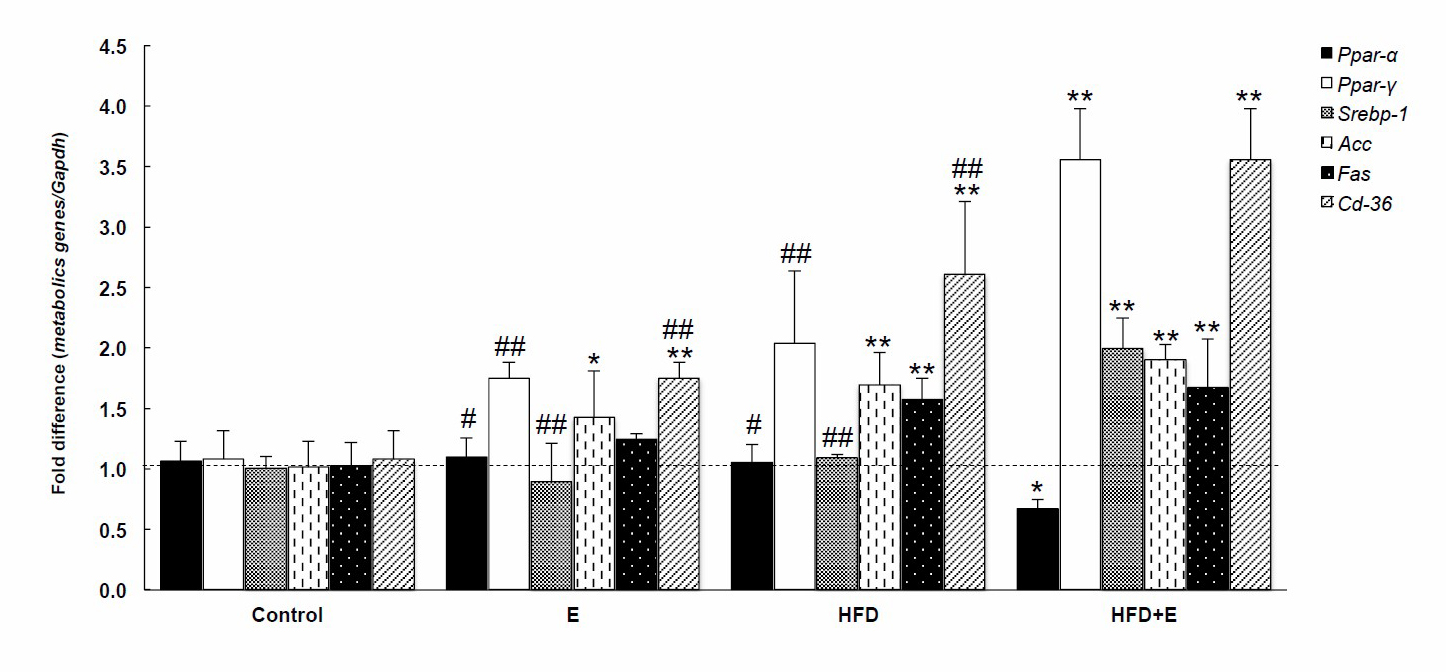
Figure 3. Effects of FLD induction on metabolic genes in mice. E, ethanol; HFD, high fat diet; HFD+E, high fat diet and ethanol. *P < 0.05, **P < 0.001 VS Control, #P < 0.05, ##P < 0.001 VS HFD+E using one-way ANOVA with Tukey post hoc test.
Effects of FLD induction on inflammatory genes in mice
FLD induction also modified the expression of the studied inflammatory genes in the mouse livers (Figure 4). HFD+E significantly up-regulated expression of Nf-κb, Tnf-α, and Mcp-1 compared to controls. Nf-κb expression was induced by HFD alone, while Mcp-1 expression was elevated by both E and HFD alone. HFD+E induced mRNA expression of the studied inflammatory genes by more than either E or HFD alone.

Figure 4. Effects of FLD induction on inflammatory genes in mice. E, ethanol; HFD, high fat diet; HFD+E, high fat diet and ethanol. **P <0.001 VS Control; ##P <0.001 VS HFD+E using one-way ANOVA with Tukey post hoc test.
DISCUSSION
Sex, diet, and period of induction are all considered key impact factors for FLD induction (Salvoza et al., 2020). A previous study demonstrated that FLD affects women more than men (Summart et al., 2017). Hence, female ICR mice were chosen as the model animal in this study. Administration of E, HFD, or HFD+E consecutively for 60 days induced FLD in female ICR mice in the current study. Several mouse or rat models employ ethanol, a high fat diet, or a combined ethanol and high fat diet to induce FLD (Coker et al., 2018; Licholai et al., 2018; Khazen et al., 2019). For example, the widely used Lieber–DeCarli liquid diet method is a chronic ethanol and HFD-induced alcoholic liver disease mouse model that represents chronic alcohol dependence (Dastidar et al., 2018). This study used three diets to induce FLD in mice: E, HFD containing 60% fat, and the combination of E+HFD. A normal high fat rodent diet ranges from 45 to 60% fat content. A 45% fat diet can induce obesity but a 60% fat diet hastens the development of FLD (Speakman, 2019). The commercial 60% HFD used in the current study consists of 60 g fat, 20 g carbohydrate, and 20 g protein per 100 g total food; whereas a regular diet consists of 4.5 g fat, 71.5 g carbohydrate, and 24 g protein per 100 g total food. The main ingredient of the commercial HFD is 31.6 g lard per 100 g total food, which is equivalent to 15 g palm oil or 7.9 g palmitic acid, two of the main causes of FLD in humans (Kanuri et al., 2016). The ethanol concentration of 0.5 g/kg/day employed in the current study represented chronic alcohol dependence and was equivalent to the average daily consumption of alcohol in alcohol dependent women, which ranges from 0.3 to 0.6 g/kg/day (Wackernah et al., 2014).
Among the treatment groups in the current study, HFD+E was shown to increase bodyweight, body mass, liver size, and induce histological and morphological changes to the liver by significantly more than the E and HFD alone groups, which correlates to a previous study (Coker et al., 2018). Hepatic TG levels were enhanced by E, HFD, and HFD+E, suggesting that excessive fat accumulation might cause critical liver injury due to overproduction of reactive oxygen species (ROS) (Cui et al., 2011). Over production of ROS causes oxidative stress which is associated with metabolic syndromes and TG and visceral fat accumulation (Madan et al., 2006). In the current model, E, HFD, and HFD+E all suppressed hepatic antioxidant enzyme activity and gene expression, except for GSSG. This imbalance in cellular redox status ultimately results in hepatic oxidative stress. Prolonged oxidative stress then results in inflammation and cellular injury (Reuter et al., 2010). Inflammatory cytokines are important in the development and stimulation of FLD progression (Braunersreuther, 2012). For example, Nf-κb, a master regulator of inflammation and cell death, plays an important role in the development of hepatocellular injury (Luedde and Schwabe, 2011). Treatment with either HFD or HFD+E extends JNK activation, which is induced by over production of ROS via Sod2 suppression. Prolonged JNK activation accelerates IκB kinase (IKK) activity and generates Nf-κb (González et al., 2011). Nf-κb is also known as up-stream activator of multiple chemokines and cytokines, including Mcp-1 and Tnf-α. Mcp-1 is a macrophage recruitment chemokine that is induced during adipose tissue inflammation (Cranford et al., 2016). Furthermore, various rodent models of FLD have demonstrated up regulation of Tnf-α in both liver and adipose tissues, which correlates with the current study (Hotamisligil et al., 1993). In addition, obese mice lacking Tnf-α show potential for progression of insulin sensitivity (Uysal et al., 1997). The criteria for diagnosis of steatohepatitis includes the presence of more than 5% macrovesicular steatosis, inflammation, and liver cell ballooning, typically with a centrilobular distribution (Dumitrascu and Neuman, 2018). We did not determine the macrovesicular steatosis level in the current study, so we did not infer that steatohepatitis was induced in the HFD+E group. Various studies have mentioned that increased body weight and BMI are associated with increased BAAT (the weighted sum of four variables: body mass index, age at liver biopsy, alanine aminotransferase level, and serum triglyceride level) and BARD (the weighted sum of three variables: body mass index, aspartate aminotransferase/alanine aminotransferase ratio, and diabetes) FLD assessment scores, and some studies have suggested that HFD+E does not affect body weight but causes visceral fat accumulation (Stelmach-Mardas et al., 2014). An incremental increase in inflammatory cytokine levels could affect metabolic mechanisms in terms of lipid metabolism and insulin sensitivity. Metabolic mechanisms include lipogenesis and glycogenesis, and both of these pathways are implicated in FLD. PPARα is involved in free fatty acid (FFA) storage and β-oxidation (Temelkova-Kurktschiev et al., 2004; Varga, Czimmerer, and Nagy, 2011). PPARα forms a heterodimer with the retinol X receptor (RXR) or the pregnane X receptor (PXR) and translocates to the nucleus to bind at the PPAR response element (PPRE) and oxidize FFA. This results in a reduction in the expression of Ppar-α (Varga, Czimmerer, and Nagy, 2011), which correlates with HFD+E down-regulating expression of Ppar-α in the current model. Inhibition of PPARα was reported as inflammatory agonist’s property through activation of Nf-κb (Zuo et al., 2015). Another mediator regulated through the PPRE is CD-36, which is as an FFA and cholesterol withdrawal mediator that plays an important role in the transfer FFA to the liver. Thus, an increase in CD-36 has been shown to lead to both the onset and progression of FLD (Shirpoor et al., 2018). HFD and heavy alcohol-fed mice or hepatic CD-36 knockout-animals both show reduced inflammation, insulin resistance, and FLD (Fabbrini et al., 2010). From the observations in the present study, it appears that all FLD induction groups attenuated the antioxidant system. HFD+E provoked FLD by more than either HFD or E alone by increasing induction of Ppar-γ, Srebp-1, Tnf-α, and Mcp-1. Thus, HFD+E facilitated lipogenesis through up-regulation of Srebp-1 and induction of Acc. In the cytosol, acetyl-CoA is transformed by ACC to malonyl-CoA and then to palmitate by FAS to form TG precursors (Nassir and Ibdah, 2015). Hence, the suppression of Ppar-α and the induction of Ppar-γ, Cd-36, Srebp-1, Acc, and Fas metabolic genes and Tnf-α and Mcp-1 inflammatory cytokines serve as crucial markers of FLD.
CONCLUSION
E and HFD slightly induced FLD by increasing hepatic TG levels and Acc, Fas, Cd-36, and Mcp-1 expression while simultaneously attenuating the antioxidant system. HFD+E-loaded mouse livers showed increased hepatic TG level with up-regulation of metabolic and inflammatory genes and attenuation of antioxidant features. These results confirm that HFD+E is a potentially useful regimen for a mouse model of FLD induction.
REFERENCES
Al-Ahad Sabbagha, N.G.A., Kao, H.J., Yang, C.F., Huang, C.C., Lin, W.D, Tsai, F.J., and Chen, Y.T. 2011. Alternative splicing in Acad8 resulting a mitochondrial defect and progressive hepatic steatosis in mice. Pediatric Research. 70: 31–36.
Al-Anzi, B., and Zinn, K. 2010. Colorimetric measurement of triglycerides cannot provide an accurate measure of stored fat content in drosophila. PLoS ONE. 5: e12353.
Basaranoglu, M., Basaranoglu, G., and Bugianesi, E. 2015. Carbohydrate intake and nonalcoholic fatty liver disease: fructose as a weapon of mass destruction. Hepatobiliary Surgery and Nutrition. 4: 109–116.
Bellentani, S., Scaglioni, F., Marino, M., and Bedogni, G. 2010. Epidemiology of non-alcoholic fatty liver disease. digestive diseases. 28: 155–161.
Braunersreuther, V. 2012. Role of cytokines and chemokines in non-alcoholic fatty liver disease. World Journal of Gastroenterology. 18: 727.
Browning, J.D. and Horton, J.D. 2004. Molecular mediators of hepatic steatosis and liver injury. Journal of Clinical Investigation. 114: 147–152.
Chatuphonpraser, W., Nawaratt, N., and Jarukamjorn, K. 2020. Reused palm oil from frying pork or potato induced expression of cytochrome P450s and the SLCO1B1 transporter in HepG2 cells. Journal of Food Biochemistry. 44: e13178.
Coker, C.R., Bingaman, S.S., Arnold, A.C., and Silberman, Y. 2018. Effects of chronic ethanol intake on high‐fat diet induced metabolic dysfunction in mice. FASEB Journal. 32: 15.5.
Cranford, T.L., Enos, R.T., Velázquez, K.T., McClellan, J.L., Davis, J.M., Singh, U.P., and Murphy, E.A. 2016. Role of MCP-1 on inflammatory processes and metabolic dysfunction following high-fat feedings in the FVB/N strain. International Journal of Obesity. 40: 844–851.
Cui, B., Liu, S., Lin, X., Wang, J., Li, S., Wang, Q., and Li, S. 2011. Effects of Lycium barbarum aqueous and ethanol extracts on high-fat-diet induced oxidative stress in rat liver tissue. Molecules. 16: 9116–9128.
Dastidar, S.G., Warner, J.B., Warner, D.R., McClain, C.J., and Kirpich, I.A. 2018. Rodent models of alcoholic liver disease: role of binge ethanol administration. Biomolecules. 8: e8010003.
Dumitrascu, D.L., and Neuman, M.G. 2018. Non-alcoholic fatty liver disease: an update on diagnosis. Clujul Medical. 91: 147–150.
Fabbrini, E., Sullivan, S., and Klein, S. 2010. Obesity and nonalcoholic fatty liver disease: biochemical, metabolic, and clinical implications. Hepatology. 51: 679–689.
Farrell, G.C., and Larter, C.Z. 2006. Nonalcoholic fatty liver disease: from steatosis to cirrhosis. Hepatology. 43: S99-S112.
González, R., Ballester, I., López-Posadas, R., Suárez, M.D., Zarzuelo, A., Martínez-Augustin, O., and Sánchez de Medina, F. 2011. Effects of flavonoids and other polyphenols on inflammation. Critical Reviews in Food Science and Nutrition. 51: 331–362.
Hotamisligil, G.S., Shargill, N.S., and Spiegelman, B.M. 1993. Adipose expression of tumor necrosis factor-α: direct role in obesity-linked insulin resistance. Science. 259: 87–91.
Kanuri, G., Landmann, M., Priebs, J., Spruss, A., Löscher, M., Ziegenhardt, D., Röhl, C., Degen, C., and Bergheim, I. 2016. Moderate alcohol consumption diminishes the development of non-alcoholic fatty liver disease (NAFLD) in ob/ob mice. European Journal of Nutrition. 55: 1153–1164.
Khazen, T., Hatoum, O.A., Ferreira, G., and Maroun, M. 2019. Acute exposure to a high-fat diet in juvenile male rats disrupts hippocampal-dependent memory and plasticity through glucocorticoids. Scientific Reports. 9: 1–10.
Lampronti, I., Borgatti, M., Vertuani, S., Manfredini, S., and Gambari, R. 2013. Modulation of the expression of the proinflammatory IL-8 gene in cystic fibrosis cells by extracts deriving from olive mill waste water. Evidence-Based Complementary and Alternative Medicine. 2013: 11.
Licholai, J.A., Nguyen, K.P., Fobbs, W.C., Schuster, C.J., Ali, M.A., and Kravitz, A.V. 2018. Why do mice overeat high-fat diets? how high-fat diet alters the regulation of daily caloric intake in mice. Obesity. 26: 1026–1033.
Liu, H., Lou, G., Li, C., Wang, X., Cederbaum, A.I., Gan, L., and Xie, B. 2014. HBx inhibits CYP2E1 gene expression via downregulating HNF4α in human hepatoma cells. PLoS ONE. 9: e107913.
Luedde, T., and Schwabe, R. F. 2011. NF-κB in the liver-linking injury, fibrosis and hepatocellular carcinoma. Nature Reviews Gastroenterology and Hepatology. 8: 108–118.
Madan, K., Bhardwaj, P., Thareja, S., Gupta, S.D., and Saraya, A. 2006. Oxidant stress and antioxidant status among patients with nonalcoholic fatty liver disease (NAFLD). Journal of Clinical Gastroenterology. 40: 930–935.
Magliano, D.C., Bargut, T.C.L., de Carvalho, S.N., Aguila, M.B., Mandarim-de-Lacerda, C.A., and Souza-Mello, V. 2013. Peroxisome proliferator-activated receptors-alpha and gamma are targets to treat offspring from maternal diet-induced obesity in mice. PLoS ONE. 8: e64258.
Nalbantoglu, I. and Brunt, E.M. 2014. Role of liver biopsy in nonalcoholic fatty liver disease. World Journal of Gastroenterology. 20: 9026–9037.
Nassir, F., and Ibdah, J.A. 2015. Role of mitochondria in nonalcoholic fatty liver disease. International Journal of Molecular Sciences. 15: 8713–8742.
Paschos, P. and Paletas, K. 2009. Non alcoholic fatty liver disease and metabolic syndrome. Hippokratia. 13: 9–19.
Reuter, S., Gupta, S.C., Chaturvedi, M.M., and Aggarwal, B.B. 2010. Oxidative stress, inflammation, and cancer: How are they linked?. Free Radical Biology and Medicine. 49: 1603–1616.
Salvoza, N.C., Giraudi, P.J., Tiribelli, C., and Rosso, N. 2020. Sex differences in non-alcoholic fatty liver disease: hints for future management of the disease. Exploration of Medicine. 1: 51–74.
Sawano, T., Shimizu, T., Yamada, T., Nanashima, N., Miura, T., Morohashi, S., and Tsuchida, S. 2015. Fatty acid synthase-positive hepatocytes and subsequent steatosis in rat livers by irinotecan. Oncology Reports. 33: 2151–2160.
Shirpoor, A., Heshmati, E., Kheradmand, F., Gharalari, F. H., Chodari, L., Naderi, R., and Samadi, M. 2018. Increased hepatic FAT/CD36, PTP1B and decreased HNF4A expression contributes to dyslipidemia associated with ethanol–induced liver dysfunction: Rescue effect of ginger extract. Biomedicine and Pharmacotherapy. 105: 144–150.
Speakman, J.R. 2019. Use of high-fat diets to study rodent obesity as a model of human obesity. International Journal of Obesity. 43: 1491-1492.
Sriset, Y., Chatuphonprasert, W., and Jarukamjorn, K. 2019. Optimized models of xenobiotic-induced oxidative stress in HepG2 cells. Tropical Journal of Pharmaceutical Research. 18: 1001–1007.
Sriset, Y., Nakorn, S.N., Chitsaitarn, S., Dechsri, K., Chatuphonprasert, W., and Jarukamjorn, K. 2020. Bergenin exhibits a nephroprotective effect by improvement of the antioxidant system in xenobiotic-induced oxidative stress in ICR mice. International Journal of Pharmaceutical and Phytopharmacological Research. 10: 13–21.
Stelmach-Mardas, M., Mardas, M., Warchoł, W., Jamka1, M., and Walkowiak, J. 2014. Successful maintenance of body weight reduction after individualized dietary counseling in obese subjects. Scientific Reports. 4: 6620.
Sukkasem, N., Chatuphonprasert, W., and Jarukamjorn, K. 2020. Cytochrome P450 expression-associated multiple-hit pathogenesis of non-alcoholic fatty liver disease (NAFLD) in HepG2 cells. Tropical Journal of Pharmaceutical Research. 19: 707–714.
Summart, U., Thinkhamrop, B., Chamadol, N., Khuntikeo, N., Songthamwat, M., and Kim, C.S. 2017. Gender differences in the prevalence of nonalcoholic fatty liver disease in the Northeast of Thailand: A population-based cross-sectional study. F1000Research. 6: 1630.
Temelkova-Kurktschiev, T., Hanefeld, M., Chinetti, G., Zawadzki, C., Haulon, S., Kubaszek, A., and Laakso, M. 2004. Ala12Ala genotype of the peroxisome proliferator-activated receptor γ2 protects against atherosclerosis. Journal of Clinical Endocrinology and Metabolism. 89: 4238–4242.
Tobita, H., Sato, S., Yazaki, T., Mishiro, T., Ishimura, N., Ishihara, S., and Kinoshita, Y. 2018. Alogliptin alleviates hepatic steatosis in a mouse model of nonalcoholic fatty liver disease by promoting CPT1a expression via Thr172 phosphorylation of AMPKá in the liver. Molecular Medicine Reports. 17: 6840–6846.
Uysal, K.T., Wiesbrock, S.M., Marino, M.W., and Hotamisligil, G.S. 1997. Protection from obesity-induced insulin resistance in mice lacking TNF- α function. Nature. 389: 610–614.
Van De Wier, B., Koek, G.H., Bast, A., and Haenen, G.R.M.M. 2017. The potential of flavonoids in the treatment of non-alcoholic fatty liver disease. Critical Reviews in Food Science and Nutrition. 57: 834–855.
Varga, T., Czimmerer, Z., and Nagy, L. 2011. PPARs are a unique set of fatty acid regulated transcription factors controlling both lipid metabolism and inflammation. Biochimica et Biophysica Acta - Molecular Basis of Disease. 1812: 1007–1022.
Wackernah, R.C., Minnick, M., and Clapp, P. 2014. Alcohol use disorder: pathophysiology, effects, and pharmacologic options for treatment. Substance Abuse and Rehabilitation. 5: 1-12.
Wang, Q., Afshin, A., Yakoob, M.Y., Singh, G.M., Rehm, C.D., Khatibzadeh, S., and Zajkás, G. 2016. Impact of nonoptimal intakes of saturated, polyunsaturated, and trans fat on global burdens of coronary heart disease. Journal of the American Heart Association. 5: e002891.
Wong, V.W.S., Chan, R.S.M., Wong, G.L.H., Cheung, B.H.K., Chu, W.C.W., Yeung, D. K.W., and Chan, H.L.Y. 2013. Community-based lifestyle modification programme for non-alcoholic fatty liver disease: a randomized controlled trial. Journal of Hepatology. 59: 536–542.
Xiaoli, A.M., Song, Z., and Yang, F. 2019. Lipogenic SREBP-1a/c transcription factors activate expression of the iron regulator hepcidin, revealing cross-talk between lipid and iron metabolisms. Journal of Biological Chemistry. 294: 12743–12753.
Yamamoto, A., Kagaya, Y., Toyoshima, R., Kagaya, M., Takeda, S., and Hattori, T. 2009. Arabidopsis NF-YB subunits LEC1 and LEC1-LIKE activate transcription by interacting with seed-specific ABRE-binding factors. Plant Journal. 58: 843–856.
Zuo, N., Zheng, X., Liu, H., and Ma, X. 2015. Fenofibrate, a PPARα agonist, protect proximal tubular cells from albumin-bound fatty acids induced apoptosis via the activation of NF-κB. International Journal of Clinical and Experimental Pathology. 8: 10653–10661.
OPEN access freely available online
Chiang Mai University Journal of Natural Sciences [ISSN 16851994]
Chiang Mai University, Thailand
https://cmuj.cmu.ac.th
Nadta Sukkasem1, 2, Waranya Chatuphonprasert1, 3, and Kanokwan Jarukamjorn1, 2, *
1 Research Group for Pharmaceutical Activities of Natural Products using Pharmaceutical Biotechnology (PANPB), Khon Kaen University, Khon Kaen 40002 Thailand
2 Faculty of Pharmaceutical Sciences, Khon Kaen University, Khon Kaen 40002 Thailand
3 Faculty of Medicine, Mahasarakham University, Maha Sarakham 44000 Thailand
Corresponding author: Kanokwan Jarukamjorn, E-mail: kanok_ja@kku.ac.th
Total Article Views
Editor: Korakot Nganvongpanit,
Chiang Mai University, Thailand
Article history:
Received: June 1, 2021;
Revised: September 6, 2021;
Accepted: September 8, 2021