 ISSN: 2822-0838 Online

Pasting Behavior and Viscoelastic Properties of Fresh, Chilled, and Rehydrated Freeze-Dried Gel Beads from Blends of Tapioca Flour, Soy Flour, and Cane Sugar
Nattagan Chantagith, Natnaree Katkaew, and Panida Rattanapitigorn*Published Date : 2021-09-13
DOI : https://doi.org/10.12982/CMUJNS.2021.093
Journal Issues : Number 4, October-December 2021
Abstract An extreme vertices design for a mixture of three components was used to establish the proportions of tapioca flour (50% to 100% w/w), soy flour (0% to 50% w/w), and cane sugar (0% to 10% w/w) mass fractions in a food gel bead system. Thus, nine compositions were prepared and analyzed. The pasting profiles of the mixtures were studied using a Rapid Visco Analyzer. The texture profiles of fresh, chilled, and rehydrated freeze-dried gel beads were studied using a texture analyzer. Increasing the proportion of soy flour in the range of 11.25% to 50.00% w/w decreased the peak viscosity, breakdown, final viscosity, and setback of mixed flour. Tapioca flour in the proportion of 81.25% to 100.00% w/w recorded the lowest hardness of fresh gel beads (92.00 to 283.00 g). Soy flour in the proportion of 11.25% to 50.00% w/w exhibited lower texture profiles (hardness, chewiness, and gumminess) than tapioca flour in gel beads for both chilled and rehydrated freeze-dried gel beads. Significant relationships were found among pasting profiles of the flour mixtures and texture profiles of fresh, chilled, and rehydrated freeze-dried gel beads, implying a functional role for soy flour in food gel beads. In conclusion, soy flour can act as an anti-retrogradation agent for the gel beads both in chilled (stored at 4°C for 7 days) and freeze-dried conditions. A small amount of cane sugar does not affect the inhibition of starch retrogradation in the gel bead system.
Keywords: Anti-retrogradation, Food gel bead, Pasting profile, Soy flour, Tapioca flour, Texture profiles
Citation: Chantagith, N., Katkaew, N., and Rattanapitigorn, P. 2021. Pasting behavior and viscoelastic properties of fresh, chilled, and rehydrated freeze-dried gel beads from blends of tapioca flour, soy flour, and cane sugar. CMU J. Nat. Sci. 20(4): e2021093.
INTRODUCTION
The main component in many kinds of food products is flour or starch. A challenging task in developing starch-rich food products is the retrogradation of starch during storage at low temperatures. Tapioca flour is one of the most important food ingredients in many food products such as fruit pie fillings, sauces, soups, milk-based dessert puddings, noodles, and tapioca pearls (Taiwanese boba) (Fu et al., 2005). The distinctive retrogradation of tapioca flour is established in a food gel model of, for example, tapioca pearls. Tapioca pearls form a soft, chewy gel after gelatinization – a firm turbid gel occurs when stored at low temperatures because of starch retrogradation. The retrogradation of starch is based on the recrystallization of amylose and amylopectin and causes the staling of starch gel. The undesirable effects of staling of starch-rich foods cause reductions of shelf-life and consumer acceptance. The staling of starch is dependent on amylose–amylopectin ratio, water–starch ratio, storage temperature, and the other ingredients (sugar, lipids, proteins, carbohydrates, and hydrocolloid) (Wang et al., 2015). Farhat et al. (2000) explained that water can act as a plasticizer for proteins and polysaccharides at a high hydration level. In contrast, increasing the moisture content of extruded waxy maize starch in the range of 20% to 60% (w/w dry basis) increases the retrogradation rate of starch. Tapioca flour is composed of 17% amylose and 83% amylopectin and has a pasting temperature of 67.6°C (Breuninger et al., 2009). According to the rapid retrogradation nature of tapioca flour, using a blend of two or more ingredients such as soy flour and cane sugar when formulating starchy food may provide a desirable anti-retrogradation effect.
Soy flour has a high nutrient content: 10.8% to 12.3% moisture content, 37.1% to 39.6% protein, 17.6% to 18.9% oil, 4.5% to 4.8% fiber, and 20.3% to 21.2% carbohydrate (Stevenson et al., 2006). Soy flour is used to improve the quality and shelf-life of many products, such as baked goods and noodles. Soy flour plays an important role in the food industry according to its nutritional value and water absorption functionality (Nilufer et al., 2008). Soy flour cannot form a gel at a concentration of less than 8% but can form a weak gel at a concentration of 8% to 10% (Ali et al., 2012). Omeire et al. (2014) reported that formulated blends of wheat flour, acha seed flour, and soy flour were used to produce noodles. The protein content increased with an increase in the proportion of soy flour from 0% to 50%. Otegbayo et al. (2013) reported that increasing the ratio of full-fat soy flour substitution from 15% to 50% in a mixture with tapioca flour increased the water absorption capacity and decreased the swelling capacity of mixed flour. The interaction of soy protein and starch from waxy maize or potato was reported by Song (2000). Soy protein and amylose may form a helical complex, which retards starch swelling and causes a slight increase in pasting temperature.
Cane sugar is dehydrated sugarcane (Saccharum officinarum L.) juice (Takahashi et al., 2016). Sugar is added to improve the perception of starch-based foods such as baked products and snacks (Farhat et al., 2000). Some publications have reported that sugar has a significant effect on starch retrogradation (Wang et al., 2015). Cairns et al. (1991) indicated that sucrose plays an anti-retrogradation role in wheat starch gels, while glucose can slow starch retrogradation. Farhat et al. (2000) reported that xylose, fructose, and sucrose at a concentration of 10% enhanced the retrogradation of extruded waxy maize starch when kept at 40 °C. The sample had a moisture content in the range of 20% to 50% (dry basis). Zolelmein et al. (2020) reported that sucrose at a ratio of 2% to 5% in combination with 0% to 1% xanthan gum resulted in increased the pasting profiles of corn starch except for setback values. The results indicated that an increased formation of hydrogen bonds between the three ingredients might affect the pasting profiles of the mixture of corn starch, xanthan gum, and sucrose.
Drying is a method of extending the shelf-life of tapioca starch pearls. Drying conditions can alter the interior structure and damage starch granules, affecting the physical properties of starch granules, such as pasting properties and retrogradation (Zhang et al., 2014). Fu et al. (2005) improved the quality of dried tapioca pearls by using low-power microwave finish drying. The convective drying time was reduced by 50% to 75%. Microwave-dried products had a higher unbroken ratio, shorter cooking time, and reduced cooking loss when compared to hot air-dried products. An alternative drying method is freeze-drying, which is a useful technology to maintain the original food quality and nutritive values and extend the shelf-life of food products. Zhang et al. (2014) reported that freeze-drying results in a significant increase in the digestion rate of potato starch. Freeze-dried food products are convenient to prepare for consumption, for example, by placing in water in order to rehydrate them. Freeze-dried tapioca gel beads are commercially available products nowadays. However, the texture profiles of rehydrated starch-rich foods after freeze-drying are not clearly explained.
The tendency of starch retrogradation can be studied from its pasting behavior and viscoelastic properties using a Rapid Visco Analyzer and a texture analyzer, respectively (Wang et al., 2015). Therefore, this study aimed to investigate the pasting profiles of tapioca flour, soy flour and cane sugar (TF-SF-CS) mixtures and the texture profiles of
TF-SF-CS gel beads as a basis for understanding the anti-retrogradation effect of gel beads in both cold storage condition and freeze-drying condition, and rehydration efficiency of the gel beads after freeze-drying regarding the effect of tapioca flour, soy flour, and cane sugar.
MATERIALS AND METHODS
Materials
Tapioca flour (Fish® brand, PK Trading (Thailand) Co., Ltd., 11.72 ± 0.26% moisture content), full-fat soy flour (Cottage Farm® brand, 10.47 ± 0.04% moisture content), and cane sugar (Raithaicharoenporn® brand, organic product, 4.87 ± 0.21% moisture content) were purchased from a local food store in Chiang Mai, Thailand and stored at 4°C before use.
Flour fraction preparation and pasting profile analysis
An extreme vertices design was used to formulate the three-component mixtures of tapioca flour (proportion of 50.00% to 100.00% w/w), soy flour (proportion of 0.00% to 50.00% w/w), and cane sugar (proportion of 0.00% to 10.00% w/w). Nine runs of tapioca flour–soy flour–cane sugar (TF-SF-CS) mixtures were prepared. The mixture component (3 g) was mixed with 25 g of distilled water. The pasting profiles for TF-SF-CS mixtures were analyzed using a Rapid Visco Analyzer (RVA-4SA with Thermocline for Windows software, Newport Scientific Pty., Australia). Samples were pasted according to the General Pasting Standard 1 procedure: they were held at 50°C for 1 min, heated to 95°C at a rate of 12.2°C.min−1, maintained at 95°C for 2.7 min, cooled to 50°C at the same rate, and then held at 50°C for 2.1 min for RVA curves. The agitation speed was set at 960 rpm for the first 10 s to assure full dispersal of the samples and then at 160 rpm until the finish. The RVA curves represent the pasting temperature, peak viscosity, breakdown, and setback.
Food gel bead preparation
TF-SF-CS mixture (20 g) was mixed with 20 g of water and heated in a Teflon-coated pan on a hot plate. The mixture was stirred until a dough was obtained. Gel beads with an approximate diameter of 8 mm were prepared and gelatinized using hot steam for 12 min, except for run 3 (pure tapioca flour) and run 4 (the mixture of 90% w/w tapioca flour and 10% w/w cane sugar) in which the flour fraction was heated for only 3 min to obtain fresh gel beads (0 days). Chilled gel beads were examined after being stored for 7 days in a plastic can at 4°C. Freeze-dried gel beads were prepared by freezing the gel beads at −18°C for 48 hr before freeze-drying at −45°C in a freeze dryer (FreeZone 6 Liter Console Freeze Dryer with Stoppering Tray Dryer, LABCONCO, USA). Rehydrated gel beads were prepared by placing the sample in water for 3 hr at ambient temperature. The water absorption capacity (WAC) of freeze-dried beads was recorded as the percentage of the difference in the weight of freeze-dried beads versus rehydrated beads divided by the weight of freeze-dried beads.
Moisture content and water activity
The moisture content (MC) of TF-SF-CS mixtures was determined using a moisture analyzer (Sartorius MA45C, England). Approximately 3 g of TF-SF-CS mixture was weighed in an aluminum sample pan and heated at 105°C for about 5 min. The MC of fresh and chilled TF-SF-CS gel beads was determined using the AOAC method (2000). The sample (1 g) was dried at 105°C for 3 hr in a hot-air oven (Memmert Gmblt CoKG, Schwabash, Germany). A water activity (aw) meter (model CX3TE, AQUA-LAB, USA) was used to measure the aw of the freeze-dried samples.
Texture profile analysis
Texture profile analysis (TPA) was performed on fresh, chilled, and rehydrated gel beads using a texture analyzer (TA-XT2, Stable Micro Systems, Surrey, England) equipped with a 50 kg force load cell. A P/25 cylinder probe was used to compress three gel beads using the standard two-cycle program of the TPA test. The parameters of the TPA test were as follows: 50% strain of compression, 1.0 mm.s−1 test speed, 1.0 mm.s−1 pre-test speed, 5 mm.s−1 post-test speed, and trigger force of 5 g.
Statistical analysis
All experiments were performed in two replications. The results for pasting profiles of TF-SF-CS mixtures and texture profiles of fresh, chilled, and rehydrated gel beads were analyzed using one-way analysis of variance (ANOVA). Significant differences among groups (P ≤ 0.05) were analyzed by Tukey’s test. The relationship between the pasting profiles of TF-SF-CS mixtures, the texture profiles of fresh, chilled, and rehydrated gel beads, and the component composition were analyzed and represented using the Pearson’s correlation coefficient (r).
RESULTS
MC and pasting profile of TF-SF-CS mixtures
Table 1 presents the MC of TF-SF-CS mixtures and shows significant differences (P ≤ 0.05). Pure tapioca flour (run 3) and the mixture with a high proportion of tapioca flour (run 4) had a higher MC than that of TF-SF-CS mixtures with a high proportion of soy flour. TF-SF-CS mixtures contained an MC in the range of 10.64% to 11.72%.
Table 2 presents the pasting profiles TF-SF-CS mixtures and shows significant differences (P ≤ 0.05). Pure tapioca flour and the mixture of 85.25% w/w TF, 11.25% w/w SF, and 7.5% w/w CS (run 8) provided the lowest pasting temperature (67.93 to 68.65°C). Mixing 10% cane sugar with 90% tapioca flour increased the pasting temperature to 69.45 °C. The low peak viscosity, breakdown, final viscosity, and setback of TF-SF-CS mixtures were observed at a soy flour proportion of 31.25% to 50.00% mass fraction (runs 1, 2, 6, and 7) (Table 2 and Figure 1).
Table 2 indicates that addition of soy flour in the proportion range of 11.25% to 50.00% mass fraction was significantly decreased breakdown value. The setback of TF-SF-CS mixtures with a high proportion of soy flour (22.50% to 50.00% mass fraction) was in the range of 25.50 to 80.00 mPa.s while the setback of pure tapioca flour was 1,135 mPa.s. The lower setback of TS-SF-CS mixtures with a high proportion of soy flour suggests that soy flour provides an anti-retrogradation effect for tapioca starch paste.
The setback value of the mixture of 90% w/w tapioca flour and 10% w/w cane sugar (run 4) was significantly lower than that of pure tapioca flour (run 3) as well.
Table 1. Moisture content of TF-SF-CS mixtures.
|
Run |
Component proportion (%) |
Moisture content (%) |
||
|
TF |
SF |
CS |
||
|
1 |
50 |
50 |
0 |
10.89 ± 0.26cd |
|
2 |
50 |
40 |
10 |
10.64 ± 0.11d |
|
3 |
100 |
0 |
0 |
11.72 ± 0.26a |
|
4 |
90 |
0 |
10 |
11.36 ± 0.31abc |
|
5 |
72.5 |
22.5 |
5 |
11.24 ± 0.20bc |
|
6 |
61.25 |
36.25 |
2.5 |
11.20 ± 0.18bc |
|
7 |
61.25 |
31.25 |
7.5 |
10.68 ± 0.11d |
|
8 |
86.25 |
11.25 |
2.5 |
11.42 ± 0.09ab |
|
9 |
81.25 |
11.25 |
7.5 |
11.20 ± 0.11bc |
Note: Mean ± standard deviation values in the same column followed by different letters are significantly different (P ≤ 0.05).
TF = tapioca flour; SF = soy flour; CS = cane sugar
Table 2. Pasting profiles of TF-SF-CS mixtures.
|
Run |
Pasting temperature |
Peak viscosity (mPa.s) |
Breakdown (mPa.s) |
Final viscosity (mPa.s) |
Setback (mPa.s) |
|
|
1 |
71.00 ± 1.13abc |
204.00 ± 7.07g |
138.50 ± 9.19f |
91.00 ± 19.80e |
25.50 ± 3.54e |
|
|
2 |
71.90 ± 0.00a |
221.00 ± 9.90g |
147.50 ± 0.71f |
111.00 ± 1.14e |
37.50 ± 9.19e |
|
|
3 |
67.93 ± 0.04f |
4822.00 ± 74.95a |
3238.50 ± 221.32a |
2718.50 ± 41.72a |
1135.00 ± 188.09a |
|
|
4 |
69.45 ± 0.00de |
4025.00 ± 21.21b |
2631.50 ± 16.26b |
2242.50 ± 27.58b |
849.00 ± 32.53b |
|
|
5 |
70.23 ± 0.04 bcd |
809.00 ± 25.46e |
589.50 ± 7.78e |
299.50 ± 40.31d |
80.00 ± 7.07de |
|
|
6 |
71.53 ± 0.67ab |
367.50 ± 9.19f |
257.50 ± 19.09f |
160.00 ± 4.24e |
50.00 ± 5.66de |
|
|
7 |
71.10 ± 1.06abc |
378.50 ± 9.19f |
265.50 ± 4.95f |
173.00 ± 0.00e |
60.00 ± 4.24de |
|
|
8 |
68.65 ± 0.00ef |
1821.50 ± 157.68c |
1406.50 ± 108.19c |
653.50 ± 85.56c |
238.50 ± 36.06c |
|
|
9 |
69.88 ± 0.60cde |
1607.00 ± 8.49d |
1206.00 ± 18.38d |
610.00 ± 59.40c |
209.00 ± 32.53cd |
Note: Mean ± standard deviation values in the same column followed by different letters are significantly different (P ≤ 0.05).
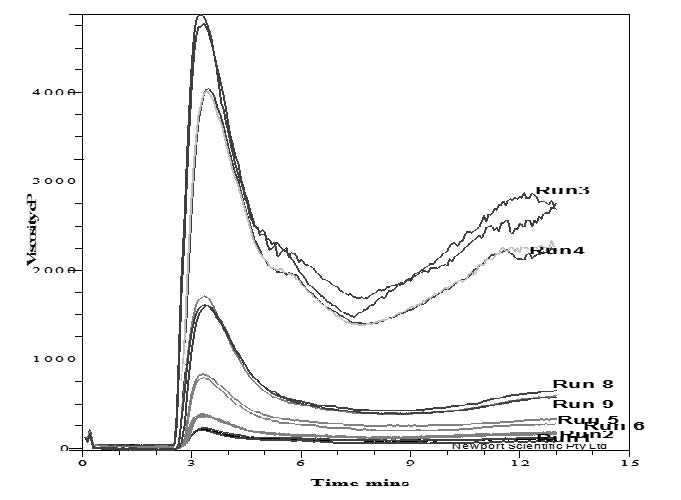
Figure 1. Pasting curve of tapioca flour (TF), soy flour (SF), and cane sugar (CS) mixtures.
Physicochemical properties of TF-SF-CS gel beads
The MC of fresh TF-SF-CS gel beads was in the range of 45.34% to 57.62%; that of chilled TF-SF-CS gel beads was in the range of 44.79% to 57.21% (Figure 2a and 2b). Pure tapioca flour (run 3) and the mixture of 90% w/w TF and 10% w/w CS (run 4) required a shorter period of steam heating (only 3 min) but provided the highest MC for both fresh and chilled gel beads.
The aw of freeze-dried TF-SF-CS gel beads was significantly influenced by the proportion of tapioca flour, soy flour, and cane sugar, ranging from 0.068 to 0.236 (Figure 2c). The mixture of 50% w/w TF, 40% w/w SF, and 10% w/w CS (run 2) had the highest aw value of 0.236.
The WAC of rehydrated TF-SF-CS gel beads was in the range of 97.19% to 256.72% (Figure 2d). A high proportion of tapioca flour in runs 3 and 4 provided the highest WAC values.
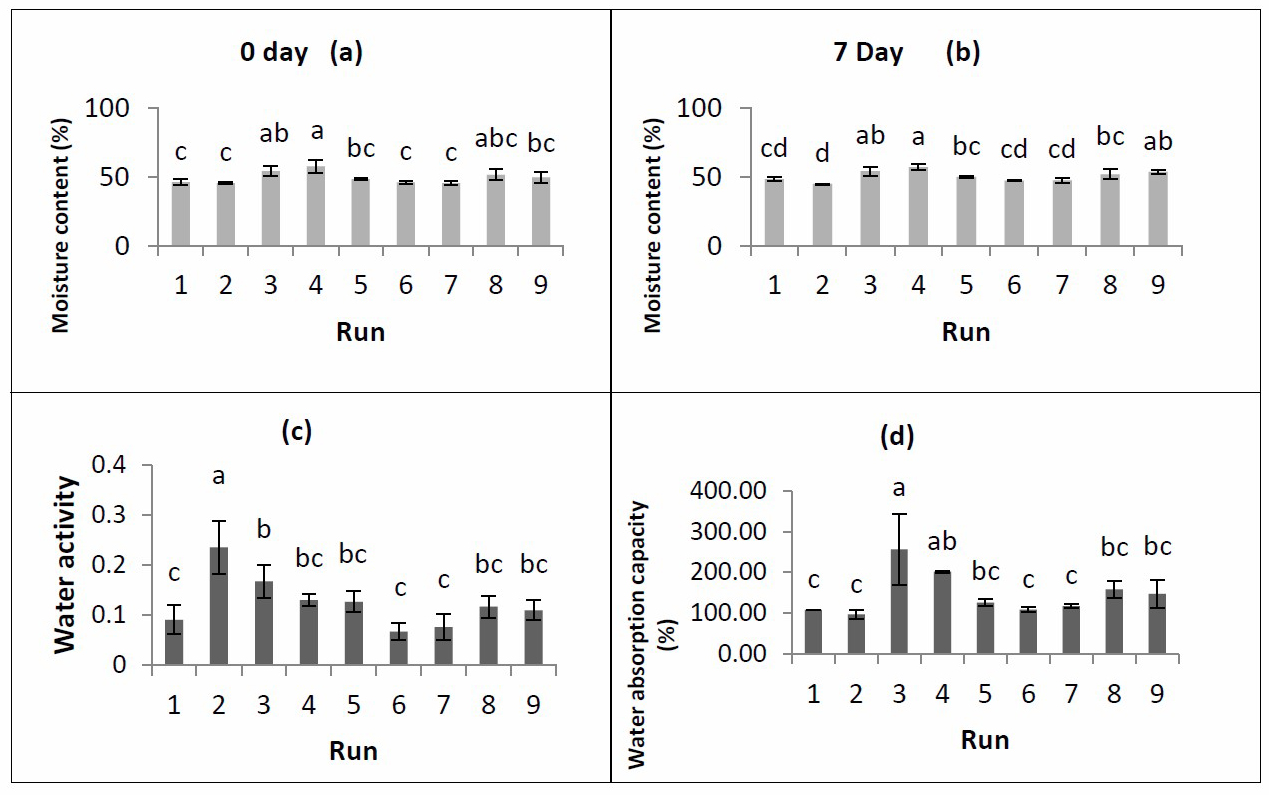
Figure 2. (a) Moisture content of fresh (0 day) and (b) chilled TF-SF-CS gel beads (7 days) (c) Water activity of TF-SF-CS freeze-dried beads (d) Water absorption capacity of rehydrated-freeze-dried TF-SF-CS beads. TF = tapioca flour; SF = soy flour; CS = cane sugar. Different letters on the bars indicate significant differences (P < 0.05).
Texture profile of TF-SF-CS gel beads
Figure 3 presents the texture profile of fresh pure tapioca beads in comparison with fresh TF-SF-CS gel beads. The larger peak area in zone 2-3 of Figure 3a than Figure 3b indicates the higher adhesiveness value, caused by the stickier surface of pure tapioca gel beads.
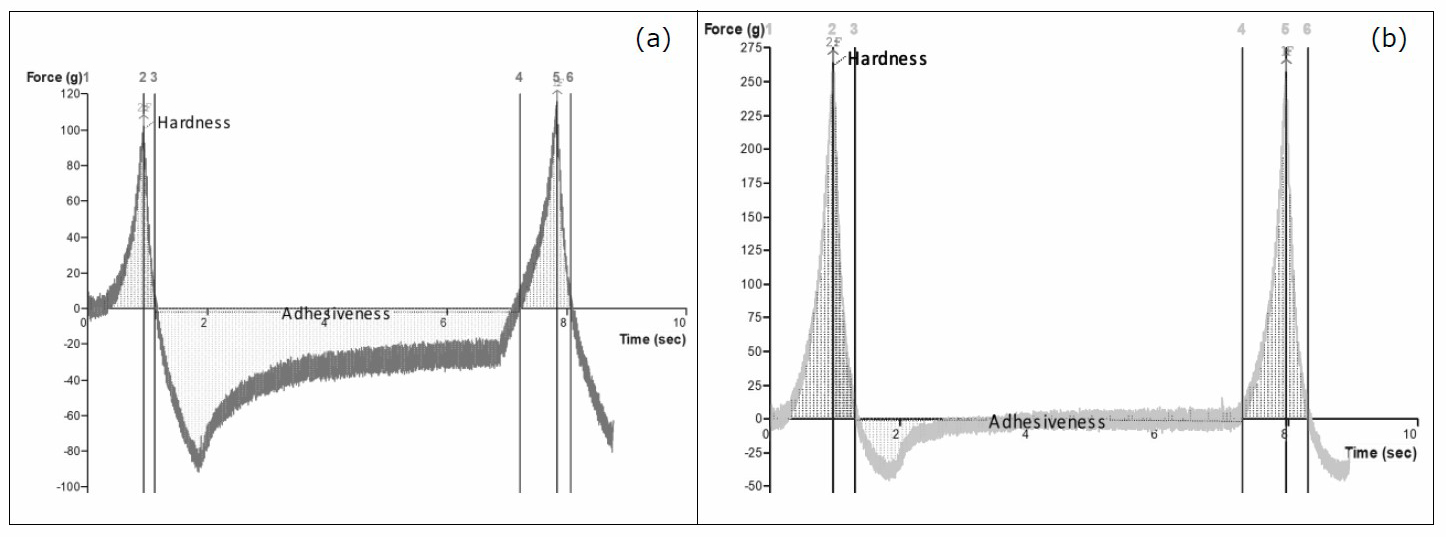
Figure 3. Texture profile analysis of (a) Fresh pure tapioca beads (b) Fresh TS-SF-CS beads; TF = tapioca flour; SF = soy flour; CS = cane sugar.
Figure 4a–c presents images of fresh pure tapioca flour, 90% w/w TF and 10% w/w CS, and TF-SF-CS gel beads. Fresh tapioca flour gel beads have a clear glossy gel; 90% w/w TF and 10% w/w CS gel beads have a golden-brown color and clear glossy gel; TF-SF-CS gel beads have a yellow and firm turbid gel.
The effects of flour fraction (9 runs) and gel bead preparation method (3 methods of fresh, chilled, and rehydrated) showed a significant difference (P ≤ 0.05) for texture profiles of gel beads, except springiness of fresh and chilled gel beads, and the chewiness of fresh gel beads which showed non-significant difference (P > 0.05) (Figure 4d-i). A dramatic increase of hardness, gumminess, chewiness, and resilience was observed for pure tapioca flour gel beads (run 3) and the 90% w/w TF and 10% w/w CS gel beads (run 4) for chilled and rehydrated gel beads. These results indicate the staling phenomenon of starch in chilled and rehydrated gel beads of runs 3 and 4.
The cohesiveness of fresh, chilled, and rehydrated gel beads was significantly affected by the presence of soy flour and cane sugar. The springiness of TF-SF-CS gel beads was only affected by freeze-drying conditions; that of pure tapioca gel beads was not. Rehydrated TF-SF-CS gel beads were significantly less springy than pure tapioca flour gel beads (run 3). Springiness indicates the gel beads’ recoverability from compression. These results indicate that the mixing proportion of soy flour and cane sugar with tapioca flour retarded the retrogradation of chilled beads and provided the soft texture of gel beads after rehydration.
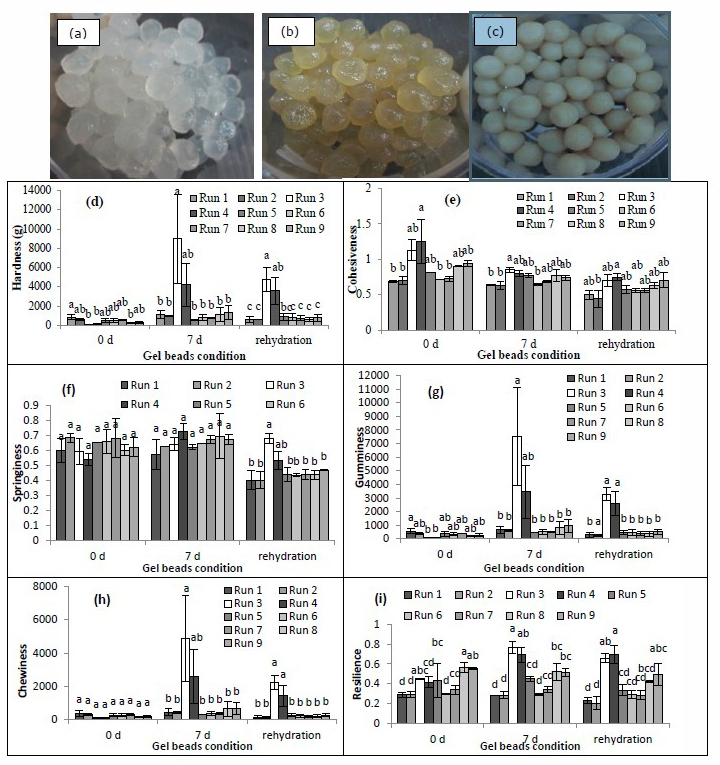
Figure 4. (a) Fresh TF beads: Run 3 (b) Fresh TF-CS beads: Run 4 (c) Fresh TF-SF-CS beads (d) Hardness (e) Cohesiveness (f) Springiness (g) Gumminess (h) Chewiness and (i) Resilience of fresh (0 d), chilled (7 d), rehydrated-freeze-dried TF-SF-CS gel beads. TF = tapioca flour; SF = soy flour; CS = cane sugar. Different letters on the bars indicate significant differences (P < 0.05).
Role of flour fractions on the pasting profiles of TF-SF-CS mixtures and texture profiles of gel beads
Pearson’s correlation coefficient, describing the linear relationships between the mixture components (tapioca flour, soy flour, and cane sugar) and pasting profiles of TF-SF-CS mixtures, are shown in Table 3. Peak viscosity, breakdown, final viscosity, and setback of the TF-SF-CS mixtures are highly (negatively) correlated with the proportion of soy flour. The pasting profiles of the mixtures decreased with an increase in the proportion of soy flour. In contrast, the proportion of tapioca flour is highly (positively) correlated with the pasting profiles of the TF-SF-CS mixtures. The pasting profiles of the mixtures increased with an increase in the proportion of tapioca flour. No significant relationship was found between the proportion of cane sugar (0.00% to 10% mass fraction) and the pasting profiles of the mixtures.
Table 3 also presents the Pearson’s correlation coefficient, describing the linear relationships between the mixture components (tapioca flour, soy flour, and cane sugar), and texture profiles of fresh (0 days), chilled (7 days), and rehydrated gel beads. The hardness and chewiness of fresh gel beads tended to increase with an increase in the proportion of soy flour. In contrast, the hardness and chewiness of chilled and rehydrated gel beads tended to decrease with an increase in the proportion of soy flour. The proportion of soy flour is highly (negatively) correlated with the cohesiveness and resilience of fresh, chilled, and rehydrated gel beads. Increased springiness of chilled and rehydrated gel beads was affected by decreasing the proportion soy flour.
The proportion of tapioca flour is highly (positively) correlated with the texture profiles of rehydrated beads. Increasing the mass fraction in TF-SF-CS gel beads increased the hardness.
The proportion of TF is not correlated with the springiness of fresh and chilled gel beads but is correlated with the springiness of rehydrated gel beads. No significant relationship was found between the proportion of CS (0.00% to 10% mass fraction) and the texture profiles of the gel beads.
Role of the pasting profiles of TF-SF-CS mixtures on the texture profiles of gel beads
A similar trend was observed for the relationship between the pasting profiles of TF-SF-CS mixtures and the texture profiles of fresh (0 days), chilled (7 days), and rehydrated gel beads, except for the springiness of chilled beads (Table 3). Pasting temperature is negatively correlated with the texture profiles of most gel beads samples, the exceptions being the springiness of chilled gel beads. Peak viscosity, breakdown, final viscosity, and setback of the TF-SF-CS mixtures are highly positively correlated with the hardness, cohesiveness, gumminess, chewiness, and resilience of fresh, chilled, and rehydrated TF-CS-CS gel beads. This experiment indicates that the pasting profiles of TF-SF-CS mixtures have a significant impact on the texture profiles of fresh, chilled and rehydrated gel beads, whereas the pasting profiles did not correlate with the springiness of chilled TF-CS-CS gel beads.
Table 3. The Pearson’s coefficient of correlation of the texture profile of 0, 7 days and reformation beads.
|
Proportion |
MC and pasting behaviors of TF-SF-CS mixtures |
|||||
|
MC |
PT |
PV |
BD |
FV |
SB |
|
|
Tapioca flour |
0.825** |
-0.891** |
0.902** |
0.923** |
0.841** |
0.822** |
|
Soy flour |
-0.738** |
0.821** |
-0.884** |
-0.902** |
-0.824** |
-0.798** |
|
Cane sugar |
-0.400 |
0.316 |
-0.081 |
-0.096 |
-0.075 |
-0.110 |
|
Proportion 0 day |
Texture profile of gel beads |
|||||
|
Hardness |
Cohesiveness |
Springiness |
Gumminess |
Chewiness |
Resilience |
|
|
Tapioca flour |
-0.870** |
0.821** |
-0.440 |
-0.822* |
-0.796** |
0.759** |
|
Soy flour |
0.896** |
-0.846** |
0.414 |
0.848** |
0.811 |
-0.753 |
|
Cane sugar |
-0.119 |
0.113 |
0.121 |
-0.122 |
-0.066 |
-0.028 |
|
7 days |
Hardness |
Cohesiveness |
Springiness |
Gumminess |
Chewiness |
Resilience |
|
Tapioca flour |
0.643** |
0.878** |
0.412 |
0.661** |
0.664** |
0.943** |
|
Soy flour |
-0.588** |
-0.862** |
-0.485* |
-0.606** |
-0.618** |
-0.933** |
|
Cane sugar |
-0.247 |
-0.075 |
0.335 |
-0.250 |
-0.210 |
-0.045 |
|
Rehydration |
Hardness |
Cohesiveness |
Springiness |
Gumminess |
Chewiness |
Resilience |
|
Tapioca flour |
0.697** |
0.812** |
0.760** |
0.732** |
0.722** |
0.903** |
|
Soy flour |
-0.673** |
-0.818** |
-0.711** |
-0.713** |
-0.686** |
-0.911** |
|
Cane sugar |
-0.110 |
0.029 |
-0.224 |
-0.089 |
-0.164 |
0.040 |
|
0 day |
Hardness |
Cohesiveness |
Springiness |
Gumminess |
Chewiness |
Resilience |
|
PT |
-0.590** |
-0.593** |
-0.670** |
-0.617** |
-0.636** |
-0.717** |
|
PV |
0.893** |
0.737** |
0.868** |
0.925** |
0.911** |
0.931** |
|
BD |
0.878** |
0.742** |
0.864** |
0.907** |
0.897** |
0.930** |
|
FV |
0.927** |
0.687** |
0.879** |
0.956** |
0.941** |
0.904** |
|
SB |
0.943** |
0.638** |
0.894** |
0.960** |
0.956** |
0.873** |
|
7 days |
Hardness |
Cohesiveness |
Springiness |
Gumminess |
Chewiness |
Resilience |
|
PT |
-0.624** |
-0.785** |
-0.372 |
-0.636** |
-0.632** |
-0.847** |
|
PV |
0.810** |
0.813** |
0.317 |
0.825** |
0.825** |
0.955** |
|
BD |
0.783** |
0.831** |
0.319 |
0.799** |
0.798** |
0.965** |
|
FV |
0.840** |
0.767** |
0.281 |
0.854** |
0.853** |
0.921** |
|
SB |
0.816** |
0.763** |
0.241 |
0.833** |
0.826** |
0.913** |
|
Rehydration |
Hardness |
Cohesiveness |
Springiness |
Gumminess |
Chewiness |
Resilience |
|
PT |
-0.590** |
-0.593** |
-0.670** |
-0.617** |
-0.636** |
-0.717** |
|
PV |
0.893** |
0.737** |
0.868** |
0.925** |
0.911** |
0.931** |
|
BD |
0.878** |
0.742** |
0.864** |
0.907** |
0.897** |
0.930** |
|
FV |
0.927** |
0.687** |
0.879** |
0.956** |
0.941** |
0.904** |
|
SB |
0.943** |
0.638** |
0.894** |
0.960** |
0.956** |
0.873** |
Note: * (P ≤ 0.05), ** (P ≤ 0.01) PT= Pasting temperature; PV = Peak viscosity; BD = Breakdown; FV = Final viscosity; SB = setback; TF = tapioca flour; SF = soy flour; CS = cane sugar. n = 18 (9 runs and 2 replications)
DISCUSSION
The MC and pasting profiles TF-SF-CS mixtures shows significant differences (P ≤ 0.05). Soy flour (MC of 10.47%) and cane sugar (MC of 4.87%) have a lower MC than tapioca flour (MC of 11.72%), so increasing the proportion of soy flour and cane sugar decreased the MC of the mixtures.
Tapioca flour has a pasting temperature of 67.6°C (Breuninger et al., 2009). Hong et al. (2014) reported that adding sucrose in the proportion of 30% to 55% to tapioca flour raised the pasting temperature of the flour mixture by delaying starch swelling. In the present study, mixing tapioca flour in combination with soy flour and cane sugar increased the pasting temperature from 67.93 to 71.90°C. A similar result was reported in a system of potato starch and soy protein by Song (2000). Soy protein can retard the swelling of potato starch in a starch–protein complex, causing an increase of pasting temperature.
A soy flour proportion of 31.25% to 50.00% mass fraction (runs 1, 2, 6, and 7) provided the low peak viscosity, breakdown, final viscosity, and setback (Table 2 and Figure 1). Peak viscosity is influenced by the presence of the other components in flour mixtures such as proteins or carbohydrates (Wang et al., 2015). The decrease in peak viscosity may be related to the swelling of starch granules that was reduced because of the soy flour’s water absorption competition. Similarly, the phenomenon was reported by Luo et al. (2017): the addition of inulin to wheat starch can cause a lower peak viscosity of wheat starch gel as a result of water absorption by inulin. There is then insufficient water to combine with the amylopectin of starch granules to form a viscous paste during gelatinization.
TF-SF-CS mixtures' breakdown value significantly decreased by adding soy flour in the proportion range of 11.25% to 50.00% mass fraction. Low breakdown viscosity implies a strong ability of TF-SF-CS mixtures to withstand heat and shear stress during cooking. This implies that the stability of mixed starch paste is enhanced by adding soy flour. Low final viscosity reveals that the TF-SF-CS mixtures formed low-viscosity gels after cooling of cooked starch to 50°C. The setback value reflects the degree of recrystallization and rearrangement of amylose molecules in starch granules. Low setback implies a weak tendency for starch retrogradation after gelatinization (Wang et al., 2015). TF-SF-CS mixtures with a high proportion of soy flour (22.50% to 50.00% mass fraction)'s setback value and 90% w/w tapioca flour and 10% w/w cane sugar mixture (run 4)'s setback value were lower than the setback of pure tapioca flour. A lower set back value means a lower starch retrogradation, indicating that soy flour provides an anti-retrogradation effect for tapioca starch paste. Wang et al. (2015) stated that sugar has a significant effect on starch retrogradation. Cairns et al. (1991) reported that sucrose plays an anti-retrogradation role in wheat starch gels, while glucose can slow starch retrogradation. The hydration of sugar around starch molecules perhaps restricts the rearrangement of amylose molecules and sugar may act as an anti-retrogradation agent. In contrast, Farhat et al. (2000) reported that xylose, fructose, and sucrose at a concentration of 10% enhanced the retrogradation of extruded waxy maize starch when it was kept at 40 °C whereas xylose at a concentration of 30% decreased the retrogradation rate at a high starch hydration level (MC of 35–50% dry basis).
The proportion of tapioca flour, soy flour, and cane sugar influenced the MC of fresh and chilled TF-SF-CS gel beads, including the aw of freeze-dried TF-SF-CS gel beads. (Figure 2a-c). The higher number of molecules of protein in soy flour, in combination with the greater amount of cane sugar in run 2, may have bound water more tightly, making it harder to remove than for the other proportions.
Samples in runs 3 and 4 with a high proportion of tapioca flour provided the highest WAC values of rehydrated TF-SF-CS gel beads (Figure 2d). In contrast, Otegbayo et al. (2013) reported that tapioca flour has a WAC of 125 g. 100 g/100 g. Increasing the proportion of full-fat soy flour in the range of 15% to 50% mass fraction increased the WAC of soy–tapioca mixed flour to 170.50 g. 100 g/100 g. Acuña et al. (2012) reported that full-fat soy flour has a WAC of 180 g. 100 g/100 g. Zhang et al. (2014) reported that freeze-drying can alter the interior structure and disrupt the surface morphology of starch granules, affecting their physical properties. The diversity of results may be due to different experimental conditions.
Texture profiles of gel beads were affected by flour fraction (9 runs), gel bead preparation method (3 methods of fresh, chilled, and rehydrated), except springiness of fresh and chilled gel beads and the chewiness of fresh gel beads. (Figure 4d-i). A marked increase of hardness, gumminess, chewiness, and resilience of pure tapioca flour gel beads (run 3) and the 90% w/w TF and 10% w/w CS gel beads (run 4) for chilled and rehydrated gel beads indicate the staling phenomenon of starch. In contrast, Rattanapitigorn et al. (2005) reported that rehydrated freeze-dried tapioca beads (diameter ca. 4.2 mm) had a soft and smooth texture and hardness of 7.2 to 27.35 g. The commercial production of tapioca beads uses a rolling bowl to form the small beads. For gelatinization of tapioca beads, they were boiled in hot water for 15 min and allowed to swell entirely in cold water for 24 hr; beads had an MC of 91.97% to 92.59% before freeze-drying.
The cohesiveness of gel beads was significantly affected by nine flour fractions and three gel bead preparation methods (fresh, chilled, and rehydrated). In contrast, the springiness of TF-SF-CS gel beads was only affected by rehydration from freeze-drying conditions. Springiness indicates the gel beads' recoverability from compression. Then the decrease in springiness of rehydrated gel beads may be the effect of the freeze-drying method, which can produce the porous structure of gel beads during the freeze-drying process via ice sublimation. Zhang et al. (2014) reported that freeze-drying could disrupt potato starch granules' surface morphology and degrade amylopectin's molecular order. Chavan et al. (2017) reported that the springiness and chewiness of rehydrated freeze-dried soybean tofu were decreased compared to fresh tofu. These results indicate that the mixing proportion of soy flour and cane sugar with tapioca flour retarded the retrogradation of chilled beads and provided the soft texture of gel beads after rehydration. These food-gel models of TF-SF-CS mixture may be developed into new products highlighting the beneficial natural ingredients in the chilled vegetarian food products or thorough dried vegetarian food variety and gel food for the elderly.
The linear relationships between the mixture components (tapioca flour, soy flour, and cane sugar) and pasting profiles of TF-SF-CS mixtures are presented as Pearson's correlation coefficient (Table 3). The pasting profiles (peak viscosity, breakdown, final viscosity, and setback) of the TF-SF-CS mixtures decreased with an increase in the proportion of soy flour. A similar phenomenon was reported in a blend of yellow cassava starch and partially defatted soybean flour in custard powder (Alake et al., 2016). In contrast, the pasting profiles of the TF-SF-CS mixtures increased with an increase in the proportion of tapioca flour. Gelatinized tapioca flour leads to increased viscosity profiles, according to the water absorbed by the starch granules. The starch composition and non-starch components influence the pasting profiles of the mixtures. Tapioca flour comprises 0.32% protein, 0.17% fat, and 1.2% fiber (Chinma et al., 2013). Full-fat soy flour comprises 37.1% to 39.6% protein, 17.6% to 18.9% oil, and 4.5% to 4.8% fiber (Stevenson et al., 2006). In addition, soy flour cannot form a gel at a concentration below 8% and form a weak gel at a concentration of 8% to 10% (Ali et al., 2012). Therefore, mixing soy flour in proportion with tapioca flour significantly affected the pasting profiles of tapioca flour. The main components of soy flour are non-starchy, and soy flour cannot form a gel at a low concentration and forms a weak gel at a high level by nature. The correlation data analysis found no significant relationship between the proportion of cane sugar (0.00% to 10% mass fraction) and the TF-SF-CS mixtures' pasting profiles.
The Pearson's correlation coefficient describes the linear relationships between the mixture components (tapioca flour, soy flour, and cane sugar) and texture profiles of fresh (0 days), chilled (7 days), and rehydrated gel beads (Table 3). Increasing the proportion of soy flour tended to increase the hardness and chewiness of fresh gel beads. In contrast, it tended to decrease the hardness and chewiness of chilled and rehydrated gel beads with an increase in the proportion of soy flour.
Increased cohesiveness and resilience of fresh, chilled, and rehydrated gel beads and springiness of chilled and rehydrated gel beads were affected by decreasing the proportion of soy flour. Increasing the mass fraction in TF-SF-CS gel beads increased the hardness of rehydrated beads. In contrast, Rattanapitigorn et al. (2005) reported that rehydrated tapioca beads had a soft and smooth texture. The distinction in results maybe because of the bead formation method and the preparation of gel beads before freeze-drying. These results indicate that the bead formation method and gel beads preparation before freeze-drying affected the texture of rehydrated tapioca beads. Only the springiness of rehydrated gel beads is correlated with the proportion of TF. The proportion of CS (0.00% to 10% mass fraction) is not correlated with the gel beads' texture profiles.
The Pearson's correlation coefficient in Table 3 indicated that pasting profiles of TF-SF-CS mixtures correlate with the texture profiles of fresh (0 days), chilled (7 days), and rehydrated gel beads, except for the springiness of chilled beads. The high pasting temperature of TF-SF-CS mixtures was affected by a high proportion of soy flour, which caused a decrease in the pasting and texture profiles of TF-SF-CS samples. The suspension of soy flour provides a low peak viscosity in the range of 18 to 210 mPa.s depending on the preparation method (Agume et al., 2017). Increased peak viscosity, breakdown, final viscosity, and setback of the TF-SF-CS mixtures agreed with increasing the hardness, cohesiveness, gumminess, chewiness, and resilience of fresh, chilled, and rehydrated TF-CS-CS gel beads. This experiment indicates that the pasting profiles of TF-SF-CS mixtures significantly impact the texture profiles of fresh, chilled and rehydrated gel beads except for chilled TF-CS-CS gel beads' springiness.
CONCLUSION
Interaction between tapioca flour, soy flour, and cane sugar may retard swelling of starch granules, causing a decrease in viscosity profiles and an increase in the pasting temperature of TF-SF-CS mixtures. The retrogradation of TF-SF-CS gel beads may be considered from the dramatic increase of hardness, chewiness, and resilience of texture profiles during chilling. Gel beads made from pure tapioca flour and the mixture of 90% w/w TF and 10% w/w CS are not appropriate for chilling or freeze-drying processes according to the retrogradation of starch. A high proportion of tapioca flour in the range of 61.25% to 86.25% mass fraction in combination with soy flour and cane sugar may provide rehydrated gel beads with a more chewy texture. A high proportion of SF (40% to 50% mass fraction) in combination with tapioca flour and cane sugar may provide alternative nutritive food gel models for fresh, chilled, or rehydrated gel beads. Sensory evaluation using descriptive analysis with scaling or scoring tests should be used to further investigate the texture profiles of TF-SF-CS gel beads in order to confirm the results of the objective evaluation via texture analysis. The mixture design with a high concentration of cane sugar in tapioca flour and soy flour mixtures should be further studied. Cane sugar at a concentration of equal or less than 10% w/w does not appear to affect the pasting profiles of TF-SF-CS mixtures and the texture profiles of TF-SF-CS gel beads.
ACKNOWLEDGMENTS
Thanks are expressed to Faculty of Agro-industry, Chiang Mai University that support the facility for this experiment via the research exercise project of undergraduate student.
AUTHOR CONTRIBUTIONS
Panida Rattanapitigorn assisted as an advisor, designed the experiment, analyzed, and wrote a research paper. Nattagan Chantagith and Natnaree Katkaew done experiments and tested the properties of the treatment samples.
CONFLICT OF INTEREST
The authors declare no conflict of interest.
ETHICAL REVIEW
This study does not involve any human or animal testing.
REFERENCES
Acuña, S.P.C., González, J.H.G., and Torres, I.D.A. 2012. Physicochemical characteristics and functional properties of vitabosa (Mucuna Deeringiana) and soybean (Glycine max). Ciênc. Tecnol. Aliment., Campinas 32: 98-105.
Alake, O.O., Babajide, J.M., Adebowale, A.A., and Adebisi, M.A. 2016. Evaluation of physico-chemical properties and sensory attributes of cassava enriched custard powder. Cogent Food & Agriculture 2, 1246116: 1-14.
Ali, M.A.M., Tinay, A.H.E., Elkhalifa, A.E.O., Mallasy, L.O., and Babiker, E.E. 2012. Effect of different supplementation levels of soybean flour on pearl millet functional properties. Food and Nutrition Sciences. 3: 1-6.
Agume, A.S.N., Njintang, N.Y., and Mbofung, C.M.F. 2017. Effect of soaking and roasting on the physicochemical and pasting properties of soybean flour. Foods. 6: 1-10.
Breuninger, W.F., Piyachomkwan, K., and Sriroth, K. 2009. Tapioca/Cassava Starch: Production and Use. p. 541-568. In R.L., Whistler, and J.N., BeMiller (eds.), Starch: Chemistry and Technology (3th edition). Elsevier Inc.
Cairns P, Anson KJI, and Morris VJ. 1991. The effect of added sugars on the retrogradation of wheat starch gels by X‐ray diffraction. Food Hydrocolloid. 5: 151– 3.
Chavan, S.M., Verma, R.C., and Raviteja. 2017. Textural and sensory characteristics of freeze dried tofu. International Journal of Current Microbiology and Applied Sciences. 6: 119-128.
Chinma, C.E., Ariahu, C.C., and Abu, J.O. 2013. Chemical composition, functional and pasting propertiesof cassava starch and soy protein concentrate blends. Journal of Food Science and Technology. 50: 1179–1185.
Farhat, I.A., Blanshard, J.M.V., Descamps, M., and Mitchell, J.R. 2000. Effect of sugars on retrogradation of waxy maize starch-sugar extrudates. Cereal Chemistry. 77: 202-208.
Fu, Y.C., Dai, L., and Yang, B.B. 2005. Microwave finish drying of (tapioca) starch pearls. International Journal of Food Science and Technology. 40: 119–132.
Hong, Y., Zhu, L. and Gu, Z. 2014. Effects of sugar, salt and acid on tapioca starch and tapioca starch-xanthan gum combinations. Starch/Stärke. 66: 436–443.
Luo, D., Li, Y., Xu, B., Ren, G., Li, P., Li, X., Han, S., and Liu, J. 2017. Effects of inulin with different degree of polymerization on gelatinization and retrogradation of wheat starch. Food Chemistry. 229: 35–43.
Nilufer, D., Boyacioglu, D., and Vodovotz, Y. 2008. Functionality of soymilk powder and its components in fresh soy bread. Journal of Food Science. 73: C275-C281.
Omeire, G.C., Umeji, O.F., and Obasi, N.E. 2014. Acceptability of noodles produced from blends of wheat, acha and soybean composite flours. Nigerian Food Journal. 32: 31–37.
Otegbayo, B.O., Samuel, F.O., and Alalade, T. 2013. Functional properties of soy-enriched tapioca. African Journal of Biotechnology. 12: 3583-3589.
Rattanapitigorn, P., Patcharin, R., Khanongnuch, C., Leesawat, P., and Ozimek, L. 2005. Microstructure and adsorption properties of gelatinized-tapioca starch beads modified by freezing and a freeze-drying method. International Journal Agriculture Technology. 1: 267-278.
Song, Y. 2000. Characterization of biopolymers: starch and soy protein. Ph.D. Dissertations. Iowa State University, Capstones, USA.
Stevenson, D.G., Doorenbos, R.K., Jane, J.L., and Ingletta, G.E. 2006. Structures and functional properties of starch from seeds of three soybean (Glycine max (L.) Merr.) varieties. Starch. 58: 509–519.
Takahashi, M., Ishmael, M., Asikin, Y., Hirose, N., Mizu, M., Shikanai, T., Tamaki, H., and Wada, K. 2016. Composition, taste, aroma, and antioxidant activity of solidified noncentrifugal brown sugars prepared from whole stalk and separated pith of sugarcane (Saccharum officinarum L.). Journal of Food Science. 81: c2647-c2655.
Wang, S., Li, C., Copeland, L., Niu, Q., and Wang, S. 2015. Starch retrogradation: A comprehensive review. Comprehensive Reviews in Food Science and Food Safety. 14: 568-585.
Zhang, B., Wang, K., Hasjim, J., Li, E., Flanagan, B.M., Gidley, M.J., and Dhital, S. 2014. Freeze-drying changes the structure and digestibility of b polymorphic starches. Journal of Agricultural and Food Chemistry. 62: 1482−1491.
Zolelmein, A., Movahhed, S., Azizi, M.H., and Ahmadi, C.H. 2020. Assessment of simultaneous addition of sucrose and xanthan effects on the thermal, pasting, and rheological behavior of corn starch. Journal of Texture Studies. 51: 453–463.
OPEN access freely available online
Chiang Mai University Journal of Natural Sciences [ISSN 16851994]
Chiang Mai University, Thailand
https://cmuj.cmu.ac.th
Nattagan Chantagith, Natnaree Katkaew, and Panida Rattanapitigorn*
Division of Food Science and Technology, Faculty of Agro-Industry, Chiang Mai University, Chiang Mai, 50100 Thailand
Corresponding author: Panida Rattanapitigorn, E-mail: panida.r@cmu.ac.th, panidad@yahoo.com
Total Article Views
Editor: Korakot Nganvongpanit,
Chiang Mai University, Thailand
Article history:
Received: July 1, 2021;
Revised: August 18, 2021;
Accepted: August 23, 2021;