 ISSN: 2822-0838 Online

High-Fat Diet Decreases Serum TNF-Alpha and Breast Tumor Area on Benzopyrene Induced Mice (Mus Musculus)
Purwo Sri Rejeki*, Dita Mega Utami, Nabilah Izzatunnisa, Adi Pranoto, Devitya Angielevi Sukarno, and Minidian FasitasariPublished Date : 2021-09-13
DOI : https://doi.org/10.12982/CMUJNS.2021.089
Journal Issues : Number 4, October-December 2021
Abstract This study aims to analyze whether the high-fat diet decreases serum TNF-α and breast tumor area on benzopyrene induced mice (Mus musculus). This study was a true experimental with the randomized posttest-only control group design using 36 female mice (Mus musculus), 3-4 months age, 25 ± 5 grams. Mice were induced with benzopyrene (BZP) subcutaneously with a dose of 0.3mg/20gBB/day for 14 days in the right breast area, then randomly divided into 6 groups, K1 (negative control group, given standard feed), K2 (positive control group, standard feed), K3 (high-fat diet with a ratio of 60% protein, 0% carbohydrate, 30% fat, 10% fiber), K4 (high-fat diet with a ratio of 45% protein, 0% carbohydrate, 45% fat, 10% fiber), K5 (high-fat diet with a ratio of 30% protein, 0% carbohydrate, 60% fat, 10% fiber) and K6 (high-fat diet on day 15 with a ratio of 15% protein, 0% carbohydrate, 75% fat, 10% fiber). The high-fat diet was administered for 28 days. The mean of tumor area delta at K1 (0.00 ± 0.00) mm2, K2 (3.52 ± 1.98) mm2, K3 (27.18 ± 21.23) mm2, K4 (13.19 ± 9.93) mm2, K5 (8.80 ± 1.72) mm2, K6 (10.81 ± 6.55) mm2, and (p=0.001). The mean of TNF-α levels at K1 (56.32 ± 8.25) ng/mL, K2 (65.99 ± 2.82) ng/mL, K3 (70.43 ± 4.61) ng/mL, K4 (58.05 ± 5.80) ng/mL, K5 (54.91 ± 3.27) ng/mL, K6 (59.67 ± 3.63) ng/mL and (P = 0.000). A high-fat diet lowers TNF-α levels and reduces the area of BZP-induced breast tumors. The lowest TNF-α levels and the lowest breast tumor area were found in groups with a fat: protein ratio = 60:30.
Keywords: Benzopyrene induced, Breast tumor area, High-fat diet, Tumor necrosis factor-α
Citation: Rejeki, P.S., Utami, D.M., Izzatunnisa, N., Pranoto,A., Sukarno, D.A., and Fasitasari, M. 2021. A high-fat diet decreases serum TNF-alpha and breast tumor area on benzopyrene induced mice (Mus musculus). CMU J. Nat. Sci. 20(4): e2021089.
INTRODUCTION
The high-fat diet is a diet that produces blood ketones as an energy source. It is well known among people and is used for various purposes such as nonpharmacological therapy for cancer (Klement, 2017; Zick et al., 2018; Weber et al., 2020), weight loss (Paoli, 2014), type 2 diabetes mellitus (Saslow et al., 2017), epilepsy and status epilepticus therapy in children and adults (Nabbout et al., 2011; Williams and Cervenka, 2017) and also improve performance in competitive athletes (Taylor et al., 2019). The high-fat diet provides a hostile environment with cancer cells, thereby causing a better prognosis (Lettieri-Barbato and Aquilano, 2018). The high-fat diet reduces the initiative, progression and metastasis of cancer cells (Zick et al., 2018). But the explanation regarding the mechanism of the high-fat diet on the growth of cancer cells is still not known.
The high-fat diet is currently a new type of dietary trend in Indonesia and the world, but there are still many pros and cons of the effects of the high-fat diet on cancer. Study on the mechanism of the high-fat diet has not been done much, so the clarity is needed to monitor the benefits, side effects and complications caused by high-fat diet (Klement, 2017; Weber et al., 2020). Currently, cancer is a major health problem in the world and Indonesia. GLOBOCAN data states that in 2018 there were 18.1 million new cases with a mortality rate of 9.6 million (GLOBOCAN, 2019). Cancer is the second leading cause of death in the world after cardiovascular disease. In Indonesia, the prevalence of cancer is quite high. Based on the results of the Basic Health Research in 2018, the prevalence of tumors/cancer in Indonesia reached 1.8 per 1,000 population or around 480,000 people. This number increased compared to 2013, which was 1.4 per 1000 population or around 330,000 people (Riskesdas, 2018). According to GLOBOCAN data, the incidence of cancer in Indonesia in 2018 (136.2/100,000 population) ranks 8th in Southeast Asia, whereas in Asia ranks 23rd. The highest incidence rate in Indonesia for women is breast cancer at 42.1 per 100,000 population with an average death of 17 per 100,000 population (GLOBOCAN, 2019). In addition to early detection and treatment, more optimal management is needed, such as supporting therapies that can improve the results of radiotherapy and chemotherapy.
According to the Warburg postulate increased glycolysis induces carcinogenesis. Scientists today also have a similar hypothesis that genetic mutations cause cancer and cancer cells metabolize glucose. Preclinical study data indicate that the insulin pathway is related to the initiation and development of cancer. This pathway is regulated through carbohydrate consumption (Erickson et al., 2017). Interleukin-6 (IL-6), interleukin-8 (IL-8), and serum tumor necrosis factor-alpha (TNF-α) levels can function as biological markers of metastases and tumor invasion because studies have shown a correlation with stage II or III carcinoma and metastases in lymph nodes (Ma et al., 2017). According to Wolczyk et al. (2016) high TNF-α levels are characteristic of many malignant cancers, including breast cancer, and are often associated with cancer cell aggressiveness and poor prognosis. Benzopyre (BZP) is a kind of polycyclic aromatic hydrocarbon (PAH) compound contained in cigarettes. This compound will undergo metabolism in the liver by the cytochrome P4501A1 (CYP1A1) enzyme and produce carcinogenic benzopyrene-7.8-dihydrodiol 9.10-epoxide (BPDE) metabolism which causes mutant cell formation (Irmawati et al., 2018). This compound can enter the body's tissues through the skin or through the mouth by inhalation. Induction of BZP compounds with small doses has a carcinogenic effect. According to some studies, induction of at least 0.24-0.3 mg of BZP per 20 grams of body weight per day for 12- 28 days can cause cancer in induced sites (Anandakumar et al., 2009; Gao et al., 2011; Nansi et al., 2015; Irmawati et al., 2018). The high-fat diet is a diet that uses a ratio of predominantly fat and low carbohydrate energy sources resulting in a state of ketosis in which the body will use the ketone bodies as the primary energy source (van Berkel et al., 2018).
The high-fat diet is assumed to reduce blood glucose levels, so it is expected that there will be a decrease in the growth of cancer cells. The progression of cancer cells can be seen from serum TNF-α levels. This study aims to analyze whether the high-fat diet decreases serum TNF-α levels and breast tumor area on benzopyrene induced mice (Mus musculus). We hypothesized that the high-fat diet can decrease serum TNF- α levels and breast tumor area on benzopyrene induced mice (Mus musculus).
MATERIALS AND METHODS
Animals, diets, and experimental protocol
This study was a true experimental with the randomized posttest-only control group design using 36 female mice (Mus musculus), 3-4 months age, 25 ± 5 grams. Mice were divided into 6 groups randomly. In K1, BZP was not induced, while K2-K6 were induced with BZP subcutaneously as much as 0.3 mg/20gBB/day for 14 days in the right breast area. During D1-14 induction all groups were given a standard diet. D15-32 (28 days) dieting namely K1 (negative control group, given standard feed),K2 (positive control group, standard feed), K3 (high-fat diet with a ratio of 60% protein, 0% carbohydrate, 30% fat, 10% fiber), K4 (high-fat diet with a ratio of 45% protein, 0% carbohydrate, 45% fat, 10% fiber), K5 (high-fat diet with a ratio of 30% protein, 0% carbohydrate, 60% fat, 10% fiber) and K6 (high-fat diet on day 15 with a ratio of 15% protein, 0% carbohydrate, 75% fat, 10% fiber). The study was conducted at the Embryology Laboratory of the Faculty of Veterinary Medicine, Universitas Airlangga within a period of 5 months (July to November 2019). Experimental animals were placed at room temperature 25 ± 2°C with a humidity of 50-60% and the lighting was regulated by a light-dark cycle with the regulation of 12 hours of light and 12 hours of darkness (Anandakumar et al., 2009; Gao et al., 2011; Santos et al., 2019; Pinthong and Suanarunsawat, 2020; Wunjuntuk et al., 2020). Mice cages measuring 30x45x20 cm, made of plastic covered with gauze equipped with a place to eat and drink bottles, each cage is filled with 1 group (6 mice). The feeding and high-fat diet were done at 09.00-10.00 a.m. All research procedures were approved by Faculty of Veterinary Universitas Airlangga Medicine Research Ethics Commission No. 2.KE142.07.2019. The present study followed animal welfare principles in experimental science published in the European Convention for the Protection of Vertebrate Animals.
Data collection
Body weight measurements were performed at the beginning and the end of the post-high-fat diet using a HL-3650 heles digital scale (0-5kg scale). Tumor area measurements were performed at the beginning and end of post high-fat diet using Vernier Caliper (Vernier Caliper Tube 150/0.02mm 536-161 Mitutoyo MT0003767 Include PPN). Measurement of blood ketone levels using Abbott Freestyle Optium Neo Blood Glucose and Ketones. Measurement of ketone levels requires a relatively small blood volume, i.e. 0.6-1.5 µL/test taken from the tail vein (Sussman et al., 2013; Pinthong and Suanarunsawat, 2020). Measurement of ketone levels was carried out 24 hours after the last high-fat diet was given.
Blood was drawn from the left ventricle of experimental animals as much as 1 ml. Blood sampling was performed 24 hours after the last high-fat diet is given. Blood was centrifuged for 10 minutes at 3000 rpm. The serum was separated and stored at -80°C for analysis of TNF-α levels the following day. Measurement of TNF-α levels using the Enzyme-Linked Immunosorbent Assay (ELISA) BT-E0117Mo kit (Biossay Technology Laboratory, Inc., Shanghai, China, 2019) with a standard curve range of 5-1000 ng/L and TNF-α sensitivity level in the kit 2.49 ng/L.
Statistical analysis
The statistical analysis was using the Social Science (SPSS) Statistics for Windows, version 16 (SPSS Inc., Chicago, IL, USA). The normality test uses the Shapiro-Wilk test, while the homogeneity test uses the Levene test. Different test using One way-ANOVA and continued with Least Significant Difference (LSD) post hoc test. Linear correlation with Pearson product-moment model. All data is displayed with mean ± standard deviation (SD). All statistical analyzes used a significant level (P <0.05).
RESULTS
The mean analysis results of initial and final body weight after the high-fat diet can be seen in Figure 1.
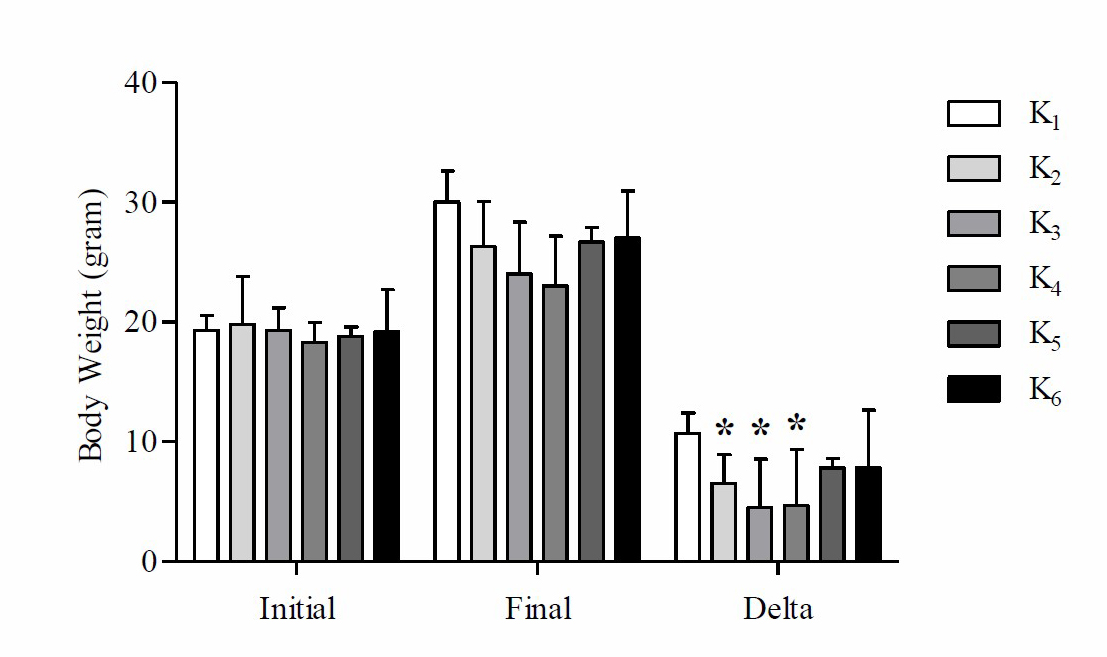
Figure 1. Mean initial, final and Δ (delta) body weight of mice on high-fat diet
Note: *Significant vs negative control group (K1) P
Based on these data, it is found that the mean delta body weight of mice at K1 is higher compared to K2, K3, K4, K5 and K6. Based on One way-ANOVA test results showed that there were significant differences in the mean delta weight of mice (P =0.039). Based on the LSD post hoc test results showed that there were significant differences in the weight difference between K2 with K1 (P =0.045), K3 with K1 (P =0.004) and K4 with K1 (P =0.005), while K1 with K5 (P =0.164), K1 with K6 (P =0.164), K2 with K3 (P =0.322), K2 with K4 (P =0.364), K2 with K5 (P =0.507), K2 with K6 (P =0.507), K3 with K4 (P =0.934), K3 with K5 (P =0.104), K3 with K6 (P =0.104), K4 with K5 (P =0.121), K4 with K6 (P =0.121) and K5 with K6 (P =1,000) there was no significant difference (P >0.05). The results of the average analysis of ketone levels after the high-fat diet can be seen in Figure 2.
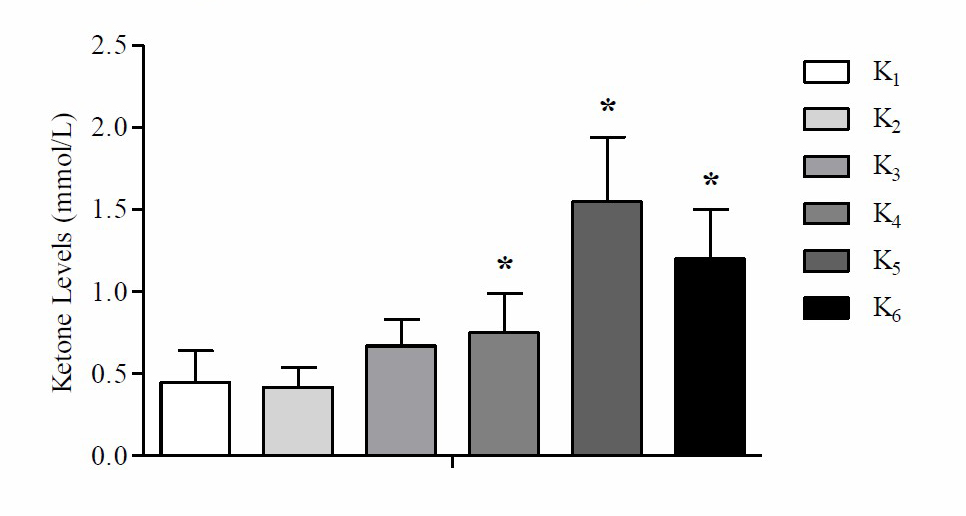
Figure 2. Mean of ketone levels after high-fat diet treatment
Note: *Significant vs negative control group (K1) p
Based on these data, it is found that the mean ketone levels at K5 are higher compared to K1, K2, K3, K4 and K6. Based on One way-ANOVA test results there were significant differences in the average ketone levels in mice (P <0.05). The results of the analysis of the mean tumor area between the initial and final tumors area after the administration of the high-fat diet can be seen in Table 1.
Table 1. Mean of initial and final tumor areas after the treatment of the high-fat diet.
|
|
Tumor Areas (mm2) |
|
One way-ANOVA Δ (P-values) |
|
|
Group |
Initial |
Final |
delta (Δ) |
|
|
K1 |
0.00 ± 0.00 |
0.00 ± 0.00 |
0.00 ± 0.00a |
|
|
K2 |
0.35 ± 0.32 |
3.87 ± 2.27 |
3.52 ± 1.98a |
|
|
K3 |
0.65 ± 0.33 |
27.83 ± 20.98 |
27.18 ± 21.23b |
0.001 |
|
K4 |
0.63 ± 0.59 |
13.83 ± 10.19 |
13.19 ± 9.93a |
|
|
K5 |
2.17 ± 2.86 |
9.80 ± 1.83 |
8.80 ± 1.72a |
|
|
K6 |
1.19 ± 1.09 |
12.00 ± 7.54 |
10.81 ± 6.55a |
|
Note: Different superscript shows significant differences in the LSD post hoc test with (P <0.05). K1 (negative control group, given standard feed), K2 (positive control group, standard feed), K3 (high-fat diet with a ratio of 60% protein, 0% carbohydrate, 30% fat, 10% fiber), K4 (high- fat diet with a ratio of 45% protein, 0% carbohydrate, 45% fat, 10% fiber), K5 (high-fat diet with a ratio of 30% protein, 0% carbohydrate, 60% fat, 10% fiber) and K6 (high-fat diet on day 15 with a ratio of 15% protein, 0% carbohydrate, 75% fat, 10% fiber).
Based on these data, it is found that the mean delta area of mice tumors at K3 is wider than K1, K2, K4, K5 and K6. Based on the One way-ANOVA test results there were significant differences in the mean delta area of the tumor in mice (P <0.05). The results of a comparative analysis of tumor area with body weight can be seen in Table 2.
Table 2. Comparison mean of final tumor area and final body weight.
|
Group |
Final Tumor Areas (mm2) |
Body Weight (gram) |
TA/BW |
One way-ANOVA TA/BW (P-values) |
|
K1 |
0.00 ± 0.00 |
30.00 ± 2.61 |
0.00 ± 0.00a |
|
|
K2 |
3.87 ± 2.27 |
26.33 ± 3.72 |
0.15 ± 0.09a |
|
|
K3 |
27.83 ± 20.98 |
24.00 ± 4.34 |
1.09 ± 0.68bc |
0.000 |
|
K4 |
13.83 ± 10.19 |
23.00 ± 4.19 |
0.62 ± 0.48b |
|
|
K5 |
9.80 ± 1.83 |
26.67 ± 1.21 |
0.36 ± 0.07a |
|
|
K6 |
12.00 ± 7.54 |
27.00 ± 3.95 |
0.46 ± 0.28b |
|
Note: Different superscript shows significant differences in the LSD post hoc test with (P <0.05). TA: tumor area; BW: body weight. K1 (negative control group, given standard feed), K2 (positive control group, standard feed), K3 (high-fat diet with a ratio of 60% protein, 0% carbohydrate, 30% fat, 10% fiber), K4 (high-fat diet with a ratio of 45% protein, 0% carbohydrate, 45% fat, 10% fiber), K5 (high-fat diet with a ratio of 30% protein, 0% carbohydrate, 60% fat, 10% fiber) and K6 (high-fat diet on day 15 with a ratio of 15% protein, 0% carbohydrate, 75% fat, 10% fiber).
Based on these data, it is found that the mean comparison of final tumor area with final body weight at K3 is higher compared to K1, K2, K4, K5 and K6. Based on the One way-ANOVA test results there were significant differences in the mean of the final tumor area with body weight in mice (P <0.05). The results of the mean analysis of TNF-α levels after the administration of the high-fat diet can be seen in Figure 3.
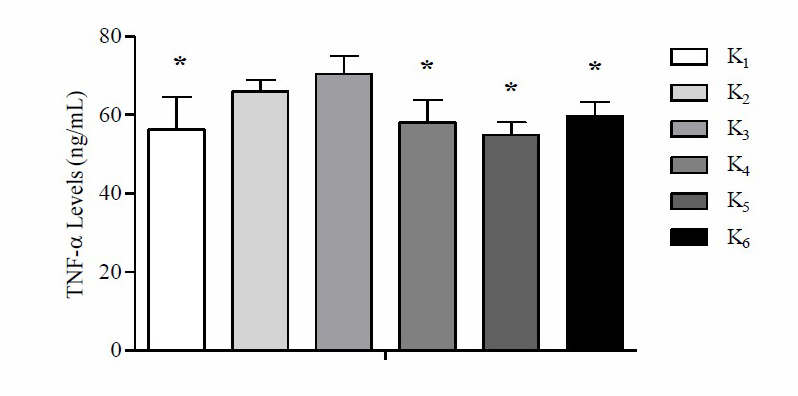
Figure 3. Mean TNF-α levels in each group after the high-fat diet
Note: *Significant vs. positive control group, standard feed (K2), and high-fat diet group with a ratio of 60% protein, 0% carbohydrate, 30% fat, 10% fiber (K3) P
Based on these data, it is found that the average level of TNF-α at K3 is higher than K1, K2, K4, K5 and K6. Based on One way-ANOVA test results there was a significant difference in the mean TNF-α levels (P =0.000). Based on the LSD post hoc test results there were significant differences in the mean TNF-α levels between K1 with K2 (P =0.002), K4 with K2 (P =0.011), K5 with K2 (P =0.001), K6 with K2 (P =0.039), K1 with K3 (P =0.000), K4 with K3 (P =0.000), K5 with K3 (P =0.000), K6 with K3 (P =0.001), while K1 with K4 (P =0.559), K1 with K5 (P =0.636), K1 with K6 (P =0.261), K2 with K3 (P =0.140), K4 with K5 (P =0.294), K4 with K6 (P =0.583) and K5 with K6 (P =0.115) did not show signif.
Table 3. Comparison mean of TNF-α levels with final body weight.
|
Group |
TNF-α Levels (ng/mL) |
Body Weight (gram) |
TNF-α/BW |
One way-ANOVA TNF-α/BW (P-values) |
|
K1 |
0.00 ± 0.00 |
30.00 ± 2.61 |
1.89 ± 0.35a |
|
|
K2 |
3.87 ± 2.27 |
26.33 ± 3.72 |
2.55 ± 0.38b |
|
|
K3 |
27.83 ± 20.98 |
24.00 ± 4.34 |
3.03 ± 0.68b |
0.004 |
|
K4 |
13.83 ± 10.19 |
23.00 ± 4.19 |
2.62 ± 0.65b |
|
|
K5 |
9.80 ± 1.83 |
26.67 ± 1.21 |
2.06 ± 0.19a |
|
|
K6 |
12.00 ± 7.54 |
27.00 ± 3.95 |
2.26 ± 0.47a |
|
Note: Different superscript shows significant differences in the LSD post hoc test with (P <0.05). TNF-α: tumor necrosis factor alpha; BW: body weight. K1 (negative control group, given standard feed), K2 (positive control group, standard feed), K3 (high-fat diet with a ratio of 60% protein, 0% carbohydrate, 30% fat, 10% fiber), K4 (high-fat diet with a ratio of 45% protein, 0% carbohydrate, 45% fat, 10% fiber), K5 (high- fat diet with a ratio of 30% protein, 0% carbohydrate, 60% fat, 10% fiber) and K6 (high-fat diet on day 15 with a ratio of 15% protein, 0% carbohydrate, 75% fat, 10% fiber).
Based on these data, it is found that comparison mean of TNF-α with final body weight at K3 is higher compared to K1, K2, K4, K5 and K6. Based on One way-ANOVA test results there was a significant difference in mean placing TNF-α levels with final body weight (P =0.004). The parametric analysis by Pearson’s product-moment linear correlation shows that the tumor areas were significantly and negatively correlated with the body weight (r = 0.482, P ≤ 0.01) and TNF-α levels (r = 0.447, P ≤ 0.01). By contrast, the tumor areas were negatively associated with ketone levels (r = –0.352, P ≤ 0.05) (Figure 4).
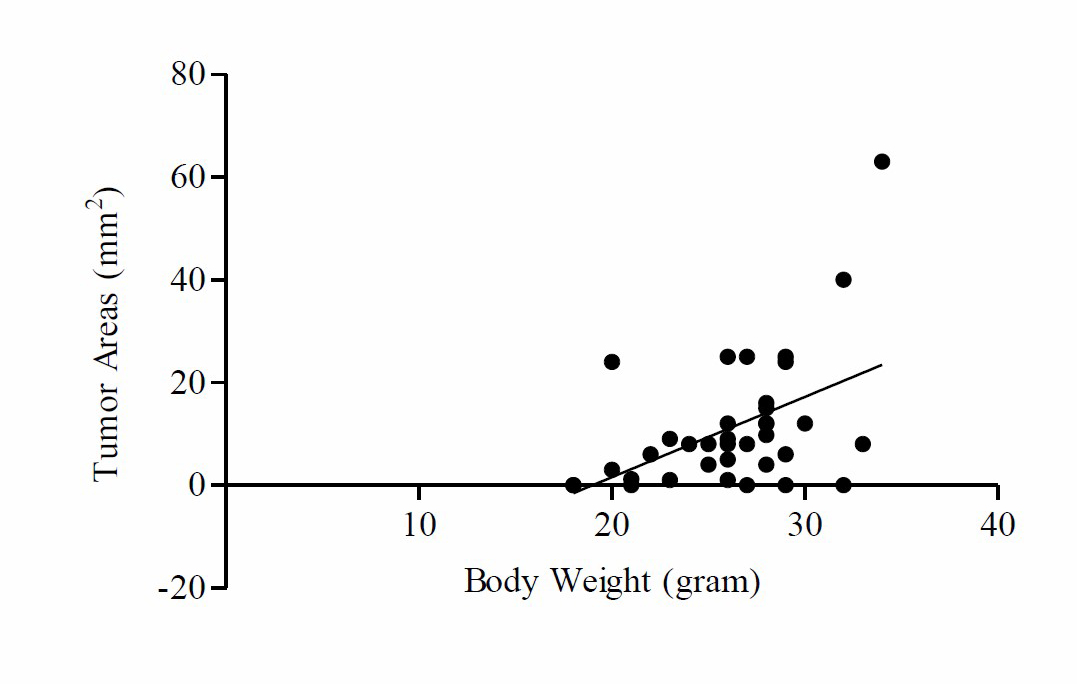
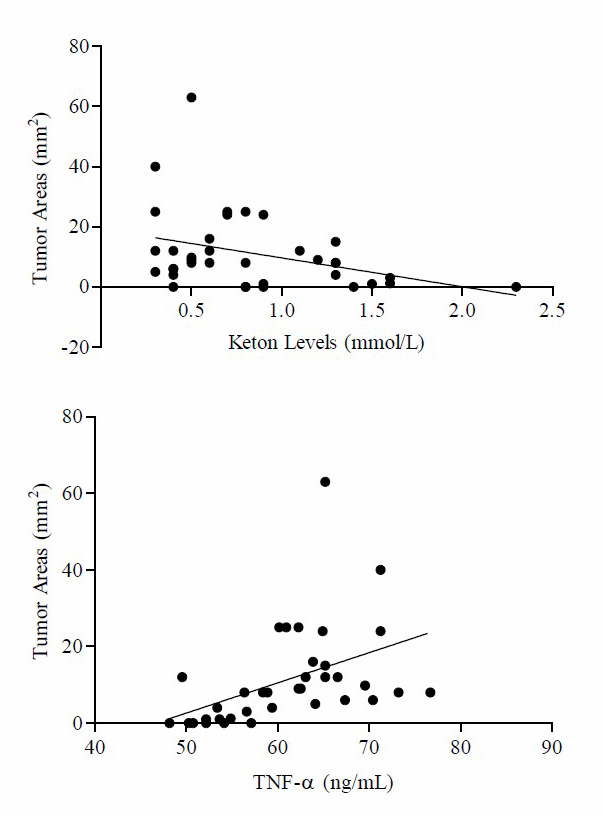
Figure 4. Tumor areas were positively associated with body weight, TNF-α levels. Tumor areas were negatively associated with keton levels. Pearson correlation coefficients (r) and p-values are shown in each graph.
DISCUSSION
The high-fat diet is a diet that produces ketones in the blood as an energy source and can be used as a nonpharmacological therapy for cancer (Klement, 2017; Zick et al., 2018), lose weight (Paoli, 2014), type 2 diabetes mellitus (Saslow et al., 2017), epilepsy and status epilepticus therapy in children and adults (Williams and Cervenka, 2017), also improve performance in competitive athletes (Taylor et al., 2019). The administration of the high-fat diet has been shown to increase blood ketone levels in both rats and mice (Meidenbauer et al., 2014; Nandivada et al., 2016; Roberts et al., 2017). Based on the results of the present study showed that the mean ketone levels at K5 were higher compared to K1, K2, K3, K4 and K6. The One way-ANOVA test results showed that there were significant differences in the ketone levels mean in mice (P <0.05). These results are in line with the results of a study conducted by Kephart et al. (2017) which concluded that the administration of the high-fat diet with a composition of 23% protein, 10% carbohydrate and 67% fat significantly increased serum β-ketones or β-hydroxybutyrate compared to the control group. Likewise, research conducted by Nandivada et al. (2016) concluded that the administration of the high-fat diet with a composition of 90.5% fat, 9.1% protein, and 0.4% carbohydrate significantly increased serum beta-hydroxybutyrate levels in mice. As well as the results of a study conducted by Sussman et al. (2013) which concluded that the administration of the high-fat diet with a composition of 67.4% fat, 0.6% carbohydrate, and 15.3% protein wt/wt for 30 days significantly increased ketone levels compared with controls. The study conducted by Roberts et al. (2017) also found similar results that the administration of the high-fat diet (89% kcal of fat) for 13 days and 26 days significantly increased β-hydroxybutyrate compared with the control group and the low-carbohydrate diets group. Increased levels of ketones in K5 may be caused by the effect of the high-fat diet. The high-fat diet causes a decrease in blood glucose levels, thereby increasing lipolysis (Allen et al., 2014). Increased lipolysis will continuously cause an increase in ketone production in the blood to be used as an energy source in all tissues (van Berkel et al., 2018; Weber et al., 2020).
During the high-fat diet the brain will look for alternative energy sources that come from the excess production of acetyl-CoA, the ketone bodies (Soldati et al., 2018; Weber et al., 2020). Ketone bodies consist of acetoacetate (AcAc), β-hydroxybutyrate (βHB) and acetone (Weber et al., 2020). Ketone bodies are produced in the liver by the breakdown of fat or ketosis (Page et al., 2009). Ketosis is a physiological mechanism that can be an indicator of decreased body fat (Kephart et al., 2017). Under the normal diet, ketone bodies concentrations are less than 0.3 mmol/L and will not be used as an energy source by the brain until this concentration reaches 4 mmol/L, the same as glucose concentration. At this concentration, the ketone body will be used as an energy source by all tissues. The maximum concentration of ketone bodies in individuals on a high-fat diet will reach 7-8 mmol/L and without accompanied by changes in blood pH (pH=7.4). Ketosis in the high-fat diet is still classified as physiological ketosis in contrast to diabetic ketoacidosis which has a blood ketone level reaching 20 mmol/L and a decrease in blood pH to
The high-fat diet causes a decrease in blood glucose, insulin, and insulin-like growth factor (IGF-1) which has the potential to reduce cancer cell proliferation (Stock et al., 2009; Weber et al., 2018) reduce the development of cancer cells and increase normal cell resistance (Erickson et al., 2017). The high-fat diet causes cancer cells to use more glycolysis compared to oxidative phosphorylation to produce adenosine triphosphate (ATP) (Weber et al., 2018). The high-fat diet can cause Protein Kinase B (Akt) to induce resistance to apoptosis, cause changes in cancer cell metabolism, decrease beta-oxidation and increase lipid synthesis in the cytosol (Rose and Vona-Davis, 2012). Therefore, the administration of the high-fat diet can provide a hostile environment with cancer cells, which causes a better prognosis (Lettieri-Barbato and Aquilano, 2018), can reduce initiation, progression and metastasis from cancer cells (Zick et al., 2018).
Tumor necrosis factor alpha (TNF-α) is a pleiotropic cytokine (has various effects on various cells) produced mainly by active macrophages and other immune cell types such as T lymphocytes, NK cells and neutrophils (Zhou et al., 2016). TNF-α can function as a biomarker of metastases and tumor invasion, because from the results of previous studies there was a correlation with stage II or III carcinoma and metastasis in lymph nodes (Ma et al., 2017). According to Wolczyk et al. (2016) high levels of TNF-α are characteristic of many malignant cancers, including breast cancer and are often associated with cancer cell aggressiveness and poor prognosis. Based on the results of the study showed that the average levels of TNF-α at K5 were lower than those of K1, K2, K3, K4 and K6. Based on One way-ANOVA test results there were significant differences in the mean TNF-α levels in mice (P <0.05). These results are in line with the previous study conducted by Dupuis et al. (2015) concluded that the administration of the high-fat diet for 14 days significantly reduced TNF-α levels compared to the control group in mice. As well as the results of a study conducted by Vizuete et al. (2013) which concluded that the administration of the high-fat diet for 8 weeks reduced TNF-α levels compared to the ketogenic group with increased omega-3 and control in rats. In the study conducted by Nandivada et al. (2016) showed that the administration of a high-fat diet with a composition of 90.5% fat, 9.1% protein and 0.4% carbohydrate reduced post-absorbptive serum TNF-α levels compared with controls (12.5% fat, 10% protein and 77.5% carbohydrate) in mice. However, these results differ from the postpandrial serum TNF-α levels which showed a significant increase in TNF-α levels in the high-fat diet group compared to the control group. The results of a study conducted by Santos et al. (2019) also concluded that the administration of a high-fat diet with a composition of 24.2% carbohydrate, 60.9% fat, and 14.9% protein for 6 weeks increased TNF-α levels compared with controls in mice. The contrast result of this study may due to a different composition of high-fat diet. In this study the lowest level of TNF-α reduction occurred in the high-fat diet with a composition of 30% protein, 0% carbohydrate, 60% fat, 10% fiber. This is because the high-fat diet provides a neuroprotective effect that can reduce cell injury and modify inflammation in the brain. The high-fat diet triggers low levels of lymphocytes or polymorphonuclear cells so the cells ability to synthesize proinflammatory cytokines is also reduced. In addition, the high-fat diet also decreases the synthesis of arachidonic acid and n-6 polyunsaturated fatty acids (PUFA) which are precursors for the synthesis of proinflammatory eicosanoids thereby causing a decrease in TNF-α.
The inflammatory process has a major role in the pathogenesis of breast cancer. The previous study conducted by Kamel et al. (2012) has proven that chronic inflammation is associated with breast cancer recurrence and increased levels of inflammatory biological markers associated with reduced ability of breast cancer patients to survive. Kamel et al. (2012) states that TNF-α is the most widely expressed inflammatory cytokine in breast cancer. Likewise, according to Malik et al. (2018) TNF- α has been shown to increase breast cancer cell growth. The number of cells expressing TNF-α in mammary carcinoma has been known to be related to tumor grade and plays a role in metastasis in mammary carcinoma. A previous study by Malik et al. (2018) obtained results if benzopyrene can activate the inflammatory pathway which includes TNF-α, cyclooxygenase-2 (COX-2) and vascular endothelial growth factor A (VEGF-A) in both types of mammary cell lines. TNF-α is known to increase the activity of protein kinase C (PKC-α) and protein tyrosin kinase to activate nuclear factor-κB (NFκB) as a COX-2 promoter which is a marker of aggressiveness and poor prognosis in breast cancer. However, in the type of breast cancer cell michigan cancer foundation-7 (MCF- 7), TNF-α regulates COX-2 through a path that is free of NFκB. The administration of the high-fat diet causes the replacement of the main fuel cell metabolism from glucose to ketones. Normal cells can adapt to this change, but cancer cells which are highly dependent on glucose as the main fuel, are unable to metabolize ketones (Aponte et al., 2018). If glucose levels decrease, the inflammatory response caused by cancer cells also decreases which marked by low TNF-α levels as a biological marker of cancer cell malignancy.
The results of the present study showed that after the induction of BZP at a dose of 0.3mg/20gBB/day for 14 days subcutaneously on the right breast of mice, found a tumor in the positive control group and the high-fat diet group, whereas in the negative control group induced with oleum olivarum there is no tumor. This is in line with the results of studies conducted by Nansi et al. (2015) and Liangan et al. (2015) which concluded that induction of BZP at a dose of 0.3mg/20gBB/day for 14 days subcutaneously can induce breast cancer in mice. Malik et al. (2018) states that exposure to BZP has several effects, which can cause metabolic activation of deoxyribonucleic acid (DNA)-damaging species and elicit various biological responses such as activation of aryl hydrocarbon receptors (AhR) which cause changes in gene expression. These various biological responses then initiate carcinogenesis. BZP is metabolized by Cytochrome P450 Family 1 Subfamily A Polypeptide 1 (CYP1A1), Cytochrome P450 Family 1 Subfamily B Member 1 (CYP1B1) and Epoxide Hydrolase (EH) to Benzo(a)pyrene 7,8-dihydrodiol-9,10-epoxide BPDE) which is a reactive carcinogen. Exposure to BZP increases the risk of breast cancer because of the expression of CYP1A1 and CYP1B1 in breast tissue (Akram, 2012).
Based on the present study the mean delta area of mice tumors at K3 was wider than K1, K2, K4, K5 and K6. The One way-ANOVA test results showed that there were significant differences in the mean delta area of the tumor in mice (P <0.05). These results are different from the results of research conducted by Allen et al. (2014) which concluded that the administration of the high-fat diet reduced tumor growth and improved the survival of experimental animal models with glioma malignancy, colon cancer, gastric cancer and prostate cancer. The previous study by Zhou et al. (2007) also concluded that mice with astrocytoma and glioma treated with a high-fat diet and calorie restriction for 45 days had smaller astrocytoma and glioma tumor sizes compared to the mice on the standard diet without calorie restriction. The results showed that giving a high-fat diet for 4 weeks had not had a significant effect on reducing tumor area compared to the negative control group and the positive control group who received standard feed. This difference in results is probably also due to the fact that after benzopyrene induction, there was a significant difference between the intervention group and the control group.
CONCLUSION
Based on the results of this study we concluded a high-fat diet lowers TNF-α levels and reduces the breast tumor area on benzopyrene induced mice (Mus musculus). The lowest TNF-α levels and the lowest breast tumor area were found in groups with a fat: protein ratio = 60:30.
ACKNOWLEDGMENTS
This study is supported by Fundamental Research Program Ministry of Research, Technology and Higher Education, Indonesia, under Grant Number: 4/E1/KP.PTNBH/2019 and 543/UN3.14/LT/2019.
AUTHOR CONTRIBUTIONS
Conceived and designed the experiments: PSR. Performed the experiments: PSR DMU NI. Analyzed the data: AP. Contributed reagents/materials/analysis tools: DAS MF. Wrote the paper: PSR DMU NI AP DAS MF.
CONFLICT OF INTEREST
The authors declare that they have no competing interests.
REFERENCES
Akram, M. 2012. Effects of Benzo(a)pyrene on Human Breast Cancer Cell Lines. Thesis. University of Eastern Finland.
Allen, B.G., Bhatia, S.K., Anderson, C.M., Eichenberger-Gilmore, J.M., Sibenaller, Z.A., Mapuskar, K.A., Schoenfeld, J.D., Buatti, J.M., Spitz, D.R. and Fath, M.A. 2014. Ketogenic diets as an adjuvant cancer therapy: History and potential mechanism. Redox Biol, 2: 963-970.
Anandakumar, P., Kamaraj, S., Ramakrishnan, G., Jagan, S. and Devaki, T. 2009. Chemopreventive Task of Capsaicin against Benzo(a)pyrene-induced Lung Cancer in Swiss Albino Mice. Basic & Clinical Pharmacology & Toxicology, 104: 360-365.
Aponte, Y.R.T., Calderon, V. and Gonzales, M.J. 2018. The Kotegenic Diet and Cancer. Archives of Oncology and Cancer Therapy, 1: 48-53.
Azar, S.T., Beydoun, H.M. and Albadri, M.R. 2016. Benefits of Ketogenic Diet for Management of Type Two Diabetes: A Review. Obesity & Eating Disorders, 2: 1-4. Basic Health Research (Riskesdas). 2018. National Report on Basic Health Research. Jakarta: Ministry of Health Indonesia. Available at: http://www.kesmas.kemkes.go.id.
Dupuis, N., Curatolo, N., Benoist, J-F. and Auvin, S. 2015. Ketogenic diet exhibits anti- inflammatory properties. Epilepsia, 56: e95-e98.
Erickson, N., Boscheri, A., Linke, B. and Huebner, J. 2017. Systematic review: isocaloric ketogenic dietary regimes for cancer patients. Med Oncol, 34: 72.
Fukao, T., Lopaschuk, G.D. and Mitchell, G.A. 2004. Pathways and control of ketone body metabolism: on the fringe of lipid biochemistry. Prostaglandins Leukot Essent Fatty Acids, 70: 243-251.
Gao, M., Li, Y., Sun, Y., Shah, W., Yang, S., Wang, Y. and Long, J. 2011. Benzo[a]pyrene Exposure Increases Toxic Biomarkers and Morphological Disorders in Mouse Cervix. Basic & Clinical Pharmacology & Toxicology, 109: 398-406.
GLOBOCAN. 2019. Indonesia Summary Statistics 2018 available from http://gco.iarc.fr/today/data/factsheets/populations/360-indonesia-factsheets.pdf.
Irmawati, A., Jasmin, N. and Sidarningsih. 2018b. The effect of moderate exercise on the elevation of Bax/Bcl-2 ratio in oral squamous epithelial cells induced by benzopyrene. Veterinary world, 11: 177-180.
Kamel, M., Shouman, S., El-Merzebany, M., Kilic, G., Veenstra, T., Saeed, M., Wagih, M., Diaz-Arrastia, C., Patel, D. and Salama, S. 2012. Effect of tumour necrosis factor-alpha on estrogen metabolic pathways in breast cancer cells. Journal of Cancer, 3: 310-321.
Kephart, W.C., Mumford, P.W., Mao, X., Romero, M.A., Hyatt, H.W., Zhang, Y., Mobley, C.B., Quindry, J.C., Young, K.C., Beck, D.T., et al. 2017. The 1-week and 8-month effects of a ketogenic diet or ketone salt supplementation on multi-organ markers of oxidative stress and mitochondrial function in rats. Nutrients, 9: 1-22.
Klement, R.J. 2017. Beneficial effects of ketogenic diets for cancer patients: a realist review with focus on evidence and confirmation. Medical Oncology, 34:132.
Lettieri-Barbato, D. and Aquilano, K. 2018. Pushing the limits of cancer therapy: the nutrient game. Frontiers in oncology, 8: 148.
Liangan, R., Kairupan, C. and Durry, M. 2015. The effect of giving galangal (alpinia galanga) extract on the histology of mice (mus musculus) breast induced by benzo(a)pyrene. Jurnal e-Biomedik (eBm), 3: 480–485.
Ma, Y., Ren, Y., Dai, Z-J., Wu, C-J., Ji, Y-H. and Xu. J. 2017. IL-6, IL-8 and TNF-α levels correlate with disease stage in breast cancer patients. Adv Clin Exp Med, 26: 421-426.
Malik, D-S., David, R.M. and Gooderham, N. 2018. Mechanistic evidence that benzo[a]pyrene promotes an inflammatory microenvironment that drives the metastatic of human mammary cells. Archives of Taxicology, 92: 3223-3239.
Meidenbauer, J.J., Ta, N. and Seyfried, T.N. 2014. Influence of a ketogenic diet, fish- oil, and calorie restriction on plasma metabolites and lipids in C57BL/6J mice. Nutr Metab (Lond), 11:23.
Nabbout, R., Vezzani, A., Dulac, O. and Chiron, C. 2011. Acute encephalopathy with inflammation-mediated status epilepticus. Lancet Neurol, 10: 99-108.
Nandivada, P., Fell, G.L., Pan, A.H., Nose, V., Ling, P-R., Bistrian, B.R. and Puder, M. 2016. Eucaloric ketogenic diet reduces hypoglycemia and inflammation in mice with endotoxemia. Lipids, 51: 703-714.
Nansi, E.M., Durry, M.F. and Kairupan, C. 2015. Histopathological description of mice (mus musculus) breast induced by benzo(a)pyrene and given with yellow extract (curcuma longa L.). Jurnal e-Biomedik (eBm), 3: 510-515.
Page, K.A., Williamson, A., Yu, N., McNay, E.C., Dzuira, J., McCrimmon, R.J. and Sherwin, R.S. 2009. Medium-chain fatty acids improve cognitive function in intensively treated type 1 diabetic patients and support in vitro synaptic transmission during acute hypoglycemia. Diabetes, 58: 1237-1244.
Paoli, A. 2014. Ketogenic diet for obesity: friend or foe?. International journal of environmental research and public health, 11: 2092-2107.
Pinthong, W. and Suanarunsawat, T. 2020. Tea seed oil alleviates metabolic derangement and oxidative stress in rats fed with high fat and high fructose diet. CMU J. Nat. Sci. 19: 665-683.
Roberts, M.N., Wallace, M.A., Tomilov, A.A., Zhou, Z., Marcotte, G.R., Tran, D., Perez, G., Gutierrez-Casado, E., Koike, S., Knotts, T.A., et al. 2017. A ketogenic diet extends longevity and healthspan in adult mice. Cell Metabolism, 26: 539-546.
Rose, D.P. and Vano-Davis, L. 2012. The cellular and molecular mechanisms by which insulin influences breast cancer risk and progession. Endocr Relat Cancer, 19: R225- R241.
Santos, E.W., Oliveira, D.C., Hastreiter, A., Silva, G.B., Beltran, J.S.O., Rogero, M.M., Fock, R.A. and Borelli, P. 2019. Short-term high-fat diet affects macrophages inflammatory response, early signs of a long-term problem. Brazilian Journal of Pharmaceutical Sciences, 55: e17561.
Saslow, L.R., Mason, A.E., Kim, S., Goldman, V., Ploutz-Snyder, R., Bayandorian, H., Daubenmier, J., Hecht, F.M. and Moskowitz, J.T. 2017. An online intervention comparing a very low-carbohydrate ketogenic diet and lifestyle recommendations versus a plate method diet in overweight individuals with type 2 diabetes: a randomized controlled trial. Journal of medical Internet research, 19: e36.
Soldati, L., Di Renzo, L., Jirillo, E., Ascierto, P.A., Marincola, F.M. and De Lorenzo, A. 2018. The influence of diet on anti‑cancer immune responsiveness. Journal of Translational Medicine, 16: 1-18.
Stocks, T., Rapp, K., Bjørge, T., Manjer, J., Ulmer, H., Selmer, R., Lukanova, A., Johansen, D., Concin, H., Tretli, S., et al. 2009. Blood glucose and risk of incident and fatal cancer in the metabolic syndrome and cancer project (me-can): analysis of six prospective cohorts. PLoS medicine, 6: e1000201.
Sussman, D., van Eede, M., Wong, M.D., Adamson, X.L. and Henkelman, M. 2013. Effects of a ketogenic diet during pregnancy on embryonic growth in the mouse. BMC Pregnancy and Childbirth, 13:109. http://www.biomedcentral.com/1471-2393/13/109.
Taylor, M.K., Swerdlow, R.H., Burns, J.M. and Sullivan, D.K. 2019. An experimental ketogenic diet for alzheimer disease was nutritionally dense and rich in vegetables and avocado. Current developments in nutrition, 3: nzz003.
van Berkel, A.A., Ijff, D.M. and Verkuyl, J.M. 2018. Cognitive benefits of the ketogenic diet in patients with epilepsy: A systematic overview. Epilepsy Behav, 87: 69-77.
Vizuete, A.F., de Souza, D.F., Guerra, M.C., Batassini, C., Dutra, M.F., Bernardi, C., Costa, A.P. and Gonçalves, C-A. 2013. Brain changes in BDNF and S100B induced by ketogenic diets in Wistar rats. Life Sciences, 92: 923–928.
Weber, D.D., Aminazdeh‑Gohari, S. and Kofler, B. 2018. Ketogenic diet in cancer therapy. Aging, 10: 164-165.
Weber, D.D., Aminzadeh-Gohari, S., Tulipan, J., Catalano, L., Feichtinger, R.G. and Kofler, B. 2020. Ketogenic diet in the treatment of cancer e Where do we stand?. Molecular Metabolism, 33: 102-121.
Williams, T.J. and Cervenka, M.C. 2017. The role for ketogenic diets in epilepsy and status epilepticus in adults. Clinical neurophysiology practice, 2: 154-160.
Wisnu, G.N.P.P., Khairun N.B. and Riyan W. 2017. Ketogenic diet: a promising non- pharmacological therapy for epilepsy. Jurnal Kedokteran Universitas Negeri Lampung, 7: 118-122.
Wolczyk, D., Zaremba-Czogalla, M., Hryniewicz-Jankowska, A., Tabola, R., Grabowski, K., Sikorski, A. F. and Augoff, K. 2016. TNF-α promotes breast cancer cell migration and enhances the concentration of membrane-associated proteases in lipid rafts. Cellular oncology (Dordrecht), 39: 353-363.
Wunjuntuk, K., Chareonkiatkul, S. and Kettawan, A. 2020. Parboiled Germinated Brown Rice Decreases Inflammatory Cytokines Levels in Various Regions of Brain in Rats Induced by Carbon Tetrachloride. CMU J. Nat. Sci. 19(2): 265-279. https://doi.org/10.12982/CMUJNS.2020.0018.
Zhou, S., Kachhap, S., Sun, W., Wu, G., Chuang, A., Poeta, L., Grumbine, L., Mithani, S.K., Chatterjee, A., Koch, W., Westra W.H., Maitra, A., Glazer, C., Carducci, M., Sidransky, D., McFate, T., Verma, A. and Califano, J.A. 2007. Frequency and phenotypic implications of mitochondrial DNA mutations in human squamous cell cencers of the head and neck. Proceedings of the National Academy of Science of the United States of America, 104(18): 7540-7545.
Zhou, J., Liu, B., Liang, C., Li, Y. and Song, Y-H. 2016. Cytokine signaling in skeletal muscle wasting. Trends in Endocrinology & Metabolism, 27: 335-347.
Zick, S.M., Snyder, D. and Abrams, D.I. 2018. Pros and cons of dietary strategies popular among cancer patients. Oncology (Williston Park), 32: 542-547.
OPEN access freely available online
Chiang Mai University Journal of Natural Sciences [ISSN 16851994]
Chiang Mai University, Thailand
Purwo Sri Rejeki1,2,3,*, Dita Mega Utami4, Nabilah Izzatunnisa4, Adi Pranoto5, Devitya Angielevi Sukarno6, and Minidian Fasitasari7
1 Department of Physiology, Faculty of Medicine Universitas Airlangga, Surabaya, Indonesia
2 Sport Health Science, Faculty of Medicine Universitas Airlangga, Surabaya, Indonesia
3 Basic Medical Science, Faculty of Medicine Universitas Airlangga, Surabaya, Indonesia
4 Medical Program, Faculty of Medicine Universitas Airlangga, Surabaya, Indonesia
5 Medical Science, Faculty of Medicine Universitas Airlangga, Surabaya, Indonesia
6 Laboratory of Physiology, Faculty of Medicine Universitas Surabaya, Surabaya, Indonesia
7 Faculty of Medicine, Universitas Islam Sultan Agung Semarang, Semarang, Indonesia
Corresponding author: Purwo Sri Rejeki, E-mail:purwo-s- r@fk.unair.ac.id; purwo_faal@yahoo.com
Total Article Views
Editor: Korakot Nganvongpanit,
Chiang Mai University, Thailand
Article history:
Received: April 14, 2021;
Revised: July 31, 2021;
Accepted: August 9, 2021;