 ISSN: 2822-0838 Online

Analysis of Land Surface Temperature (LST) in Bur Ni Geureudong Geothermal Field, Aceh, Indonesia Using Landsat 8 OLI / TIRS Images
Deviyani R. Putri, Nazli Ismail*, Rinaldi Idroes, Syamsul Rizal, Syahrun Nur, and Muhammad NandaPublished Date : 2021-09-13
DOI : https://doi.org/10.12982/CMUJNS.2021.084
Journal Issues : Number 4, October-December 2021
Abstract Bur Ni Geureudong is one of geothermal areas that potentially to be developed for geothermal power plant in Aceh Province, Indonesia. Prior to the development, detail investigation based on geological, geophysical and geochemical methods are needed for estimating its potential. However, this site is located in a mountainous area with dense forests that are difficult to reach and research of geothermal exploration in site is still very poor considering its promising potential. So that the use of remote sensing method is very suitable to be done to investigate geothermal potential in these remote areas. For reconnaissance survey, Land Surface Temperature (LST) mapping using Landsat 8 OLI/TIRS (Operational Land Imager/Thermal Infrared Sensor) image data was conducted to investigate the geothermal potential in the area. Radiometric correction, Normalized Difference Vegetation Index (NDVI) mapping and emissivity calculations were performed to obtain the LST map. Results show temperatures in the area ranged 17⁰C to 40⁰C, the area with high surface temperatures are caused by geothermal activities. NDVI map also shows an agreement with the high surface temperature region and they are mostly indicated by occurrence of vegetation stress.
Keywords: Bur Ni Geureudong geothermal field, Landsat 8 OLI/TIRS., land surface temperature, Thermal remote sensing
Funding: The authors would like to thank the Ministry of Research, Technology and Higher Education of Indonesia which has funded this research through PMDSU program, with a contract number: 267/ADD/UN11.2/PP/SP3/2017.
Citation: Putri, D.R., Ismail, N., Idroes, R., Rizal, S., Nur, S., and Nanda, M. 2021. Analysis of land surface temperature (LST) in Bur Ni Geureudong geothermal field, Aceh, Indonesia using Landsat 8 OLI / TIRS images. CMU J. Nat. Sci. 20(4): e2021084.
INTRODUCTION
Bur Ni Geureudong geothermal field is located in Bur Ni Geureudong volacano area, District of Bener Meriah, Aceh Province, Indonesia. The volcano has two parasitic cones, i.e., Bur Ni Telong and Pepanji summits, on the southern slopes (Barber et al., 2005). This stratovolcano (2885 m above sea level) is a largest volcanic complex in northern Barisan Mountain range on the western side of Sumatra. Existence of some volcanoes along the Barisan Mountain range are related to tectonic activity of the sunda megathrust along southwestern side of Sumatra (Page et al., 1979). Therefore, most of geothermal potential fields in Indonesia are located along Sumatra (Posavec et al., 1973; Hochstein, 1991; Hochstein and Sudarman, 1993; 2008), but a few of them has been developed for geothermal energy (Nasruddin et al., 2016).
The Geothermal energy has been started by developed countries (i.e., Italy, the United States, New Zealand and Japan), after that this method has been adopted by developing countries (Pocasangre et al., 2020) including Indonesia (Bina et al., 2018; Pambudi, 2018). Until October 2018, electricity capacity from geothermal resources around the world has been installed until 14.4 Gwe (Richter, 2018). Although, geothermal energy potential in Indonesia is estimated to reach around 28,617 MW or 40% of the world's geothermal energy potential (Nasruddin et al., 2016). But generally, there are several challenges in developing geothermal energy in Indonesia. Only about 4.5% of geothermal energy has been used as electrical energy in Indonesia (Nasruddin et al., 2016). The problems include risks of financing and investment, management mechanism of geothermal work areas, electricity tariff, land and environment procurement, research, data on resources and reserves, and coordination with local governments (Setiawan, 2014; Poernomo et al., 2015; Fan and Nam, 2018).
To accelerate efforts to utilize geothermal energy in Indonesia, all parties need to be involved in the development, for example through “Triple Helix” frameworks of industry, government and university collaborations. This paper presented an example research conducted by university for geothermal exploration at Bur Ni Geureudong field, Province of Aceh, Indonesia.
The Bur Ni Geureudong geothermal potential field is characterized by the presence of manifestations on the surface including fumaroles, hydrothermal altered rocks (silica sinter), and several hot springs spread around the area (Cameron et al., 1983). The field is potentially to be developed as a source of a geothermal power plant in the future. Probable reserve of Bur Ni Geureudong geothermal field is estimated up to 160 MWe (Ministry of Energy and Mineral Resources, 2017). Prior to the development of a geothermal power plant, a series of geological, geophysical and geochemical investigations are needed in the area. So far, only reconnaissance survey has been done at the area (Ismail et al., 2016; Putri et al., 2019). Comprehensive research is urgently needed in planning developing areas in Aceh (Nanda et al., 2020), including the Bur Ni Geureudong area in Bener Meriah. In other hand, the field is located in a remote area with very high topographic and covered by densely rainforest. Therefore, an intensive geothermal prospect in the area is considerably hard to be done. This research proposed an effective, fast, and economically cost on geothermal exploration for such challenge area.
Geological and remote sensing methods are commonly used during reconnaissance investigation over the world including in East Africa (Romaguera et al., 2018; Hewson et al., 2020); The Aso Volcanic area in Southwest Japan (Mia et al., 2017a;2017b); Tulu Moye Geothermal Prospect, Main Ethiopian Rift (Darge et al., 2019); Thrace Basin in Eastern Macedonia and Thrace Region in Northeast Greece (Gemitzi et al., 2021); and at Tuzla Village geothermal region, Turkey (Sekertekin and Arslan, 2019). Further studies are followed by geophysical (Nishijima and Naritomi, 2015; Daud et al., 2019; Marwan et al., 2019a; 2019b; Pocasangre et al., 2020) and geochemical methods (Chambefort et al., 2015; Deon et al., 2015; Ranaldi et al., 2016; Idroes et al., 2018; 2019a; 2019b). However, the remote sensing method is believed as an effective method for preliminary study of geothermal field. The method is considered as fast, reliable, and economically costs. Existence of geothermal sources can be characterized by presence of high temperature anomaly on the surface caused by fluid and hot rock around the heat source (Criss, 2015). The area with high temperatures can be detected by remote sensing method (Asadzadeh and de Souza Filho, 2016; Hewson et al., 2019) using Infrared Remote Sensing technique by analyzing Land Surface Temperature (LST) anomaly (Qin et al., 2011; Chatterjee et al., 2017; Romaguera et al., 2018; El Bouazouli et al., 2019; Mujabar, 2019; Wang et al., 2019). Land Surface Temperature (LST) is an important parameter in the application of thermal infrared remote sensing techniques to explore surface temperature anomalies that may correlate with potential geothermal sources (Sekertekin and Arslan, 2019). Landsat 8 OLI/TIRS Satellite image data was used to map Land Surface Temperature in Bener Meriah region influenced by geothermal activity.
MATERIALS AND METHODS
Geological setting of study area
The study area is located in Bener Meriah regency, Aceh Province, Indonesia (Figure 1). Bur Ni Geureudong volcano is volcano complex with a large approximately 18 Km and has two parasitic cones on the southern slopes, i.e., Bur Ni Telong Volcano and Mount of Pepanyi. They are classified as active volcanoes, for example the latest eruption of Bur Ni Telong Volcano occurred in 1937 (Barber et al., 2005). The Volcanoes are located about 50 Km to the Northeast of the Great Sumatran Fault (GSF) which is believed as impact of Eurasian-Australian plates convergent movement (Sieh and Natawidjaja, 2000). There are three local faults crossing the volcanoes in northwest-southeast, North-South and West-East directions. In the southern side of the Bur Ni Geureudong Volcano is bordered by Lut Tawar Lake, as result of tectonic depression around the area.
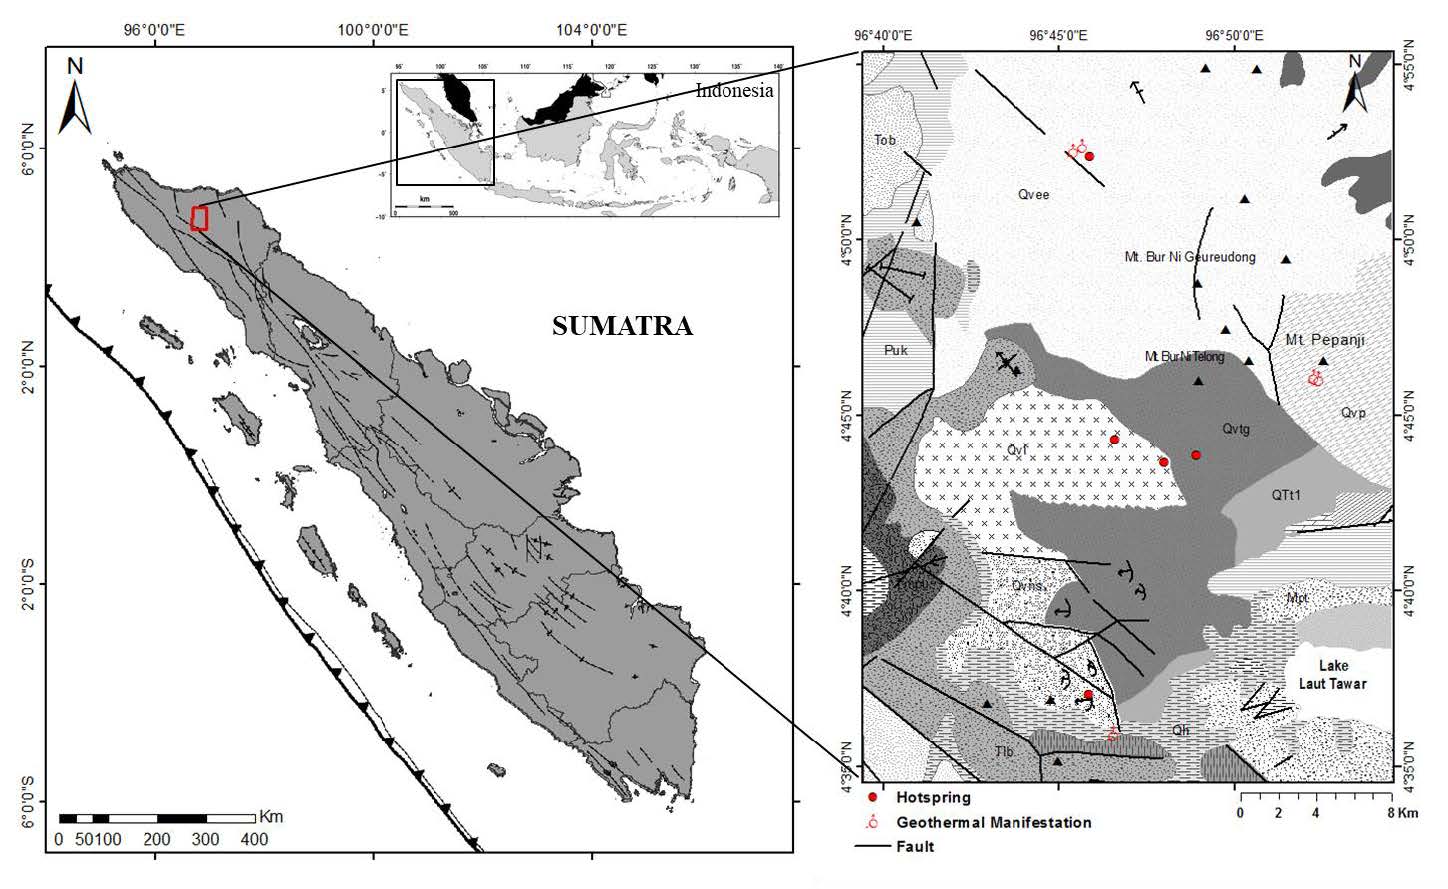
Figure 1. Location of study area (A) and Geologic Map of Study Area which are dominated with volcanic rock and show some geothermal manifestations scattered in study area (B).
Materials
This study uses Landsat 8 OLI/TIRS images data obtained from USGS Earth Resource Observation Systems Data Center (USGS, 2019) recorded on February 12, 2015, path / row: 130/57, geometry correction has been applied to the images. This data set consist of 5 Visual Near Infra-Red bands (VNIR), 2 Short Wave Infra-Red (SWIR) bands, 1 Panchromatic band, 1 band for cirrus clouds detection, and 2 Thermal Infra-Red (TIR) bands.
Methods
To obtain the Land Surface Temperature (LST) in the research area, the Landsat 8 image data must pass through several important calculation stages in image processing. The first stage is to calculate the radiometric correction of the image captured by the satellite, after that the brightness temperature and the NDVI index value are calculated. The NDVI value is used to determine the emissivity of the land surface which will later be used in the LST calculation. After these values are obtained, then the LST equation can be calculated.
Radiometric Correction
The radiometric correction was performed on the OLI data to convert the Digital Number (DN) recorded by the sensor into the light spectral. Radiometric correction was calculated based on Landsat 8 (L8) (USGS, 2016) as shown in following equation:
Lλ = ML * QCAL + AL (1)
where, denotation of Lλ is the light spectral (W/m2srμm), ML is the radiance multiplicative scaling factor for the band, AL is the radiance additive scaling factor for the band, and QCAL is the pixel value in DN.
Calculation of brightness temperature
After a radiometric correction, brightness temperature was calculated only on Landsat 8 thermal band image. The Infrared Thermal Sensor (TIRS) of Landsat 8 has 2 thermal bands, those are band 10 and band 11 with wavelength (λ) 10.9-12 μm, but in LST determination band 10 (λ = 10.9 μm) is more suitable than band 11 because the band 11 has uncertainty. Therefore, in this study we only used Band 10. Brightness temperature in TIRS band was calculated by applying Plank Radiation Function Approach using a formulation in Landsat 8 (L8) (USGS, 2016) as shown in following equation:
![]()
Symbol of T in the equation is TOA Brightness Temperature with unit in Kelvin, Lλ is spectral of light (W/m2srμm), and K1 and K2 are thermal conversion constants for TIRS bands used (K1 = 774.8853 and K2 = 1321.0789 for Band 10). Brightness temperature is the temperature recorded by the satellite sensor with the assumption that the surface emissivity value in the study area is uniform.
NDVI calculation
Normalized Difference Vegetation Index (NDVI) is a correlation between physical parameters with a specific physical properties of vegetation cover (Carlson and Ripley, 1997). After Radiometric correction, the vegetation index values (NDVI) were calculated to the red band (Band 4) and NIR (Near Infrared; Band 5) of Landsat 8 OLI image data. The value of NDVI is obtained by the following equation:
![]()
The calculation of vegetation index (NDVI) using Landsat 8 image was obtained through the ratio of reflectance values of band 4 (red) and band 5 (NIR). The vegetation index value ranges from -1 to 1 (Mia et al., 2014). According to Zhang et al. (2006), NDVI> 0.46 are indicated as a region covered by high density vegetation, the values of -0.063
Emissivity values were determined through NDVI method approach, where the relation between NDVI value and Land Surface Emissivity (LSE) based on (Zhang et al., 2006) are shown in Table 1. In addition to calculate LSE values, the NDVI method was also performed to present the land cover map in the research area. The map can be used to show the occurrence of stress on vegetation caused by anomaly temperatures in the geothermal area.
Table 1. The correlation between NDVI Calculated with Land Surface Emissivity value.
|
NDVI |
LSE |
|
NDVI < -0.18 |
0.985 |
|
-0.18 ≤ NDVI < 0.157 |
0.955 |
|
0.157 ≤ NDVI ≤0.727 |
1.009 + 0.047 x ln (NDVI) |
|
NDVI > 0.727 |
0.990 |
Land Surface Temperature (LST) Retrieval
After doing all the corrections and calculations on the Landsat 8 bands, Land Surface Temperature (LST) is retrieved using Single Channel Algorithm (Qin et al., 2011), the formula is written as:
![]()
where, λ is the wavelength of the emitted radiation and the average wavelength λ is 11.5 μm (Qin et al., 2011). ρ = h.c/j with unit in mK, here h is the Plank constant (6.626 x 10⁻³⁴ Js), c is the speed of light (2,998 x 108 m/s2), and j is the Boltzmann constant (1.38 x 10⁻²³ J/K). Tsensor is the temperature recorded by the sensor obtained from equation above.
RESULTS
Land cover map in the Bur Ni Geureudong geothermal area was produced based on the NDVI method using band 5 and band 4 Landsat 8 OLI images. Figure 2a shows that the value of NDVI over the area is range from -0.813 to 0.817. Most of the area is covered by housing and vegetation such as forests, plantations and there is also a lake at the southeast of the map. The lowest NDVI value (NDVI= -0.813) is found on the Lut Tawar Lake, this is obvious because the lake is totally covered by water body and certainly not overgrown with any vegetation.
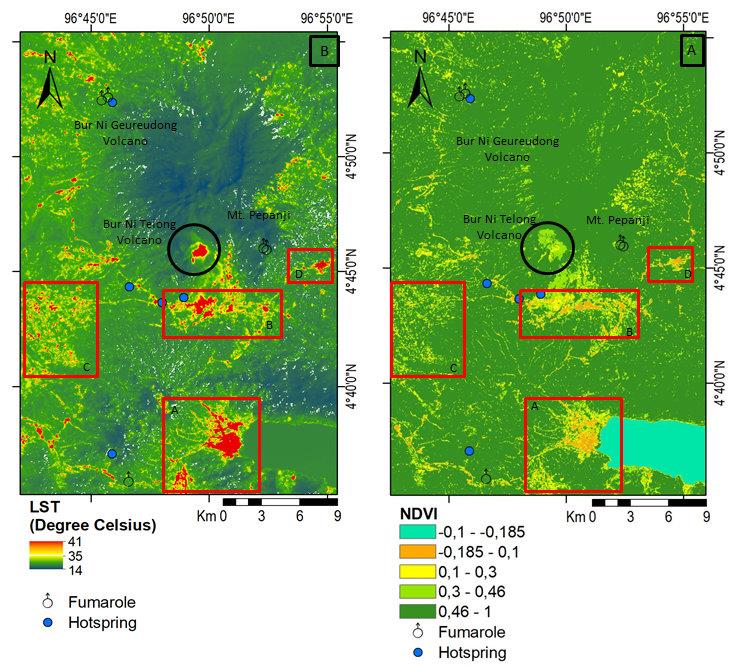
Figure 2. (A) NDVI map (B) Land Surface Temperature map of study area represents difference land cover and LST for human activities in A, B, C, D (red squares) area and geothermal activity as natural phenomenon in Bur Ni Telong region (black circle)
The NDVI map also shows several types of land covers due to human activity (artificial) (Sheik Mujabar, 2019) and geothermal impact (natural) (Wang et al., 2019). It is seen in Figure 2A, the areas marked in square A, B, C and D, are interpreted as settlement which are characterized by low vegetation value. While area in green are plantation and rain forest areas with high vegetation values. In the Bur Ni Telong Volcano region (showing as black circle in Figure 2A), NDVI values range from 0.07 to 0.5. this area is interpreted as land covered with rare vegetation. Top of Bur Ni Telong Volcano is covered by bare soil or not overgrown with vegetation (shown as black circle in Figure 2A and also in Figure 3a).
Land Surface Temperature (LST) maps in the Bur ni Geureudong volcano geothermal field area is shown in Figure 2a. It can be seen that the distribution of surface temperature in this region ranges from 14˚C (green) to 41˚C (red) which covers the entire area. Through this LST map, the difference in temperature values both in settlement and areas affected by geothermal activity can be seen properly. In areas A, B, C, D which are housing, this region has a high surface temperature. High temperatures in urban areas are estimated to be influenced by surface materials such as asphalt, concrete and human activities (Portela et al., 2020).
While areas in the area of Bur ni Telong volcanic cone (black circles), LST values reach 40˚C. In this region there is no human activity but visible thermal anomaly occurs due to natural phenomenon that is geothermal activity. In the area of manifestation, the surface temperature is of moderate value. The effect of geothermal activity is not very visible, it is estimated to be caused by dense vegetation that covers this area. The area with the lowest surface temperature is in the dense vegetation area (dark green) that reaches 14˚C. One of them is around the Bur Ni Geureudong volcano which is an ancient volcano that has been extinct.
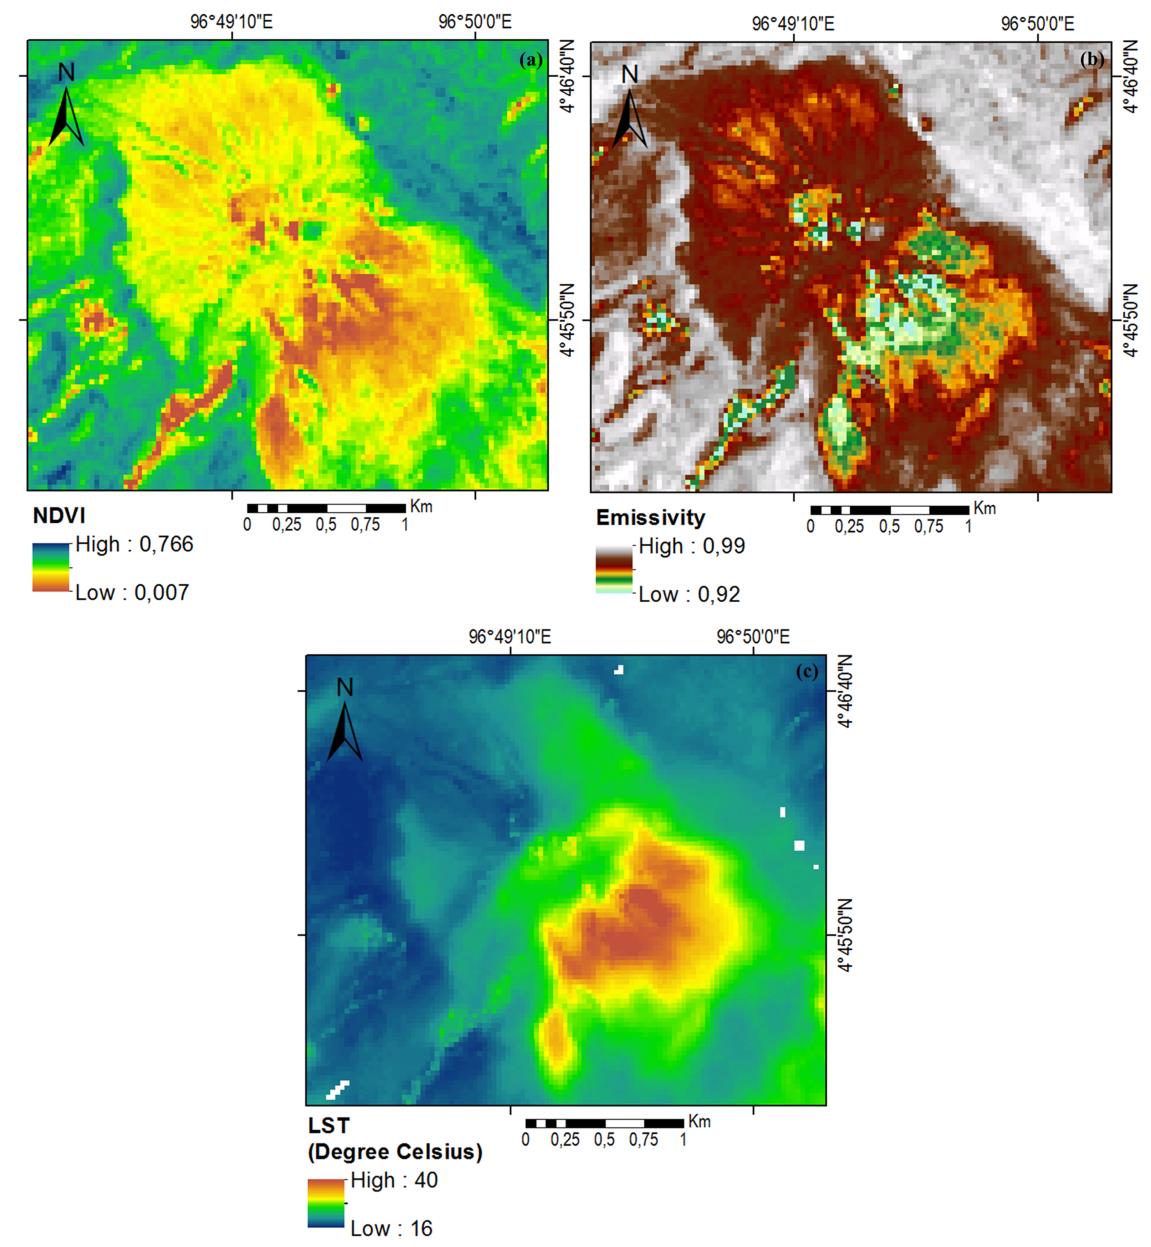
Figure 3. (a) Land Cover Map (b) Land Surface Emissivity Map (c) Land Surface Temperature Map of Bur Ni Telong Volcano show the same pattern of anomaly.
Calculation of LST involves LSE value (Qin et al., 2011). The emissivity can be calculated by the NDVI method where the correlation between NDVI value and emissivity as proposed by Zhang et al. (2006) shown in Table 1. Surface emissivity is the ratio of the radiated energy emitted by the ground surface to the radiation which is emitted by the black body at the same temperature state (Artis and Carnahan, 1982). It is seen in emissivity map (Figure 3b), the measured emissivity values in the study area are ranged from 0.92 to 0.99. The highest values are shown in areas covered by high density vegetation and the lowest values occur in areas covered by natural soils. The top of Mount Bur Ni Telong has a low emissivity value about 0.92-0.94 which shows that at the top of Mount Bur ni Telong is covered by bare soil (Figure 3b). Based on the emissivity map, this top area shows the same pattern as found on the NDVI map (Figure 3a) which in this area has low NDVI value and also low emissivity value with the land covered by a little vegetation to the bare soil caused by geothermal activity.
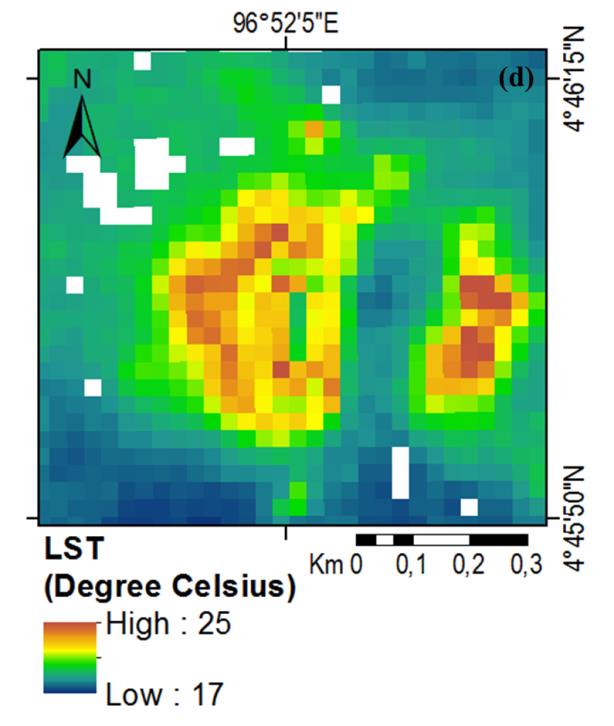
Figure 4. Thermal anomaly occurred in the Pepanji mountain region; it is seen by contrast temperature with the ambient temperature.
Figure 3c shows measured LST map of Bur Ni Telong Volcano. This map shows the value of surface temperature varies, a steep temperature gradient occures over the area with the lowest surface temperature is 16˚C and the highest temperature is 40˚C. The highest temperatures occur in the southeastern side of the mountain which is the area of vomit eruption of Bur Ni Telong. At the top, three points are indicated the occurrence of thermal anomalies characterized by high temperatures up to ±30˚C while the ambient temperature is 24˚C. These three points are predicted as volcanic vents of the Bur Ni Telong Volcano. A more accurate analysis has been obtained by direct identification to the field ensured that all three of these thermal anomalies are derived from Bur Ni Telong volcano crater.
In the area of Mount of Pepanji, there are two points showing thermal anomaly which are suspected as geothermal manifestations (Figure 4). Temperatures in the region is ± 25˚C, which is 8˚C higher than the temperature in the surrounding area with a temperature of 17˚C. The existence of manifestation in this area is proved on geological map and in the map of LST calculation, but it is not known yet what kind of manifestation is it, so the direct investigation about this manifestation is required to ensure the type of geothermal manifestation. Based on information from local people, there is a small lake located on the top of Mount of Pepanji created a caldera.
DISCUSSION
The occurrence of steep temperature anomalies in the top of Bur Ni Telong volcano area indicates thermal activity beneath the surface from shallow sources. The heat from the subsurface is transferred by conduction and causes anomalous temperature compared to land surface temperature in surrounding areas, it is such as the surface temperature in the Mayon Volcano region, Philippines (Chan et al., 2018) and Unggaran Mount, Indonesia (Nugroho and Domiri, 2015).
Bur Ni Geureudong volcano is an ancient volcano that is a type of extinct volcano. This volcano last erupted during the Pleistocene era so that temperature anomalies do not exist on this volcano. However, solfatara and Hot spring field activities around the volcano were detected in the northwestern part of the Bur Ni Geureudong volcano. The manifestations reveal heat source beneath the surface even though this volcano is no longer active. In the area of geothermal manifestations of fumaroles and hot springs, heat is transferred by conversion carried by fluid in the form of hot water and water money to reach the surface. Significant LST anomalies may indicate the presence of heat sources at relatively shallow depths, and there is also a fault as a path of thermal fluid flow that can correlate with zones of geothermal potential as well as in the Dandong geothermal prospect area (Wang et al., 2019). However, to locate a geothermal reservoir, further exploration research needs to be done, such as geophysical, geological, and geochemical surveys.
Based on the NDVI map, an agreement between the vegetation index value and the surface temperature is observed. NDVI analysis was carried out to calculate variations in the LST value in the image and the NDVI value has a negative correlation to LST as reported in many studies (Sekertekin and Arslan, 2019; Al-masaodi and Al-zubaidi, 2021; Edan et al., 2021; Worku et al., 2021). Areas that have low NDVI values show high LST values; in contrast, areas with low vegetation values show high LST values. This is because plants can absorb heat, which makes the soil temperature lower.
However, in geothermal areas, the presence of acidic fluid and high surface temperatures cause stress on vegetation. On the NDVI map, vegetation stress is observed in several geothermal prospect areas, namely in the areas of manifestation of fumaroles and hot springs, as well as in the Bur Ni Telong volcano area marked by bared vegetation. Areas of manifestation are usually associated with discharge areas such as fumaroles and hot spring that produce alterations of rocks and fluids with PH. The manifestation products cause the soil to be infertile, so the plants are difficult to grow, or the plants to be stressed, like vegetation that grows in other geothermal areas (Suryantini et al., 2013; Beadel et al., 2018).
CONCLUSION
The remote sensing method has been applied in a geothermal exploration study at Bener Meriah geothermal field, Aceh province of Indonesia based on Landsat OLI / TIRS imagery data. For mapping land cover, the distribution of NDVI values in the Burni Geureudong geothermal area ranges from -0.813 to 0.817. The NDVI has been able to distinguish between the land covers caused by human activity, i.e, settlement and plantation and also natural phenomenon, i.e., caused by presence of anomalies exhibiting vegetation stress due to geothermal activity and lake. for LST value, distribution of LST values ranging from 14ºC to 41ºC spread over the research area. The presence of thermal anomalies has been observed in several locations based on the LST map. In the area of the active volcano Bur ni Telong, the LST value is quite high which is estimated as the result of heat flow from below the geothermal surface by conduction. Application of remote sensing methods in the geothermal exploration study is very efficient used for a wide range of research areas, but it is still needed field assessment in order to proof type of manifestations. The LST value is able to show the distribution of thermal anomalies but unreliable to specify geothermal potential directly, especially in highly dense vegetation area, because vegetation absorb the heat energy from the geothermal surface.
This research has a direct and indirect effect on the development of geothermal energy in Indonesia. From the few available data related to geothermal in the Bur Ni Geureudong volcano region, directly, this research provides additional information for the government in developing geothermal energy in Indonesia. And indirectly, this article is a contribution to the role of university in geothermal exploration study in Indonesia. In the development of geothermal resources, the results studi are also expected to be an additional data collection to proper understand the nature and properties of the Bur ni Geureudong geothermal system. So that when energy production is operational, the management of the resources can be carried out properly and long-term energy extract or known as sustainable production. In addition, the results also monitor the sustainable impact of geothermal development on the environment so that there is management to overcome the impact of this energy extraction.
ACKNOWLEDGEMENTS
The authors are grateful for the Faculty of Mathematics and Natural Science for providing research support facilities. This research is carried out in the Laboratory of Geophysics, Department of Physics, Universitas Syiah Kuala, Banda Aceh, Indonesia.
AUTHOR CONTRIBUTIONS
Deviyani R. Putri carried out the research and wrote the article. Rinaldi Idroes and Nazli Ismail gave the central research idea dan provided the theoretical framework. Syamsul Rizal and Syahrun Nur supervised research progress. Nazli Ismail and Muhammad Nanda anchored the review, revisions, and approved the article submission. All authors have read and approved of the final manuscript.
CONFLICT OF INTEREST
The authors declare that they hold no competing interests.
REFERENCES
Al-masaodi, H.J.O., and Al-zubaidi, H.A.M. 2021. Spatial-temporal changes of land surface temperature and land cover over Babylon Governorate, Iraq. Materials Today: Proceedings.
Artis, D.A., and Carnahan, W.H. 1982. Survey of emissivity variability in thermography of urban areas. Remote Sensing of Environment, 12: 313–329.
Asadzadeh, S. and de Souza Filho, C.R. 2016. A review on spectral processing methods for geological remote sensing. International Journal of Applied Earth Observation and Geoinformation, 47: 69–90.
Barber, A.J., Crow, M.J., and Milsom, J. S. 2005. Sumatra. Geological Society Memoir (Vol. 31).
Beadel, S., Shaw, W., Bawden, R., Bycroft, C., Wilcox, F., Mcqueen, J., and Lloyd, K. 2018. Sustainable management of geothermal vegetation in the Waikato Region, New Zealand, including application of ecological indicators and new monitoring technology trials. Geothermics, 73: 91–99.
Bina, S.M., Jalilinasrabady, S., Fujii, H., and Pambudi, N.A. 2018. Classification of geothermal resources in Indonesia by applying exergy concept. Renewable and Sustainable Energy Reviews, 93: 499–506.
Cameron, N. R., Bennett, J. Djunuddin, A., Ghazali, S.A., Harahap, H., Jeffery, D.H., and Thompson, S.J. 1983. Geologic map of the Takengon quadrangle, Sumatra. Geological Research and Development Center.
Carlson, T.N., and Ripley, D.A. 1997. On the relation between NDVI, fractional vegetation cover, and leaf area index. Remote Sensing of Environment, 62: 241–252.
Chambefort, I., Buscarlet, E., Wallis, I.C., Sewell, S., and Wilmarth, M. 2015. Ngatamariki Geothermal Field, New Zealand: Geology, geophysics, chemistry and conceptual model. Geothermics, 59: 266–280.
Chan, H.P., Chang, C.P., and Dao, P.D. 2018. Geothermal Anomaly Mapping Using Landsat ETM+ Data in Ilan Plain, Northeastern Taiwan. Pure and Applied Geophysics, 175: 303–323.
Chatterjee, R.S., Singh, N., Thapa, S., Sharma, D., and Kumar, D. 2017. Retrieval of land surface temperature (LST) from landsat TM6 and TIRS data by single channel radiative transfer algorithm using satellite and ground-based inputs. International Journal of Applied Earth Observation and Geoinformation, 58: 264–277.
Criss, R.E. 2015. Use of geochemical and geophysical techniques to characterize and prospect for geothermal resources and hydrothermal ore deposits. Journal of Earth Science, 26: 73–77.
Darge, Y.M., Hailu, B.T., Muluneh, A.A., and Kidane, T. 2019. Int J Appl Earth Obs Geoinformation Detection of geothermal anomalies using Landsat 8 TIRS data in Tulu Moye geothermal prospect, Main Ethiopian Rift. Int J Appl Earth Obs Geoinformation, 74: 16–26.
Daud, Y., Aswo, W., Fahmi, F., Sesesega, R., Fitriani, Pratama, S., and Munanda, A. 2019. Resistivity characterization of the Arjuno-Welirang volcanic geothermal system (Indonesia) through 3-D Magnetotelluric inverse modeling. Journal of Asian Earth Sciences, 174: 352–363.
Deon, F., Förster, H.J., Brehme, M., Wiegand, B., Scheytt, T., Moeck, I., and Putriatni, D.J. 2015. Geochemical/hydrochemical evaluation of the geothermal potential of the Lamongan volcanic field (Eastern Java, Indonesia). Geothermal Energy, 3: 20.
Edan, M., Maarouf, R., and Hasson, J. 2021. Predicting the impacts of land use / land cover change on land surface temperature using remote sensing approach in Al Kut, Iraq. Physics and Chemistry of the Earth, 123(February), 103012.
El Bouazouli, A., Baidder, L., Pasquier, P., and Rhouzlane, S. 2019. Remote sensing contribution to the identification of potential geothermal deposits: A case study of the Moroccan Sahara. Materials Today: Proceedings, 13: 784–794.
Fan, K., and Nam, S. 2018. Accelerating Geothermal Development in Indonesia: A Case Study in the Underutilization of Geothermal Energy. Consilience: The Journal of Sustainable Development, 19: 103–129.
Gemitzi, A., Dalampakis, P. and Falalakis, G. 2021. Detecting geothermal anomalies using Landsat 8 thermal infrared remotely sensed data. International Journal of Applied Earth Observations and Geoinformation, 96(October 2020: 102283.
Hewson, R., Mshiu, E., Hecker, C., Van Der Werff, H., Van Ruitenbeek, F., Alkema, D., and Van Der Meer, F. 2020. The application of day and night time ASTER satellite imagery for geothermal and mineral mapping in East Africa. Int J Appl Earth Obs Geoinformation, 85(October 2019): 1–13.
Hochstein, M.P. 1991. Geothermal Prospects of Sumatra (Overview). Proceedings 13th New Geothermal Workshop.
Hochstein, M.P., and Sudarman, S. 1993. Geothermal resources of Sumatra. Geothermics, 22: 181–200.
Hochstein, M.P., and Sudarman, S. 2008. History of geothermal exploration in Indonesia from 1970 to 2000. Geothermics, 37: 220–266.
Idroes, R., Yusuf, M., Alatas, M., Subhan, Lala, A., Saiful, Marwan. 2018. Geochemistry of hot springs in the Ie Seu’um hydrothermal areas at Aceh Besar district, Indonesia. Conf. Ser.: Mater. Sci. Eng. 523 012012.
Idroes, R., Yusuf, M., Alatas, M., Lala, A., and Suhendra, R. 2019a. Geochemistry of Sulphate spring in the Ie Jue geothermal areas at Aceh Besar district, Indonesia. Conf. Ser.: Mater. Sci. Eng. 523 012012.
Idroes, R., Yusuf, M., Saiful, S., Alatas, M., Subhan, S., Lala, A., Mahlia, T.M.I., 2019b. Geochemistry Exploration and Geothermometry Application in the North Zone of Seulawah Agam, Aceh Besar District, Indonesia. Energies, 12.
Ismail, N., Putri, D.R., Arifan, T., and Hutapea, A.B.C. 2016. Interpretation of Gravity and Magnetic Data to Delineate Local Fault Structures in Bur Ni Geureudong Geothermal Field, Aceh Province, Indonesia. In The 11th Asian Geothermal Symposium. Chiangmai.
Marwan, Syukri, M., Idroes, R., and Ismail, N. 2019a. Deep and shallow structures of geothermal Seulawah Agam based on electromagnetic and magnetic data. International Journal of GEOMATE, 16: 141–147.
Marwan, Yanis, M., Idroes, R., and Ismail, N. 2019b. 2D inversion and static shift of MT and TEM data for imaging the geothermal resources of Seulawah Agam Volcano, Indonesia. International Journal of GEOMATE, 17: 173–180.
Mia, B., Nishijima, J., and Fujimitsu, Y. 2014. Exploration and monitoring geothermal activity using Landsat ETM+images. A case study at Aso volcanic area in Japan. Journal of Volcanology and Geothermal Research, 275: 14–21.
Mia, B., Bhattacharya, R., and Woobaidullah, A.S.M. 2017a. Correlation and monitoring of land surface temperature, urban heat island with land use-land cover of Dhaka city using satellite imageries, 3: 10–20.
Mia, B., Fujimitsu, Y., and Nishijima, J. 2017b. Thermal activity monitoring of an active volcano using landsat 8/OLI-TIRS sensor images: a case study at the aso volcanic area in southwest Japan. Geosciences, 7: 118.
Ministry of Energy and Mineral Resources. 2017. Geothermal potensial of indonesia chapter 1. Jakarta.
Nanda, M., Rizal, S., Abdullah, F., Idroes, R., and Ismail, N. 2020. Mapping faults distribution based on dem data for regional spatial plan assessment of Sabang municipality, Indonesia. International Journal of Geomate, 19: 197–204.
Nasruddin, Idrus Alhamid, M., Daud, Y., Surachman, A., Sugiyono, A., Aditya, H. B., and Mahlia, T. M. I. 2016. Potential of geothermal energy for electricity generation in Indonesia: A review. Renewable and Sustainable Energy Reviews, 53: 733–740.
Nishijima, J., and Naritomi, K. 2015. Interpretation of gravity data to delineate underground structure in the Beppu geothermal field, central Kyushu, Japan. Journal of Hydrology: Regional Studies.
Nugroho, U.C., and Domiri, D.D. 2015. Identification of land surface temperature distribution of geothermal area in Ungaran mount by using landsat 8 imagery. International Journal of Remote Sensing and Earth Sciences, 12: 143–150.
Page, B.G.N., Bennett, J.D., Cameron, N.R., Bridge, D.M., Jeffery, D.H., Xeats, W., and Thaib, J. 1979. A review of the main structural and magmatic features of northern Sumatra. The Geological Society, 136: 569–579.
Pambudi, N. A. 2018. Geothermal power generation in Indonesia, a country within the ring of fire: current status, future development and policy. Renewable and Sustainable Energy Reviews, 81: 2893–2901.
Pocasangre, C., Fujimitsu, Y., and Nishijima, J. 2020. Interpretation of gravity data to delineate the geothermal reservoir extent and assess the geothermal resource from low-temperature fluids in the Municipality of Isa, Southern Kyushu, Japan. Geothermics, 8: 101735.
Poernomo, A., Satar, S., Effendi, P., Kusuma, A., Azimudin, T., and Sudarwo, S. 2015. An overview of Indonesia geothermal development – current status and its challenges. In Proceedings World Geothermal Congress 2015, Melbourne, Australia. Melbourne.
Portela, C.I., Massi, K.G., Rodrigues, T., and Alcantara, E. 2020. Impact of urban and industrial features on land surface temperature: evidences from satellite thermal indices. Sustainable Cities and Society.
Posavec, M., Taylor, D., van Leeuwen, T., and Spector, A. 1973. Tectonic controls of volcanism and complex movements along the sumatran fault system. Bulletin of the Geological Society of Malaysia, 43–60.
Putri, D.R., Nanda, M., Rizal, S., Idroes, R., and Ismail, N. 2019. Interpretation of gravity satellite data to delineate structural features connected to geothermal resources at Bur Ni Geureudong geothermal. IOP Conf. Ser.: Earth Environ. Sci. 364 012003.
Qin, Q., Zhang, N., Nan, P., and Chai, L. 2011. Geothermal area detection using Landsat ETM+ thermal infrared data and its mechanistic analysis-A case study in Tengchong, China. International Journal of Applied Earth Observation and Geoinformation, 13: 552–559.
Ranaldi, M., Lelli, M., Tarchini, L., Luisa, M., and Patera, A. 2016. Estimation of the geothermal potential of the Caldara di Manziana site in the Sabatini Volcanic District (central Italy) by integrating geochemical data and 3D-GIS modelling. Geothermics, 62: 115–130.
Richter, A. 2018. Global geothermal capacity reaches 14,369 mW - The Top 10 geothermal countries, Oct 2018. Think Geoenergy. https://doi.org/http:// www.thinkgeoenergy.com
Romaguera, M., Vaughan, R.G., Ettema, J., Izquierdo-Verdiguier, E., Hecker, C.A., and van der Meer, F.D. 2018. Detecting geothermal anomalies and evaluating LST geothermal component by combining thermal remote sensing time series and land surface model data. Remote Sensing of Environment, 204(November 2016): 534–552.
Sekertekin, A., and Arslan, N. 2019. Monitoring thermal anomaly and radiative heat flux using thermal infrared satellite imagery – A case study at Tuzla geothermal region. Geothermics, (July 2018), 78: 243–254.
Setiawan, H. 2014. geothermal energy development in Indonesia: progress, challenges and geothermal energy development in Indonesia: progress, challenges and prospect. International Journal of Advanced Science Engineering Information Technology, 4.
Sheik Mujabar, P. 2019. Spatial-temporal variation of land surface temperature of Jubail Industrial City, Saudi Arabia due to seasonal effect by using Thermal Infrared Remote Sensor (TIRS) satellite data. Journal of African Earth Sciences, 155: 54–63.
Sieh, K., and Natawidjaja, D. 2000. Neotectonics of the Sumatran fault, Indonesia. Journal of Geophysical Research, 105, 28295.
Suryantini, Wibowo, H., Rahman, K.R., and Woldai, T. 2013. Application of Normalized Different Vegetation Index (NDVI) method to identify thermal anomaly area from remote sensing. In 13th Indonesia International GEOTHERMAL Convention and Exhibition.
USGS. 2016. Landsat 8 data users handbook. Nasa (5th ed., Vol. 8). South Dakota: Department of the Interior U.S. Geological Survey.
USGS. 2019. USGS Earth Resource Observation Systems Data Center.
Wang, K., Jiang, Q., Yu, D., Yang, Q., Wang, L., Han, T., and Xu, X. 2019. Detecting daytime and nighttime land surface temperature anomalies using thermal infrared remote sensing in Dandong geothermal prospect. International Journal of Applied Earth Observation and Geoinformation, 80: 196–205.
Worku, G., Teferi, E., and Bantider, A. 2021. Assessing the effects of vegetation change on urban land surface temperature using remote sensing data : The case of Addis Ababa city, Ethiopia. Remote Sensing Applications: Society and Environment, 22(April), 100520.
Zhang, J., Wang, Y., and Li, Y. 2006. A C++ program for retrieving land surface temperature from the data of Landsat TM/ETM+ band6. Computers and Geosciences, 32: 1796–1805.
OPEN access freely available online
Chiang Mai University Journal of Natural Sciences [ISSN 16851994]
Chiang Mai University, Thailand
https://cmuj.cmu.ac.th
Deviyani R. Putri1, Nazli Ismail2,*, Rinaldi Idroes1,3 , Syamsul Rizal1,4, Syahrun Nur2, and Muhammad Nanda1
1 Graduate School of Mathematics and Applied Sciences, Universitas Syiah Kuala, Banda Aceh 23111, Indonesia
2 Department of Physics, Faculty of Mathematics and Natural Sciences, Universitas Syiah Kuala, Banda Aceh 23111, Indonesia
3 Department of Chemistry, Faculty of Mathematics and Natural Sciences, Universitas Syiah Kuala, Banda Aceh 23111, Indonesia
4 Marine Sciences Department, Universitas Syiah Kuala, Banda Aceh 23111, Indonesia
Corresponding author: Nazli Ismail, E-mail: nazli.ismail@unsyiah.ac.id
Total Article Views
Editor: Korakot Nganvongpanit,
Chiang Mai University, Thailand
Article history:
Received: December 30, 2020;
Revised: July 13, 2021;
Accepted: July 19, 2021;