 ISSN: 2822-0838 Online

The Association between the Mapping Distribution of Melioidosis Incidences and Meteorological Factors in an Endemic Area: Ubon Ratchathani, Thailand (2009–2018)
Jaruwan Wongbutdee, Wacharapong Saengnill*, Jutharat Jittimanee, Pawana Panomket, and Phairo SaenwangPublished Date : 2021-09-13
DOI : https://doi.org/10.12982/CMUJNS.2021.083
Journal Issues : Number 4, October-December 2021
Abstract Melioidosis is a public health problem in the tropical regions, occurring to meteorological variability. For 10 years of melioidosis outbreaks, we create probability maps of melioidosis distribution during 2009–2018 and determine the association with meteorological factors. The monthly average rainfall and incidence of melioidosis were high from July to September but they not significantly associated (P = 0.576). However, the monthly maximum and minimum temperature were significantly associated with melioidosis incidence (P = 0.002 and P = 0.029, respectively). We estimated the spatial distribution of rainfall and maximum and minimum temperature using the Co-Kriging interpolation method which found that the spatial distribution of the melioidosis incidence was significantly associated with rainfall in 2009, 2010, and 2015; with the maximum temperature in 2009, 2010, 2011, 2013, and 2015; and with the minimum temperature in 2010, 2011, and 2015. Our finding approach may support information and classify a pattern for melioidosis distribution.
Keywords: Incidence, Melioidosis, Meteorological factors
Funding: This research was supported by Grants from Biodiversity-Based Economy Development Office (Public Organization) (Grants number: 29/2561) to Jaruwan Wongbutdee).
Citation: Wongbutdee, J., Saengnill, W., Jittimanee, J., Panomket, P., and Saenwang, P. 2021. The association between the mapping distribution of melioidosis incidences and meteorological factors in an endemic area: Ubon Ratchathani, Thailand (2009–2018). CMU J. Nat. Sci. 20(4): e2021083.
INTRODUCTION
Melioidosis is a crucial endemic disease in the tropical regions, especially Thailand (Limmathurotsakul et al., 2010). In addition, the north of Australia and South America has reported an incidence of melioidosis (Currie et al., 2004; Rolim et al., 2005; Currie et al., 2008). Melioidosis is a disease caused by Burkholderia pseudomallei bacteria.
B. pseudomallei is a soil contaminant at a depth of 0–90 centimeters. The optimal of temperature for B. pseudomallei grows is 37–42°C (Tong et al., 1996; Limmathurotsakul et al., 2013), but at 25°C, bacterial growth is delayed (Paksanont et al., 2018). In addition, B. pseudomallei favors moist soil (>10%) and soil texture, including clay and clay loam (Palasatien et al., 2008; Kaestli et al., 2009).
Nowadays, climate change has influenced human and pathogen as a result from global warming of the earth of atmosphere, occurring to greenhouse gas absorb infrared radiation. The increasing of temperature affects a natural phenomenon abnormal of season change. In the rainy season, some areas have a heavy rainfall while other areas have a drought. Similarly, during the long cold season, some areas are hot. Particularly, B. pseudomallei has a tolerance of high temperature and growth is delayed in low-temperature environments, so it can be distributed to another site where is existing. In Thailand, B. pseudomallei is found both dry season and rainy season (Wuthiekanun et al., 1995; Wuthiekanun et al., 2009; Suebrasri et al., 2013; Ong et al., 2017) but melioidosis outbreaks are more common during the rainy season (Chaowagul et al., 1989; Suputtamongkol et al., 1994). Previous studies have found that the incidence of melioidosis is correlated with rainfall (Currie and Jacups, 2003; Mu et al., 2014; Liu et al., 2015). A study conducted in Australia from 1990–2013 found that rainfall and maximum temperatures affected the incidence of melioidosis (Kaestli et al., 2016). A study conducted in Northeastern Thailand from 2001–2005 found that the incidence was correlated with the rainfall. In addition, the number of patients consultations increases during the rainy season between June and October (Tanwisaid and Surin, 2008). Ubon Ratchathani Province is the northeast of Thailand where regional melioidosis epidemics still occur occasionally. The key factors associated with human infection are agricultural activities for soil preparation and growing plants, such as plowing, shoveling, and digging together with poor protection of themselves such as not wear boots or gloves which increase opportunity to expose B. pseudomallei contaminated soil. Many researchers have reported meteorological data correlation with melioidosis distribution. This knowledge may be of benefit to future studies. Our research focuses specifically on geospatial distribution of melioidosis with meteorological factors. The geographic information system has a powerful tool to calculate spatial autocorrelation and show the geographic coordinates. This enables the distribution pattern to be analyzed and for hot-spot areas to be identified. Additionally, the estimation probability mapping of meteorological data is generated by geo-statistic functions. It calculates a correlation between values of a single variable within each location. The location is close to that of a cluster pattern while the locations are distances far apart that are dispersal. The monitoring of melioidosis epidemics, using spatiotemporal and time series data is key for surveillance and control at a local level. For 10 years, this previous has an uncertainly phenomenon of climate which is determined the hypothesis to affect melioidosis distribution. Therefore, the objective of this study was to estimate the probability mapping of melioidosis distribution during 2009-2018 and to analyze the association between melioidosis distribution and meteorological factors.
MATERIALS AND METHODS
Study area
Ubon Ratchathani Province is located in the northeast of Thailand. It shares a 428 km border with Laos and Cambodia. Its area covers 15,774 km2 and has a population of 1,878,146. The main occupation is agriculture such as rice, rubber, and cassava. This area is determined a geo-reference at 15°15′0″North and 104°49′48″East. The three main rivers are Moon, Chi and Mae Kong. The elevation is 56-765 Metres above sea level (Figure 1). This area is located in a tropical region and consists of three seasons. The summer season is from mid-February to mid-May and rainy season is from mid-May to mid-October. The winter season starts in mid-October and ends in mid-February. The average rainfall is approximately 1,166.46 mm. The annual mean maximum and minimum temperatures of 36.31°C and 19.05°C respectively.
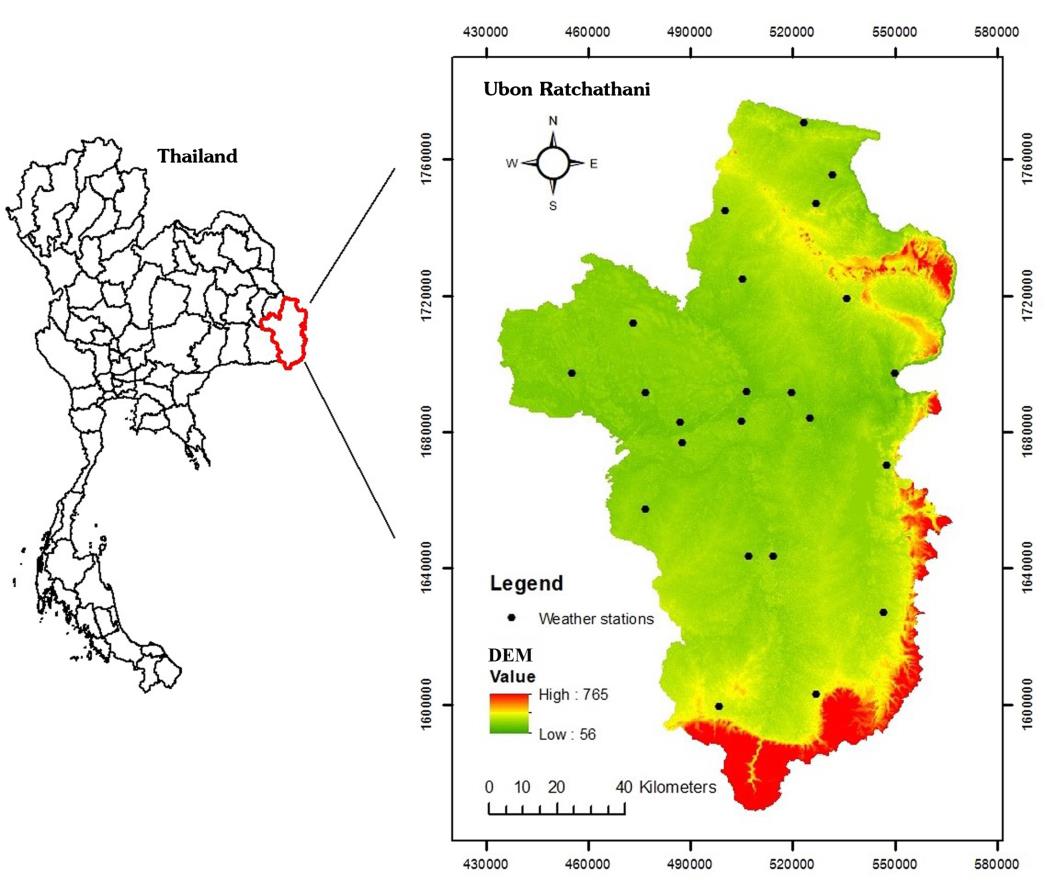
Figure 1. Location of Ubon Ratchathani Province the Northeast of Thailand and the 23 Weather Stations and Digital Elevation Model (DEM).
Melioidosis data
The data on melioidosis cases were collected during 2009–2018 from Sappasitthiprasong Hospital in Ubon Ratchathani Province. The population data were collected from the official statistical registration system of the Department of Local Administration. The incidence rate obtained from calculation the cumulative melioidosis incidence and population in each year during 2016–2018. Meanwhile, the demographic data in 2016 were used as a standard population to determine the incidence rate of melioidosis in 2009–2015. The incidence rate of melioidosis, which was attribute data, and of the location of the village, which was spatial data, were connected using a primary key (village code). The distribution map of melioidosis incidence georeferenced Universal Transverse Mercator (zone 48N) and spheroid datum of WGS-1984. The points of village without any cases of melioidosis were removed from the spatial data for each year. Then, the point density function of the spatial analyst tool created the density surface of the incidence rate by area (Yue et al., 2018), which was expressed as the incidence rate of melioidosis per square kilometer. Subsequently, for incidence density of melioidosis, the natural breaks technique was used.
Meteorological data
The meteorological data including: rainfall, maximum temperature, and minimum temperature were collected during 2009–2018 from the Northeastern Meteorological Center. The 23 weather station locations were based on a topographical map scale 1:50,000, which coordinated the reference of Universal Transverse Mercator (zone 48N) and spheroid datum of WGS-1984 (Figure 1). The weather data were connected with the position of the weather station. The altitude can used to estimate the weather data based on the land surface homogeneity. Therefore, the digital elevation map (DEM) with 30 m. resolution (scale 1:50,000) was collected from the Faculty of Geoinformatics, Burapha University, Thailand. Subsequently, the monthly weather data in each year were used to estimate a spatial distribution of average rainfall, maximum and minimum temperature by Interpolation Co-Kriging function of geo-statistics with the DEM (Adhikary et al., 2017). Because Co-Kriging used value on two variable types as weather data with the DEM, this process generated the map prediction. For the Co-Kriging, we used the default a parameter of each variable value which was determined using ArcGIS version 10.5.1. Then, the estimation probability mapping of average monthly weather data in each year was aggregated by overlaying all the data classes. The assessment of interpolation methods is evaluated and compared based on root mean square error (RMSE), mean absolute error (MAE) (Equation 1-2), and coefficient of determination (R2) values between the observed and estimated rainfall, maximum and minimum temperature values.
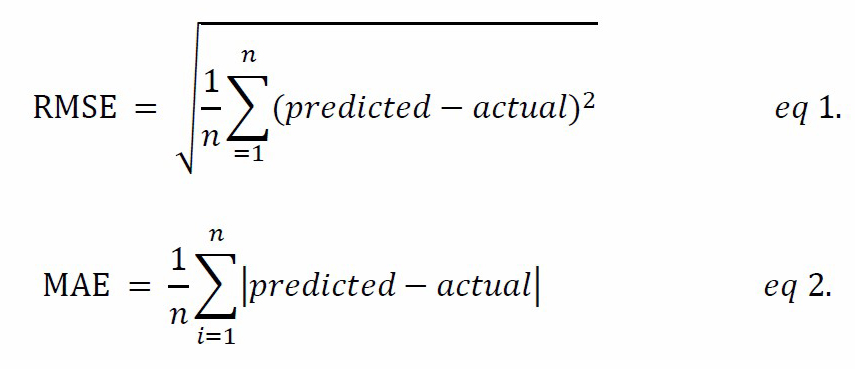
Where n is the number of observations, predicted is modelled values of average rainfall, maximum and minimum temperature, actual is observation values.
Statistical analysis
We analyzed the data for a 10-year-period. The dataset was divided into two sections. First, the incidence rate of melioidosis and meteorological data were plotted by month. The Spearman rank test was used to measure the correlation between the incidence rate of melioidosis and the meteorological data based on a rejection of the null hypothesis assumption of a normal distribution by the Kolmogorov-Smirnov test (P <0.001). Second, the map probability distribution, the incidence rate of melioidosis and the average rainfall, maximum and minimum temperature each year were extracted for each village. The association between the incidence rate of melioidosis and meteorological factors were then analyzed using the Spearman rank test.
Ethics approval
Human protocols were approved by The Ubon Ratchathani University-Human Ethic Committee (ID: UBU-REC-29/2561).
RESULTS
During the study period the highest incidence rates of melioidosis were 124.76 and 124.68 per 100,000 population in 2010 and 2009, respectively. The incidence rate of melioidosis decreased slightly from 2011 to 2015, and increased in 2016 and 2017 to 92.97 and 96.33 per 100,000 population, respectively. However, the incidence rate subsequently decreased and the lowest incidence rate over the 10-year period occurred in 2018 (Figure 2).
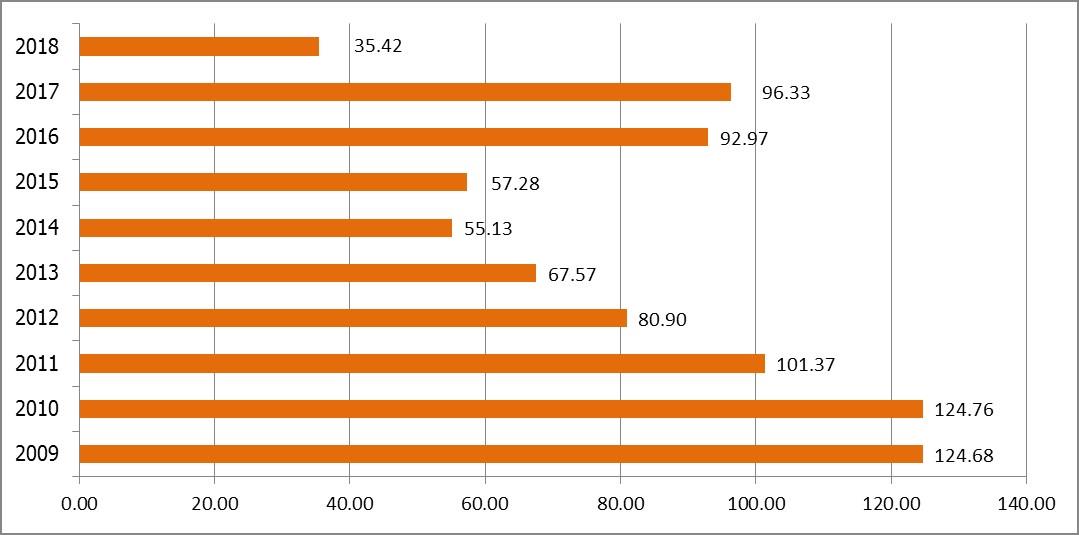
Figure 2. Annual incidence rate of melioidosis per 100,000 population during the 10-year study period (2009–2018).
The comparison between the monthly average rainfall and the incidence rate of melioidosis revealed that the incidence rate peaked in July to September. In addition, the incidence rate dropped continuously from October to December (Figure 3). The maximum average monthly temperature the study period ranged from 31.06–39.59°C. The highest temperatures occurred during the dry season (March to May) with maximum temperatures of 38.53°C, 39.59°C, and 38.19°C and incidence rates of 63.29, 62.10, and 54.79 per 100,000 population, respectively (Figure 4). However, the minimum temperature decreased from July to December reach a low of 14.46°C in December with a corresponding melioidosis incidence rate of 69.33 per 100,000 population (Figure 5).
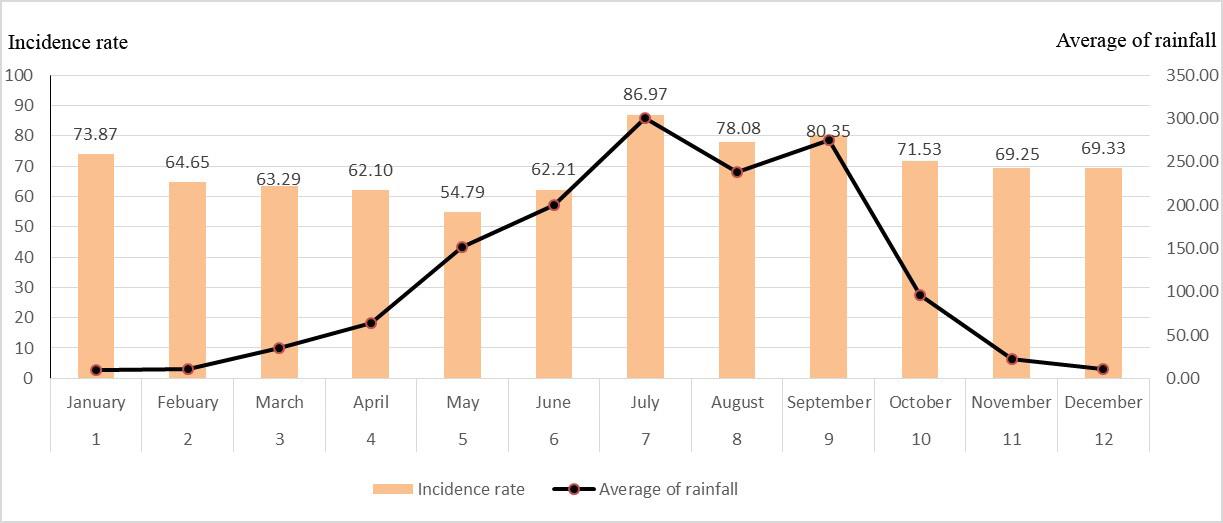
Figure 3. Average monthly incidence rate of melioidosis and the average monthly rainfall during the 10-year study period.
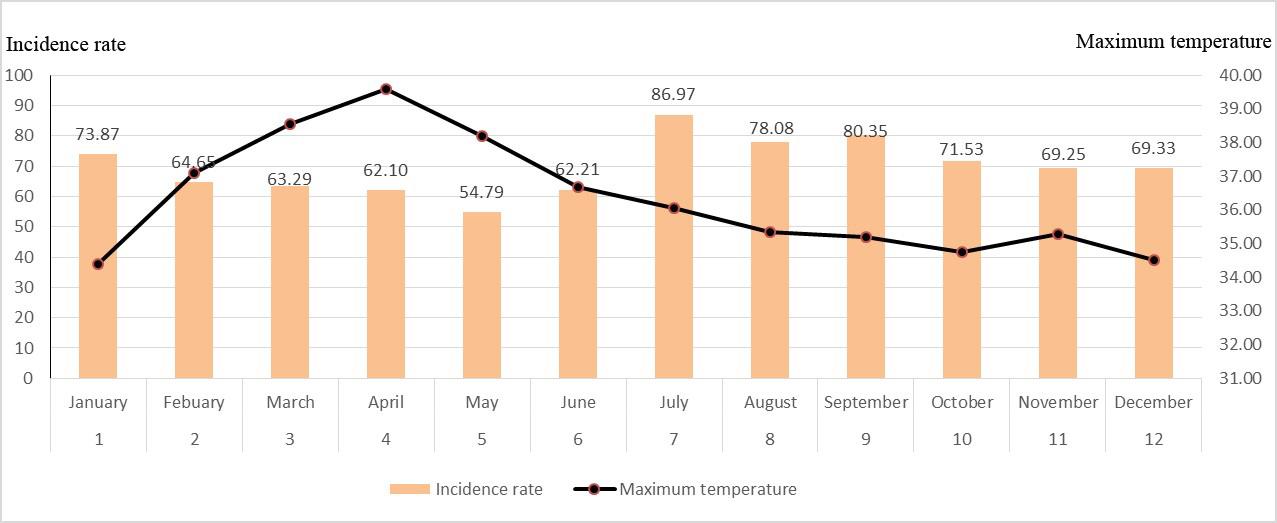
Figure 4. Average monthly incidence rate of melioidosis and the average monthly rainfall during the 10-year study period.
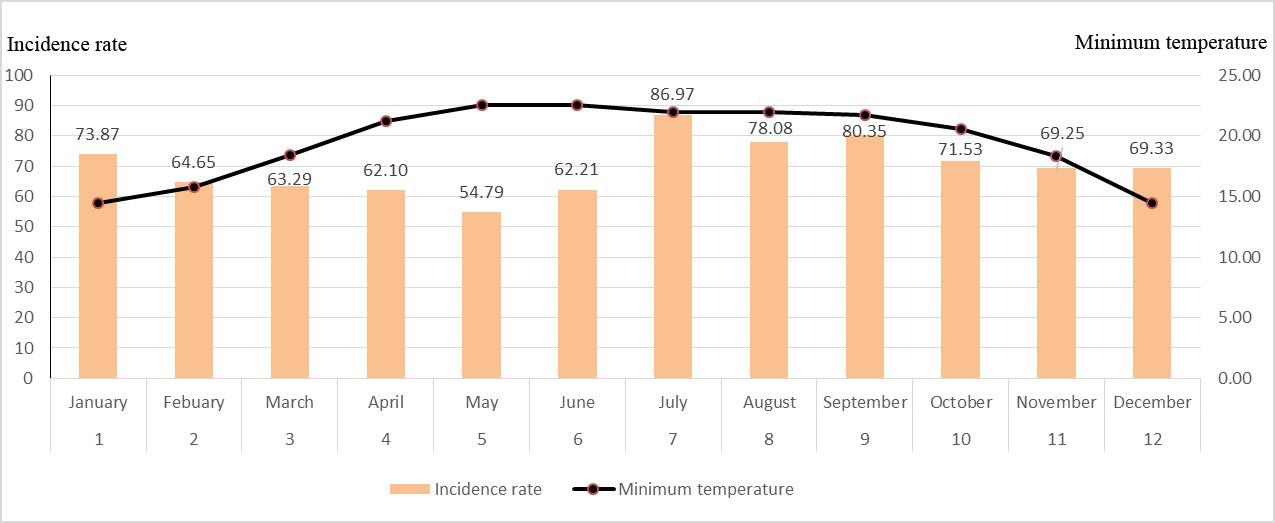
Figure 5. Average monthly incidence rate of melioidosis and the average monthly minimum temperature during the 10-year study period.
The association between the monthly incidence rate of melioidosis and meteorological factors (rainfall, maximum, and minimum temperature) found that no significant association with rainfall (P = 0.576) while maximum and minimum temperature were significantly associated with monthly incidence rate of melioidosis (P = 0.002 and P = 0.029, respectively) (Table 1).
Table 1. Correlation between monthly incidence rate of melioidosis and meteorological factors.
|
Climate variability factors |
Correlation value |
P-value |
Kolmogorov-test |
|
Rainfall |
−0.052 |
0.576 |
0.176** |
|
Maximum temperature |
−0.289* |
0.002 |
0.144** |
|
Minimum temperature |
−0.202* |
0.029 |
0.190** |
Note: * P-value <0.05, ** P-value <0.001
The spatial distribution, incidence rate (per 1,000 population) of melioidosis was attributed to each village site based on the geographic coordinates. The distribution mapping showed infection density, that is the incidence rate of melioidosis per square kilometer from 2009 to 2018. The mean and standard deviation of the incidence rate of melioidosis per square kilometer are shown in Table 2. The areas of highest risk are shown in Figure 6 and Figure 7. The highest incidence density varied from 0.166−0.311 per square kilometer and 0.171–0.308 per square kilometer in 2010 and 2011, respectively. In 2017, the incidence density decreased (0.078–0.142 per square kilometer). The distribution maps also showed that the melioidosis distribution moved from the upper region to the center region over time.
Table 2. Mean and Standard deviation of the incidence rate of melioidosis per square kilometer.
|
Years |
2009 |
2010 |
2011 |
2012 |
2013 |
2014 |
2015 |
2016 |
2017 |
2018 |
|
Mean |
0.030 |
0.033 |
0.033 |
0.028 |
0.027 |
0.028 |
0.027 |
0.024 |
0.020 |
0.015 |
|
S.D. |
0.041 |
0.045 |
0.047 |
0.037 |
0.040 |
0.040 |
0.040 |
0.034 |
0.029 |
0.021 |
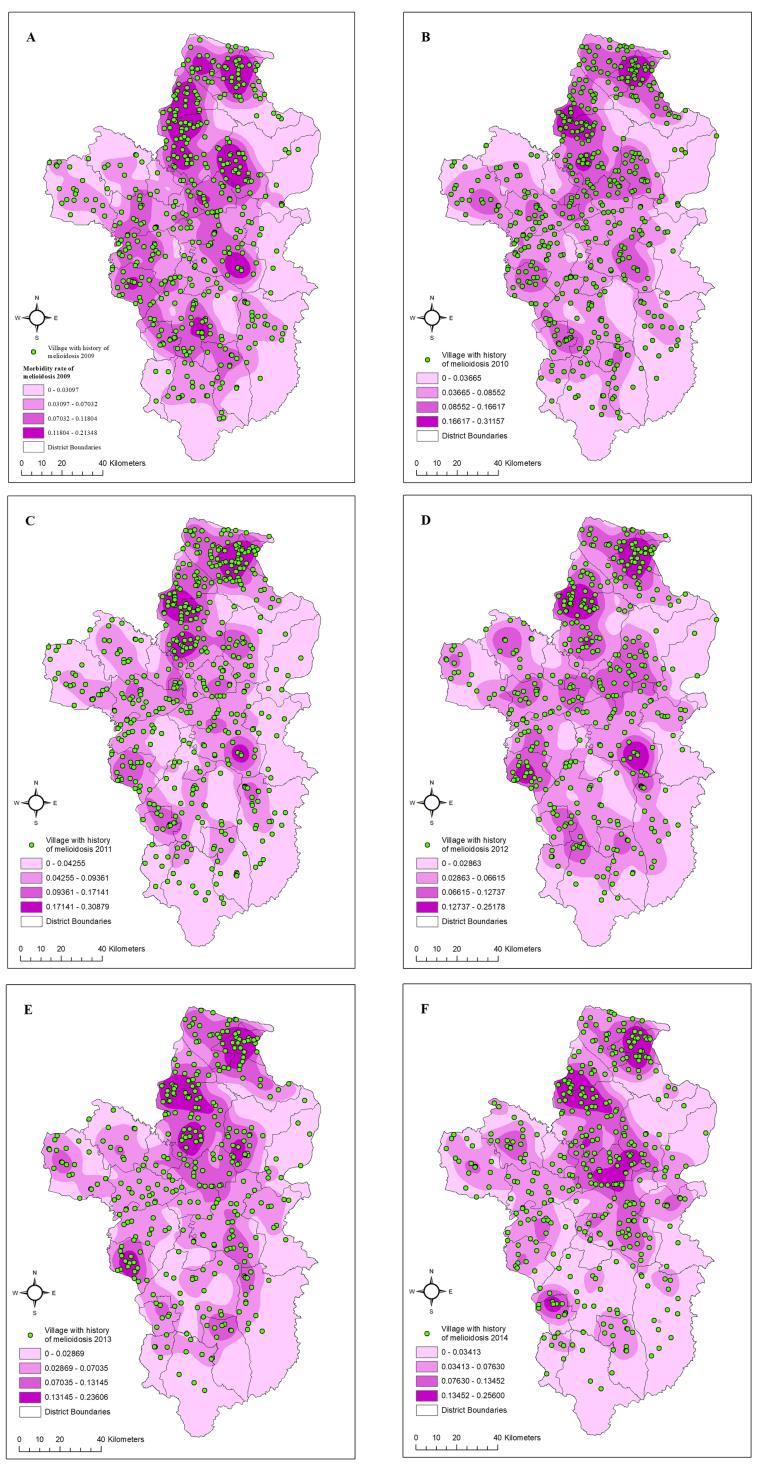
Figure 6. The geographic distribution of morbidity rate of melioidosis in 2009-2014; 6A 2009; 6B 2010; 6C 2011; 6D 2012; 6E 2013; 6F 2014.
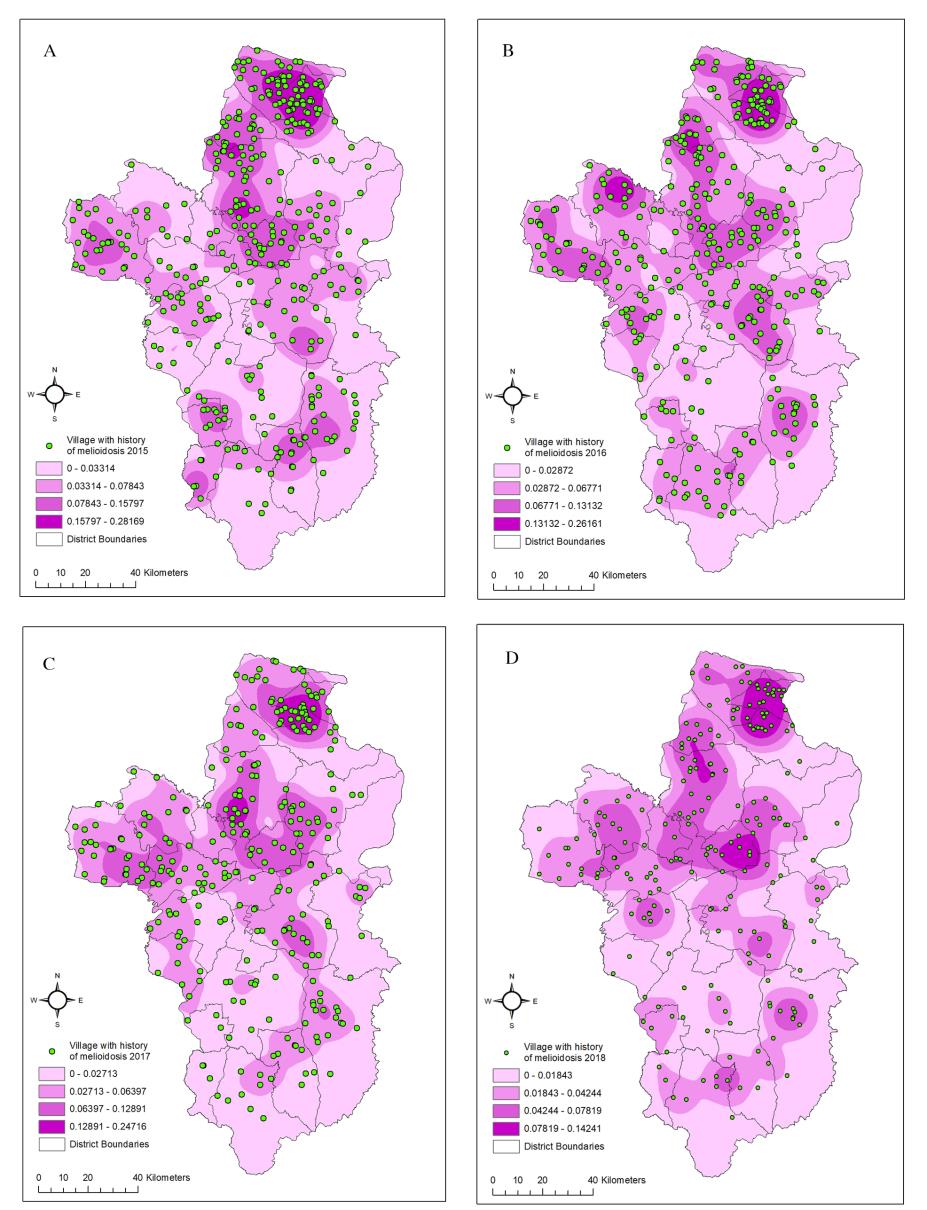
Figure 7. The geographic distribution of morbidity rate of melioidosis in 2015-2018; 7A 2015; 7B 2016; 7C 2017; 7D 2018.
The estimation mapping of average rainfall, maximum and minimum temperature were evaluated and compared by root mean square error (RMSE), mean absolute error (MAE), and coefficient of determination (R2) values and shown in Table 3. Then, the estimation mapping were extracted by the positions of the village where cases of melioidosis had been reported. The association between the incidence rates of melioidosis and meteorological factors are summarized in Table 4. According to the Spearman rank correlation coefficient, the incidence rate of melioidosis was significantly associated with rainfall in 2009, 2010, and 2015; with the maximum temperature in 2009, 2010, 2011, 2013 and 2015; and with the minimum temperature in 2010, 2011, and 2015.
Table 3. The assessment accuracy of the estimation probability mapping of rainfall, maximum and minimum temperature.
|
Years |
Rainfall |
Maximum Temperature |
Minimum Temperature |
|||||||||
|
R2 |
RMSE |
MAE |
R2 |
RMSE |
MAE |
R2 |
RMSE |
MAE |
|
|||
|
2009 |
0.147 |
122.436 |
31.613 |
0.595 |
0.004 |
0.001 |
0.041 |
0.311 |
0.104 |
|
||
|
2010 |
0.223 |
12.337 |
3.185 |
0.621 |
1.905 |
0.574 |
0.026 |
1.490 |
0.471 |
|
||
|
2011 |
0.558 |
22.367 |
5.775 |
0.332 |
0.744 |
0.224 |
0.174 |
0.253 |
0.080 |
|
||
|
2012 |
0.298 |
28.614 |
8.833 |
0.066 |
1.853 |
0.586 |
0.320 |
0.064 |
0.021 |
|
||
|
2013 |
0.263 |
92.118 |
11.868 |
0.247 |
0.087 |
0.026 |
0.006 |
0.061 |
0.019 |
|
||
|
2014 |
0.334 |
101.219 |
19.638 |
0.068 |
0.270 |
0.078 |
0.308 |
0.706 |
0.213 |
|
||
|
2015 |
0.729 |
44.500 |
8.420 |
0.286 |
3.501 |
1.011 |
0.112 |
1.203 |
0.347 |
|
||
|
2016 |
0.725 |
14.361 |
2.010 |
0.164 |
0.673 |
0.194 |
0.581 |
0.454 |
0.131 |
|
||
|
2017 |
0.535 |
16.362 |
3.412 |
0.056 |
1.709 |
0.493 |
0.653 |
0.150 |
0.045 |
|
||
|
2018 |
0.210 |
134.773 |
27.899 |
0.140 |
0.026 |
0.008 |
0.153 |
0.203 |
0.061 |
|
||
Table 4. Correlation between incidence rate of melioidosis and meteorological factors.
|
Years |
Rainfall |
Maximum Temperature |
Minimum Temperature |
|||||
|
Spearman Test |
P-value |
Spearman Test |
P-value |
Spearman Test |
P-value |
|
||
|
2009 |
−0.110 |
0.019* |
0.146 |
0.002* |
−0.052 |
0.266 |
|
|
|
2010 |
0.092 |
0.046* |
0.096 |
0.038* |
−0.181 |
0.000* |
|
|
|
2011 |
0.058 |
0.201 |
0.119 |
0.009* |
0.125 |
0.006* |
|
|
|
2012 |
0.043 |
0.393 |
−0.038 |
0.448 |
−0.003 |
0.953 |
|
|
|
2013 |
−0.009 |
0.859 |
−0.172 |
0.001* |
0.035 |
0.502 |
|
|
|
2014 |
0.095 |
0.066 |
0.032 |
0.536 |
−0.054 |
0.296 |
|
|
|
2015 |
0.139 |
0.0009* |
0.212 |
<0.001* |
−0.204 |
<0.001* |
|
|
|
2016 |
0.024 |
0.669 |
−0.084 |
0.129 |
−0.053 |
0.336 |
|
|
|
2017 |
−0.017 |
0.778 |
−0.047 |
0.423 |
0.045 |
0.446 |
|
|
|
2018 |
0.083 |
0.227 |
0.033 |
0.637 |
0.021 |
0.756 |
|
|
DISCUSSION
Melioidosis is an important disease and a public health problem in Ubon Ratchathani Province where outbreaks of melioidosis still occur. Melioidosis is caused by contacting, receiving or inhalation with B. pseudomallei bacteria contamination in soil and water. This study was designed to describe the epidemiology and spatial distribution of melioidosis based on meteorological factors. We described the epidemiology of monthly incidence rate of melioidosis for the period 2009–2018. The incidence rate of melioidosis showed that intensity in each month especially between June and September which is rainy season of Thailand had considerable increasing. Therefore, the rainy season reflects on the epidemiology of melioidosis and opportunity infects B. pseudomallei of human. Previous study found bacteria B. pseudomallei more in dry season and rainy season (Wuthiekanun et al., 1995), especially distribution in all region of Thailand from August to December which is the rainy and winter season (Vuddhakul et al., 1999). In addition, Ubon Ratchathani, Northeast Thailand, B. pseudomallei is present in paddy soil at the start of the rainy season (Wuthiekanun et al., 2009). In contrast, the melioidosis incidence found association with rainfall (Mu et al., 2014; Liu et al., 2015; Kaestli et al., 2016), according to a number patient of melioidosis correlated with a monthly rainfall during 2001-2006 in Nakon Phanom, Thailand (Tanwisaid and Surin, 2008). In addition, a number patient of melioidosis associated with humidity and wind in Lao, while a day of rainfall and wind in Cambodia (Bulterys et al., 2018). Finding in this study, rainfall was no significantly associated with incidence rate of melioidosis. In Figure 3, we considered a possibility a variation in melioidosis incidence. However, it found still outbreaks in each month. The seasons of Thailand are divided in three seasons, namely a dry season (mid-February to mid-May), a rainy season (mid-May to mid-October), and a cold season (mid-October to mid-February). The result showed that the incidence of melioidosis was highest from July to December, which include the rainy and cold seasons. However, the incidence rate of melioidosis decreased slightly during the dry season decreasing and the increased up through the rainy season. During the cold season, farmers can become infected during harvesting activities. The maximum and minimum temperature in each month is related incidence rate of melioidosis. The results showed that temperature affects to the likelihood of infection.
The spatial distribution of the incidence rate of melioidosis revealed a cluster pattern on the upper and rather center region this area. It would be useful to study the spatial distribution further because this could be used to detect outbreaks in an endemic area. In addition, it may support staff of public health office for monitoring distribution of melioidosis outbreaks in area. The climate data was limited positions of weather station, so it was estimated distribution rainfall, maximum and minimum temperature with elevation data by Co-Kriging interpolation method. Previous studies have also revealed strong associations between melioidosis incidence and climate factors (Currie et al., 2000; Currie and Jacups, 2003; Kaestli et al., 2016) conducted a retrospective study of the correlation between melioidosis incidence and climate factors in Australia over a 23-year period, and found that the rainfall, temperature and cloud cover correlated with an increased incidence of melioidosis. In Cambodia, rainy days and wind speed were significantly associated with melioidosis incidence (Bulterys et al., 2018). We found that although the melioidosis incidence was associated with rainfall, maximum, and minimum temperatures, in several years such as 2016- 2018 the associations were not statistically significant, which may be caused by different rate of rainfall in the individual village high incidence of melioidosis. The lack of the expected association may have been due to abnormal weather phenomena. Likewise, the maximum and minimum temperatures may have shown limited variation. However, the temperature has influenced to increase soil moisture. It is increasing the opportunities for B. pseudomallei exposure. The consensus guidelines for environmental sampling of B. pseudomallei and previous studies have recommended a temperature of 40°C as an appropriate condition, but pathogen bacteria can survive in 37-42°C (Tong et al., 1996; Limmathurotsakul et al., 2013), meanwhile decreasing temperatures could delay the growth at 25°C (Paksanont et al., 2018). Therefore, B. pseudomallei is to lerance for various environmental condition. Humans are infected from B. pseudomallei through skin, inhalation and ingestion.21
CONCLUSION
We studied the variations in the incidence rate of melioidosis in a region over a 10-year period. The incidence rate decreased over the study period but remained relatively high. The monthly incidence rate of melioidosis was associated with the meteorological data and was highest during the rainy season. The incidence density mapping of melioidosis illustrates the spatial distribution and identifies hot-spots and high-risk areas which were significantly associated with the local probability of rainfall, and the maximum and minimum temperatures. The analysis showed a seasonal pattern in the incidence of melioidosis. This mapping approach may support surveillance of melioidosis.
ACKNOWLEDGEMENTS
We would also like to express thanks to College of Medicine and Public Health, Ubon Ratchathani University for their academic supports.
CONFLICT OF INTEREST
The authors declare no conflict of interest.
REFERENCES
Adhikary, S.K., Muttil, N., and Yilmaz, A.G. 2017. Cokriging for enhanced spatial interpolation of rainfall in two Australian catchments. Hydrological Processes. 31: 2143-2161.
Bulterys, P., Bulterys, M.A., Phommasone, K., Luangraj, M., Mayxay, M., Kloprogge, S., Miliya, T., Vongsouvath, M., Newton, P.N., Phetsouvanh, R., et al. 2018. Climate drivers of melioidosis in Laos and Cambodia: a 16–year case series analysis. Lancet Planet Health. 2: 334-343.
Chaowagul, W., White, N.J., Dance, D.A., Wattanagoon, Y., Naigowit, P., Davis, T.M., Looareesuwan, S., and Pitakwatchara, N. 1989. Melioidosis: a major case of community-acquired septicemia in northeastern Thailand. Journal of Infectious Diseases. 159: 890-899.
Currie, B.J., Dance, D.A., and Cheng, A.C. 2008. The global distribution of Burkholderia pseudomallei and melioidosis: An update. Transactions of the Royal Society of Tropical Medicine and Hygiene. 102(Suppl 1): S1-4.
Currie, B.J., Fisher, D.A., Howard, D.M., Burrow, J.N., Selvanayagam, S., Snelling, P.L., Anstey, N.M., and Mayo, M.J. 2000. The epidemiology of melioidosis in Australia and Papua New Guinea. Acta Tropica. 74: 121-127.
Currie, B.J., and Jacups, S.P. 2003. Intensity of rainfall and severity of melioidosis, Australia. Emerging Infectious Diseases. 9: 1538-1542.
Currie, B.J., Jacups, S.P., Cheng, A.C., Fisher, D.A., Anstey, N.M., Huffam, S.E., and Krause, V.L. 2004. Melioidosis epidemiology and risk factors from a prospective whole-population study in northern Australia. Tropical Medicine and International Health. 9:1167-1174.
Kaestli, M., Grist, E.P.M., Waed, L., Hill, A., Mayo, M., and Currie, B.J. 2016. The association of melioidosis with climatic factors in Darwin, Australia: A 23-year time-series analysis. Infection. 72: 687-697.
Kaestli, M., Mayo, M., Harrington, G., Ward, L., Watt, F., Hill, JV., Cheng, A.C., and Currie, B.J. 2009. Landscape changes influence the occurrence of the melioidosis bacterium Burkholderia pseudomallei in soil in northern Australia. PLOS Neglected Tropical Diseases. 3: e364.
Limmathurotsakul, D., Dance, D.A., Wuthiekanun, V., Kaestli, M., Mayo, M., Warner, J., Wagner, D.M., Tuanyok, A., Wertheim, H., Yoke, C.T., et al. 2013. Systematic review and consensus guidelines for environmental sampling of Burkholderia pseudomallei. PLOS Neglected Tropical Diseases. 7: e2105.
Limmathurotsakul, D., Wongratanacheewin, S., Teerawattanasook, N., Wongsuvan, G., Chaisuksant, S., Chetchotisakd, P., Chaowagul, W., Day, N.P., and Peacock, S.J. 2010. Increasing incidence of human melioidosis in Northeast Thailand. American Journal of Tropical Medicine and Hygiene. 82: 1113-1117.
Liu, X., Pang, L., Sim, S.H., Goh, K.T., Ravikumar, S., Win, M.S., Tan, G., Cook, A.R., Fisher, D., and Chai, L.Y. 2015. Association of melioidosis incidence with rainfall and humidity, Singapore, 2003-2012. Emerging Infectious Diseases. 21: 159-162.
Mu, J.J., Cheng, P.Y., Chen, Y.S., Chen, P.S., and Chen, Y.L. 2014. The occurrence of melioidosis is related to different climatic conditions in distinct topographical areas of Taiwan. Epidemiology and Infection. 142: 415-423.
Ong, C.E., Wongsuvan, G., Chew, J.S., Kim, T.Y., Teng, L.H., Amornchai, P., Wuthiekanun, V., Day, N.P.J., Peacock, S.J., Cheng, T.Y., et al. 2017. Presence of Burkholderia pseudomallei in soil and paddy rice water in a rice field in northeast Thailand, but not in air and rainwater. The American Journal of Tropical Medicine and Hygiene. 97: 1702-1705.
Paksanont, S., Sintiprungrat, K., Yimthin, T., Pumirat, P., Peacock, S.J., and Chantratita, N. 2018. Effect of temperature on Burkholderia pseudomallei growth, proteomic changes, motility and resistance to stress environments. Scientific Reports. 8: 9167.
Palasatien, S., Lertsirivorakul, R., Royros, P., Wongratanacheewin, S., and Sermswan, R.W. 2008. Soil physicochemical properties related to the presence of Burkholdoria pseudomallei. Transactions of the Royal Society of Tropical Medicine and Hygiene. 102(Suppl 1): S5-9.
Rolim, D.B., Vilar, D.C., Sousa, A.Q., Miralles, I.S., De Oliveira, D.C., Harnett. G., O'Reilly, L., Howard, K., Sampson, I., and Inglis, T.J. 2005. Melioidosis, northeastern Brazil. Emerging infectious disease. 11: 1458-1460.
Suebrasri, T., Wang-ngarm, S., Chareonsudjai, P., Sermswan, R.W., and Chareonsudjai, S. 2013. Seasonal variation of soil environmental characteristics affect the presence of Burkholderia pseudomallei in Khon Kaen, Thailand. African Journal of Microbiology Research. 7. 1940-1945.
Suputtamongkol, Y., Hall, A.J., Dance, D.A., Chaowagul, W., Rajchanuvong, A., Smith, M.D., and White, N.J. 1994. The epidemiology of melioidosis in Ubon Ratchathani, Northeast Thailand. International Journal of Epidemiology. 23: 1082-1090.
Tanwisaid, K., and Surin, U. 2008. Monthly rainfall and severity of melioidosis in Nakhon Phanom, Northeastern Thailand. Journal of Health Sciences. 17: 363-375.
Tong, S., Yang, S., Lu, Z., and He, W. 1996. Laboratory investigation of ecological factors influencing the environmental presence of Burkholderia pseudomallei. Microbiol Immunol. 40: 451-453.
Vuddhakul, V., Tharavichitkul, P., Na-Ngam, N., Jitsurong, S., Kunthawa, B., Noimay, P., Noimay, P., Binla, A., and Thamlikitkul, V. 1999. Epidemiology of Burkholderia pseudomallei in Thailand. American Journal of Tropical Medicine and Hygiene. 60: 458-461.
Wuthiekanun, V., Limmathurotsakul, D., Chantratita, N., Feil, E.J., Day, N.P.J., and Peacock, S.J. 2009. Burkholderia pseudomallei is genetically diverse in agricultural land in northeast Thailand. PLOS Neglected Tropical Diseases. 3: e496.
Wuthiekanun, V., Smith, M.D., Dance, D.A., and White, N.J. 1995. Isolation of Pseudomonas pseudomallei from soil in north-eastern Thailand. Transactions of the Royal Society of Tropical Medicine and Hygiene. 89: 41-43.
Yue, Y., Sun, J., Liu, X., Ren, D., Liu, Q., Xiao, X., and Lu, L. 2018. Spatial analysis of dengue fever and exploration of its environmental and socio-economic risk factors using ordinary least squares: A case study in five districts of Guangzhou City, China, 2014. International Journal of Infectious Diseases. 75: 39-48.
OPEN access freely available online
Chiang Mai University Journal of Natural Sciences [ISSN 16851994]
Chiang Mai University, Thailand
https://cmuj.cmu.ac.th
Jaruwan Wongbutdee, Wacharapong Saengnill*, Jutharat Jittimanee, Pawana Panomket, and Phairo Saenwang
College of Medicine and Public Health, Ubon Ratchathani University, Warin Chamrap District, Ubon Ratchathani, Thailand, 34190
Corresponding author: Wacharapong Saengnill, E-mail: watcharapong.s@ubu.ac.th
Total Article Views
Editor: Korakot Nganvongpanit,
Chiang Mai University, Thailand
Article history:
Received: October 20, 2020;
Revised: June 29, 2021;
Accepted: July 17, 2021;