 ISSN: 2822-0838 Online

Growth Rate Prediction of Ornamental Trees using Regression Functions in Urban Landscapes
Ramin Abbasgholizadeh, Ali Reza Eslami*, and Behzad KavianiPublished Date : 2021-09-13
DOI : https://doi.org/10.12982/CMUJNS.2021.080
Journal Issues : Number 4, October-December 2021
Abstract The present study aimed to predict the growth rate of the common urban trees using mathematical equations for the right plantation location in the landscape. Ginkgo biloba, Liquidambar styraciflua L., Parrotia persica, Zelkova carpinifolia, Acer negundo, and Fraxinus rotundifolia Mill. were selected from city of Rasht, Guilan province, in the northern part of Iran. The study used age as the independent variables and height, trunk height, and crown diameter as the dependent variables. The correlation among the variables were analyzed by different regressions (linear, logarithmic, exponential, power, and polynomial). The results showed that polynomial regression functions provided the best determination coefficient to predict the growth parameters with respect to age in the urban green spaces for aesthetic purposes and also, to reduce costs, tackle interference with transit, urban equipment, and finally developing ecosystems sustainably. Polynomial regression functions can be used to predict tree growth in new urban green spaces in terms of environmental factors and age.
Keywords: Ecosystems sustainably, Green space, Growth rate, Urban landscape, Ornamental trees
Citation: Abbasgholizadeh, R., Eslami, A.R., and Kaviani, B. 2021. Growth rate prediction of ornamental trees using regression functions in urban landscapes. CMU J. Nat. Sci. 20(4): e2021080.
INTRODUCTION
A major side-effect of urban development is the exacerbation of environmental pollution that, in turn, contributes to the destruction of intra-urban green spaces and their land-use (Bahram Soltani, 2016). Lifestyle change and its complexity and human relationships have necessitated the changes in lifestyle (Lotfi et al., 2010). Nowadays, the green-space land use is of significant importance due to its impacts on the physical, mental and social health of citizens (Yaripour and Hadizadeh Zargar, 2015). Trees can contribute to improving the efficiency of this land use by the key role they play in green spaces. Green spaces that accompany the network of urban roads and thus, they appear as a green network in aerial images are regarded as green elements that act on the macro scale. In urban designing, adequate space should be allocated to the green spaces – i.e. the spaces where plants with certain habitat needs can growth safely (Bahram Soltani, 2016). It is essential to consider adequate space for plants during their planting. For example, adequate space should be assigned to long-living trees as this is important in secondary designing of flooring and gardening of the urban spaces. The designing of plants is effective with respect to the diversity and quality of texture, color, denseness, and scent that it creates and increases the use of environment unexpectedly (Majedi et al., 2010).
Recent decades have witnessed the burse of interest in growing trees with the expansion of green spaces. On the one hand, this can be explained by the fact that trees help to meet many ecosystems needs and benefits such as cooling, filtering harmful particles in the air, and providing aesthetic elements at the local level (Mullaney et al., 2015; Escobedo et al., 2011). On the other hand, urban trees expose losses such as their falling and damage to traffic road and the breaking of branches which can impose extra costs and jeopardize public safety (Mcpherson and Muchnick, 2005). Given the advantages and disadvantages, it is very interesting for urban planners and managers to consider urban trees and their space requirements. First, it is necessary to identify the future space needs of the existing trees at certain ages. Second, it is important for future planning to determine the growing space needs of tree species before their planting in a certain place. Eventually, data on tree growth should be provided for horticultural activities to assure public safety (Quigley, 2002). Although, forest trees have been subject to extensive research, few studies have focused on the development of the space for urban trees (individual and open trees). In addition, just some studies have compared the allometry and biomass of forest and urban trees (Mchale et al., 2009).
Nowadays, the increasing population of cities has led planners to explore different scenarios for organizing and comforting citizens (Jamei and Rajagopalan, 2018). One of the cases that urban officials consider for the comfort of citizens is the urban green space (Mattijssen et al., 2017; Aalbers and Sehested, 2018). The importance of urban green space may only become apparent over time and is obvoius to everyone (Riechers et al., 2019). Trees are a vital element of urban green space (Cariñanos et al., 2019; Hami et al., 2019). How trees are planted in urban areas is of particular importance to urban microclimates (Moser-Reischl et al., 2019). The effects of tree planting on urban space include temperature regulation, increased biodiversity, air quality, flood prevention, air carbon storage, and noise pollution reduction (Reis and Lopes, 2019).
Trees are highly diverse and each one has a meaning and symbolizes something specific. Some trees are deciduous and some are evergreen. This gives a city various views for the citizens over a year (Hedman, 1985). Trees make urban spaces more beautiful and organize the scattered structure of these spaces. Trees and other plants species have dramatic diversity and each plant has its own meaning and concept and is a symbol of a particular subject. Some trees are deciduous and some are evergreen, and this gives different views to urban spaces over a year. Trees like gingko (Ginkgo biloba), sweet gum (Liquidambar styraciflua L.), Persian iron wood (Parrotica persica), Caucasian elm (Zelkova carpinifolia), Boxelder maple (Acer negundo), and ash (Fraxinus rotundifolia Mill) are important for urban landscapes. The present research aimed to predict the growth rate of these six species by mathematical equations for the better use in the green spaces of the city of Rasht, Iran. Given the importance of this issue, the present study explored the growth rate of the major trees in urban green spaces to plan their application.
MATERIALS AND METHODS
The research is an applied study in terms of methodology, a comparative study in terms of objective, and in-person study in terms of observation. The study focused on six ornamental plant species in the green spaces of Rasht including gingko (Ginkgo biloba), sweet gum (Liquidambar styraciflua L.), Persian iron wood (Parrotica persica), Caucasian elm (Zelkova carpinifolia), Boxelder maple (Acer negundo), and ash (Fraxinus rotundifolia Mill). The measured parameters included age, total height (from the ground to the apex of the highest vertical branch), trunk height (from the ground to the lowest leaves of the crown), crown height and diameter (the average diameter in the directions parallel and perpendicular to the trunk), and the inter-plant spacing of the trees (Figure 1). The height of the extremely tall trees was measured using an inclinometer by the Pythagorean Theorem. So, the inclinometer was used to determine the slope from the apex of the tree to the horizon and from the tree base to the horizon. Then, they were placed in the following equation to obtain the tree height:
H = B (Tg α -Tg β
In which, “H” is the plant height, “B” is the horizontal distance to the tree in cm, “Tgβ” is the slope percentage of the tree base, and “Tgα” is the slope percentage of the tree apex. The age was determined from the planting time of the tree as per the official statistics and expert opinions. In cases where the age of the trees was not available, it was approximately calculated from the equation of tree circumference as below:
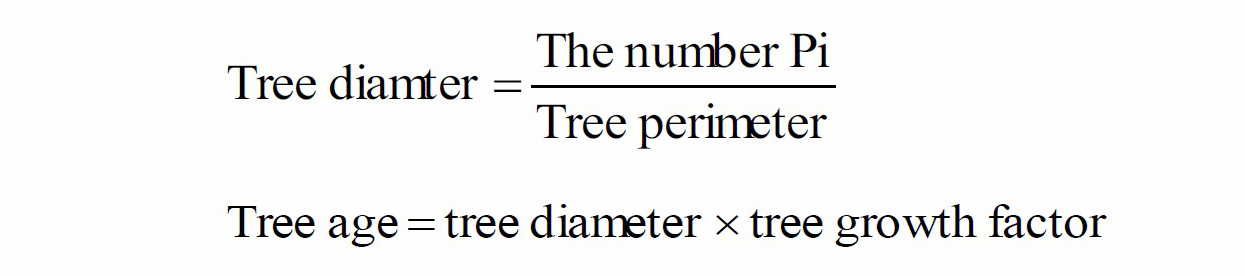
Total height (from the ground to the apex of the highest vertical branch), tree trunk height (from the ground to the lowest crown leaves), crown height, and crown diameter (the average diameter in the directions parallel and perpendicular to the trunk) and the inter-plant spacing were measured by a simple and laser-equipped ruler. Tree growth factor varied with the tree and it was measured as regression by Zhanga et al. (2004) method (Figure 1).
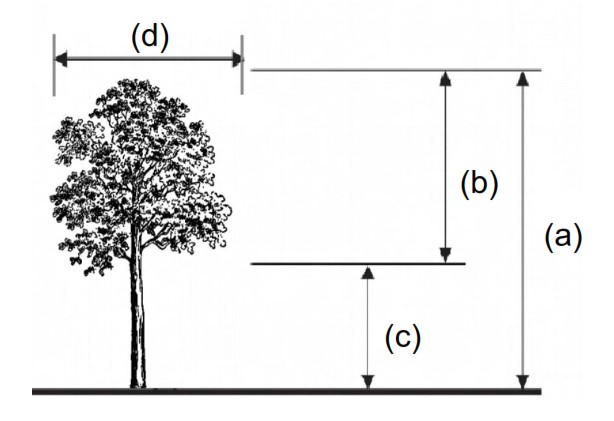
Figure 1. Measurement dimensions for each tree. a) total height, b) crown height, c) trunk height, d) crown diameter (Karimian, 2015).
The number of studied trees varied from 30 to 50 in which different regression fitting models (linear, polynomial, exponential, and logarithmic) were tested.
To explain the regression relationship, the coefficients of variation, explanation and width of the origin were used. In the meantime, for each regression graph that had a higher coefficient of explanation was considered as the basis for regression prediction (R2). Considering that the relationship between age and total plant height was of special importance to us, its regression relationship with the graph was shown.
The studied trees were randomly selected from the trees grown in the green spaces of Rasht. They were sampled during the green growing season. The regression fitting models (linear, polynomial, exponential, and logarithmic) were performed in the MS-Excel software package.
RESULTS
Among the studied trees, Caucasian elms had the highest average age of 27.53 years and Persian iron woods had the lowest one with 4.6 years. The highest and lowest average heights were related to Caucasian elms and Box elder maples with plant heights of 23.47 and 3.72 m, respectively. Caucasian elms had the highest average crown diameter (11.47 m) too, whereas the lowest was 2.23 m related to sweet gums (Table 1).
Table 1. The brief results of the descriptive statistics for age, total height, trunk height, crown height, and crown diameter of the studied trees.
|
Age |
Total height |
Trunk height |
Crown height |
Diameter of crown |
Index |
Trees |
|
15.13 |
4.73 |
2.13 |
2.60 |
3.44 |
Average |
Ginkgo biloba |
|
3.40 |
1.34 |
0.80 |
0.60 |
0.72 |
Standard deviation |
|
|
15.50 |
4.91 |
2.27 |
2.66 |
3.51 |
MSE |
|
|
4.60 |
7.95 |
2.72 |
5.23 |
2.27 |
Average |
Parrotica persica |
|
2.25 |
2.46 |
0.64 |
1.85 |
0.37 |
Standard deviation |
|
|
5.11 |
8.31 |
2.79 |
5.54 |
2.29 |
MSE |
|
|
12.27 |
5.12 |
2.18 |
2.93 |
2.23 |
Average |
Liquidambar styraciflua L. |
|
1.72 |
1.37 |
0.96 |
0.45 |
0.31 |
Standard deviation |
|
|
12.38 |
5.29 |
2.38 |
2.97 |
2.25 |
MSE |
|
|
27.53 |
23.47 |
18.47 |
5.00 |
11.47 |
Average |
Zelkova carpinifolia |
|
3.80 |
4.04 |
3.13 |
0.95 |
4.49 |
Standard deviation |
|
|
27.79 |
23.8 |
18.72 |
5.09 |
12.29 |
MSE |
|
|
19.17 |
8.37 |
3.35 |
5.02 |
6.17 |
Average |
Fraxinus rotundifolia Mill |
|
3.99 |
2.30 |
0.86 |
1.49 |
0.76 |
Standard deviation |
|
|
19.56 |
8.67 |
3.46 |
5.23 |
6.21 |
MSE |
|
|
6.37 |
3.72 |
2.42 |
1.30 |
3.02 |
Average |
Acer negundo |
|
2.03 |
0.96 |
0.82 |
0.52 |
0.68 |
Standard deviation |
|
|
6.67 |
3.84 |
2.55 |
1.40 |
3.09 |
MSE |
Gingko (Ginkgo biloba)
The highest coefficient of determination for recognizing and predicting height growth with respect to age in the gingko trees was related to the polynomial regression (Figure 2) (in which it was 0.8481. This regression had the highest determination coefficient (0.8242) for identifying and predicting truck growth prediction in terms of age, too. Also, the polynomial regression provided the best prediction of crown diameter growth with respect to age, showing a determination coefficient of 0.6918 (Table 2).
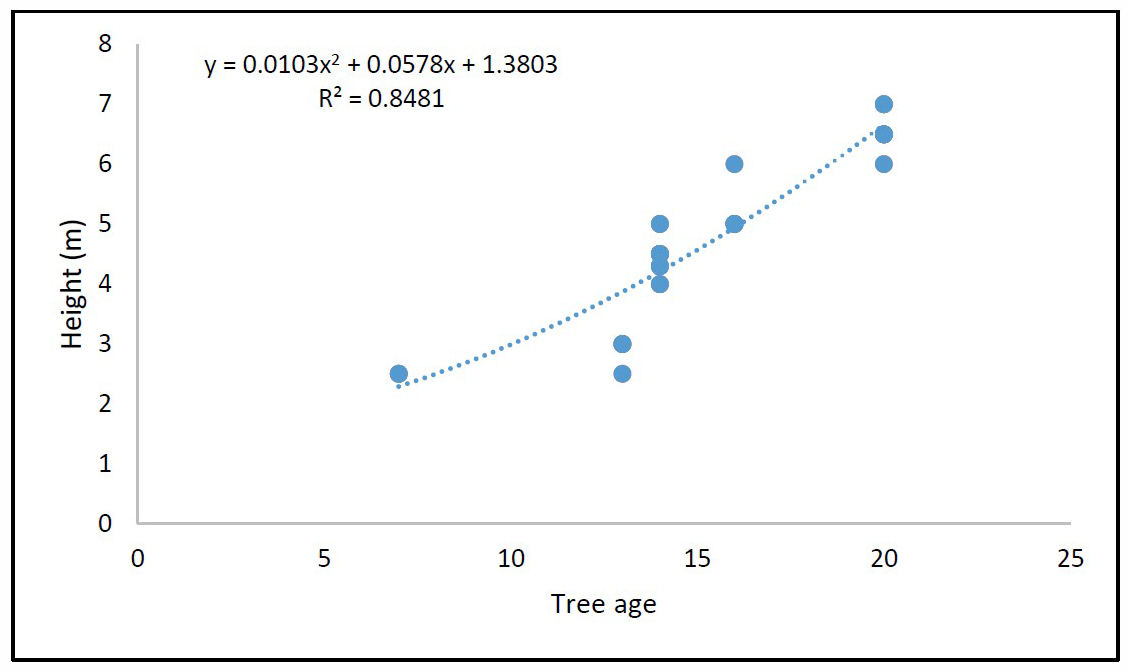
Figure 2. Regression diagram between age and total tree height (Ginkgo biloba).
Table 2. Regression equations for Ginkgo biloba trees.
|
R2 |
regression equations |
Type of equation |
Parameters |
|
0.8303 |
y=0.3597x-0.714 |
Linear |
Age × total height |
|
0.8481 |
y=0.0103x2+0.0578X+1.3803 |
Polynomial |
|
|
0.8012 |
y=1.3365e0.0807x |
Exponential |
|
|
0.7405 |
y=4.526ln(x)-7.4399 |
Logarithmic |
|
|
0.7577 |
y=0.2726x1.0455 |
Power |
|
|
0.779 |
y=0.2071x-1.0004 |
Linear |
Age × trunk height |
|
0.8241 |
y=0.0098x2-0.0799x+0.99 |
Polynomial |
|
|
0.7345 |
y=0.4204e0.1024 |
Exponential |
|
|
0.6683 |
y=2.5558ln(x)-4.7377 |
Logarithmic |
|
|
0.6728 |
y=0.0591x1.306 |
Power |
|
|
0.6711 |
y=0.1724x+0.8347 |
Linear |
Age × crown diameter |
|
0.6918 |
y=0.0059x2-0.0015x+2.0412 |
Polynomial |
|
|
0.6568 |
y=1.5593e0.0509x |
Exponential |
|
|
0.5859 |
y=2.1461ln(x)-2.3264 |
Logarithmic |
|
|
0.5855 |
y=0.6021x0.6406 |
Power |
Note: R2: Coefficient of determination, x and y: regression line equation. There is a significant relationship (positive correlation) between age and total tree height, crown diameter and trunk diameter in Ginkgo biloba. That is, with age, according to the regression formula, the total height of the tree, crown diameter and diameter also increase. The value of R2 specifies the degree of this correlation. Given that in 5 types of regression formulas, the R2 polynomial coefficient is the highest, this formula is used for prediction. That is, by increasing 1 X unit (age), the amount of height, crown diameter and trunk diameter are determined according to the regression formula.
Persian iron wood (Parrotia persica)
The logarithmic regression turned out to perform the best in predicting plant growth with respect to age with a determination coefficient of 0.9192 (Figure 3). The best regression to predict truck height against age was polynomial. Its coefficient of determination was found to be 0.8368. Also, the highest coefficient of determination (0.8794) for determining and predicting crown diameter in terms of age was for the polynomial regression (Table 3).
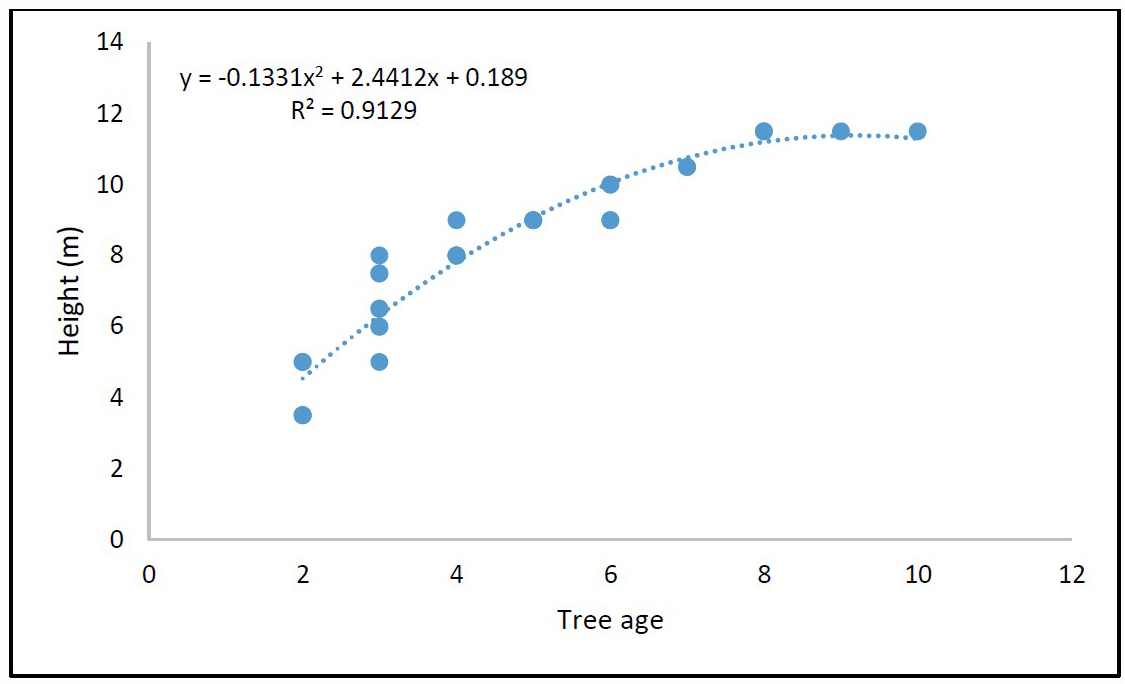
Figure 3. Regression diagram between age and total tree height (Parrotia persica).
Table 3. Regression equations for Parrotia persica trees.
|
R2 |
regression equations |
Type of equation |
Parameters |
|
3.8378 |
y=1.0014x+3.3438 |
Linear |
Age × total height |
|
0.9129 |
y=-0.1331x2+2.4412x+0.189 |
Polynomial |
|
|
0.7162 |
y=4.0509e0.1344x |
Exponential |
|
|
0.9192 |
y=4.8317ln(x)+1.1299 |
Logarithmic |
|
|
0.8443 |
y=2.9103x0.6724 |
Power |
|
|
0.7271 |
y=0.2418x+1.6042 |
Linear |
Age × trunk height |
|
0.8368 |
y=-0.0417x2+0.6932x+0.6152 |
Polynomial |
|
|
0.6494 |
y=1.7041e0.0946x |
Exponential |
|
|
0.8336 |
y=1.192ln(x)+1.0329 |
Logarithmic |
|
|
0.7805 |
y=1.3415x0.4778 |
Power |
|
|
0.8659 |
y=0.1508x+1.5729 |
Linear |
Age × crown diameter |
|
0.8794 |
y=0.0084x2+0.0603x+1.7713 |
Polynomial |
|
|
0.8651 |
y=1.6791e0.0627 |
Exponential |
|
|
0.7568 |
y=0.6495ln(x)+1.3499 |
Logarithmic |
|
|
0.7678 |
y=1.5259x0.2721 |
Power |
Note: R2: Coefficient of determination, x and y: regression line equation. There is a significant relationship (positive correlation) between age and total tree height, crown diameter and trunk diameter in Parrotia persica. That is, with age, according to the regression formula, the total height of the tree, crown diameter and diameter also increase. The value of R2 specifies the degree of this correlation. Given that in 5 types of regression formulas, the R2 polynomial coefficient is the highest, this formula is used for prediction. That is, by increasing 1 X unit (age), the amount of height, crown diameter and trunk diameter are determined according to the regression formula.
Sweet gum (Liquidambar styraciflua)
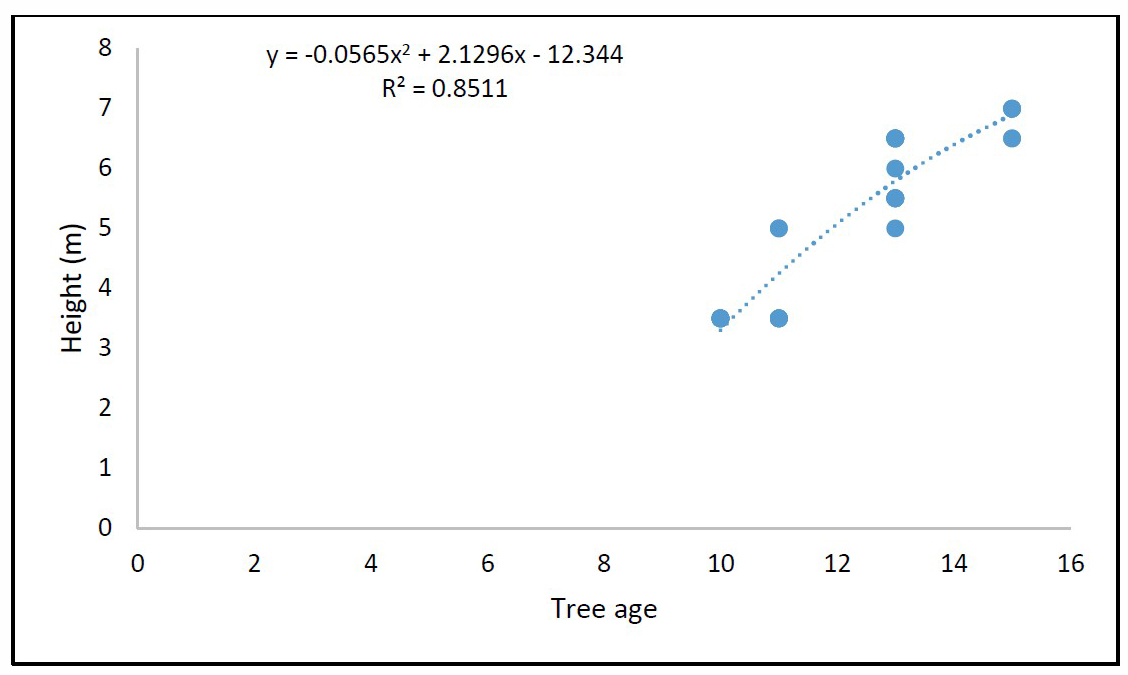
The plant height, trunk height, and crown diameter of this tree were best determined and predicted in terms of age by the polynomial regression, which showed determination coefficients of 0.8511, 0.8282, and 0.6366, respectively (Table 4). The best prediction of polynomial regression was for the relationship between height and tree age (0.8511) (Figure 4).
 .
.
Figure 4. Regression diagram between age and total tree height (Liquidambar styraciflua).
Table 4. Regression equations for Liquidambar styraciflua trees.
|
R2 |
regression equations |
Type of equation |
Parameters |
|
0.8389 |
y=0.7282x-3.8214 |
Linear |
Age × total height |
|
0.8511 |
y=-0.056x2+2.1296X-12.344 |
Polynomial |
|
|
0.8389 |
y=0.798e0.1485x |
Exponential |
|
|
0.8471 |
y=8.9579ln(x)-17.254 |
Logarithmic |
|
|
0.8389 |
y=0.0509x1.8315 |
Power |
|
|
0.8065 |
y=0.5012x-3.9643 |
Linear |
Age × trunk height |
|
0.8282 |
y=-0.053x2+1.8155x-11.96 |
Polynomial |
|
|
0.7669 |
y=0.0744e0.2658x |
Exponential |
|
|
0.8189 |
y=6.1786ln(x0-13.247 |
Logarithmic |
|
|
0.7871 |
y=0.0005x3.2945 |
Power |
|
|
0.5981 |
y=0.1413x+0.5 |
Linear |
Age × crown diameter |
|
0.6366 |
y=0.0231x2-0.4312x+3.9826 |
Polynomial |
|
|
0.6058 |
y=1.0543e0.0605x |
Exponential |
|
|
0.0577 |
y=1.698ln(x)-2.0072 |
Logarithmic |
|
|
0.5864 |
y=0.3595x0.7278 |
Power |
Note: R2: Coefficient of determination, x and y: regression line equation. There is a significant relationship (positive correlation) between age and total tree height, crown diameter and trunk diameter in Liquidambar styraciflua. That is, with age, according to the regression formula, the total height of the tree, crown diameter and diameter also increase. The value of R2 specifies the degree of this correlation. Given that in 5 types of regression formulas, the R2 polynomial coefficient is the highest, this formula is used for prediction. That is, by increasing 1 X unit (age), the amount of height, crown diameter and trunk diameter are determined according to the regression formula.
Caucasian elms (Zelkova carpinifolia)
The highest coefficient of correlation to recognize and predict plant height in terms of age was 0.8881 related to the polynomial regression (Figure 5). The same regression showed the highest determination coefficient of 0.9031 for the prediction of trunk height with respect to age. As far as the prediction of crown diameter against age was concerned, again the polynomial regression exhibited the highest determination coefficient of 0.8037 (Table 5).
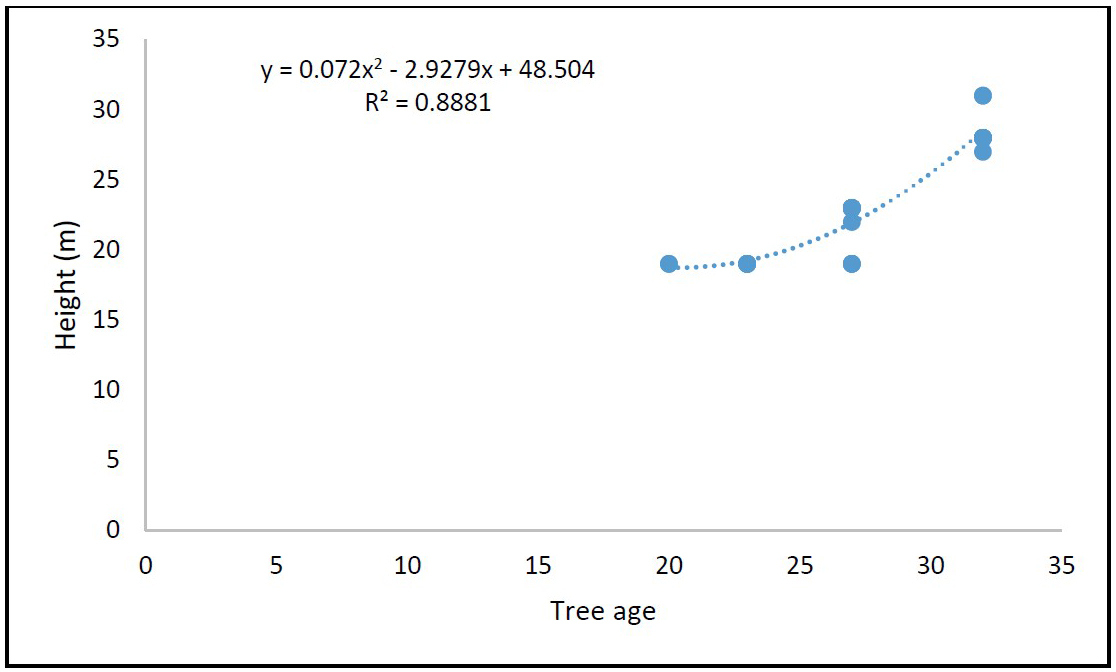
Figure 5. Regression diagram between age and total tree height (Zelkova carpinifolia).
Table 5. Regression equations for Zelkova carpinifolia trees.
|
R2 |
regression equations |
Type of equation |
Parameters |
|
0.8189 |
y=0.962x-3.0208 |
Linear |
Age × total height |
|
0.881 |
y=0.07022x2-2.9279x+48.504 |
Polynomial |
|
|
0.8265 |
y=7.5451e0.0407x |
Exponential |
|
|
0.7797 |
y=24.922ln(x)-58.92 |
Logarithmic |
|
|
0.0791 |
y=0.7012x1.0577 |
Power |
|
|
0.832 |
y=0.7498x-2.179 |
Linear |
Age × trunk height |
|
0.9032 |
y=0.0569x2-2.3271x+38.577 |
Polynomial |
|
|
0.8358 |
y=6.0027e0.0403x |
Exponential |
|
|
0.7908 |
y=19.419ln(x)-45.729 |
Logarithmic |
|
|
0.7993 |
y=0.5711x1.0474 |
Power |
|
|
0.7503 |
y=1.0216x-16.662 |
Linear |
Age × crown diameter |
|
0.8037 |
y=0.0707x2-2.7994x+33.95 |
Polynomial |
|
|
0.7915 |
y=0.8618e0.0913 |
Exponential |
|
|
0.7165 |
y=26.52ln(x)-76.201 |
Logarithmic |
|
|
0.7699 |
y=0.0039x2.3929 |
Power |
Note: R2: Coefficient of determination, x and y: regression line equation. There is a significant relationship (positive correlation) between age and total tree height, crown diameter and trunk diameter in Zelkova carpinifolia. That is, with age, according to the regression formula, the total height of the tree, crown diameter and diameter also increase. The value of R2 specifies the degree of this correlation. Given that in 5 types of regression formulas, the R2 polynomial coefficient is the highest, this formula is used for prediction. That is, by increasing 1 X unit (age), the amount of height, crown diameter and trunk diameter are determined according to the regression formula.
Ash (Fraxinus rotundifolia Mill.)
The plant height growth of this tree was best predicted in terms of age with the polynomial regression, exhibiting a determination coefficient of 0.9019 (Figure 6). This type of regression provided a good prediction of its trunk height in terms of age, too so that its coefficient of determination was estimated to be 0.9037. As well, the polynomial regression (with a determination coefficient of 0.9143) provided the best identification and prediction of crown diameter growth against age (Table 6).
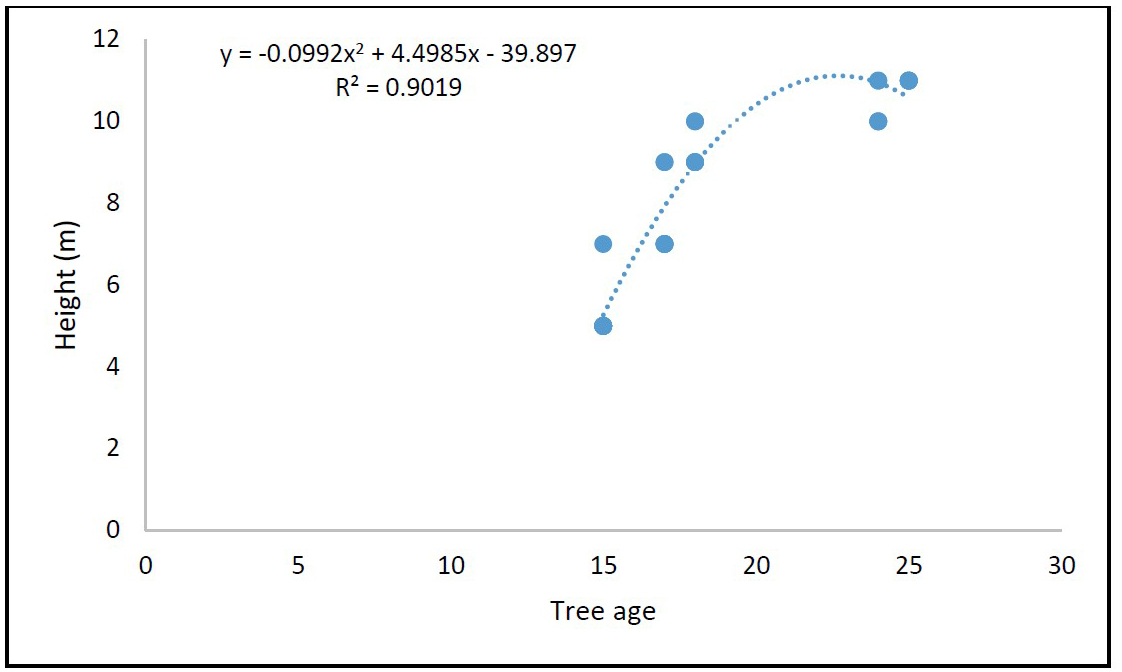
Figure 6. Regression diagram between age and total tree height (Fraxinus rotundifolia Mill.).
Table 6. Regression equations for Fraxinus rotundifolia Mill trees.
|
R2 |
regression equations |
Type of equation |
Parameters |
|
0.7624 |
y=0.5023x-1.2616 |
Linear |
Age × total height |
|
0.9019 |
y=-0.0992x2+4.4985x-39.897 |
Polynomial |
|
|
0.7006 |
y=2.3667e0.0637x |
Exponential |
|
|
0.7979 |
y=10.163ln(x)-21.44 |
Logarithmic |
|
|
0.7442 |
y=0.1788x1.297 |
Power |
|
|
0.8351 |
y=0.1974x-0.4343 |
Linear |
Age × trunk height |
|
0.9037 |
y=-0.0261x2+1.2504x-10.615 |
Polynomial |
|
|
0.7709 |
y=1.0142e0.0605X |
Exponential |
|
|
0.8616 |
y=3.9618ln(x)-8.2701 |
Logarithmic |
|
|
0.8056 |
y=0.0898x1.2222 |
Power |
|
|
0.7731 |
y=0.167x+2.9665 |
Linear |
Age × crown diameter |
|
0.9143 |
y=-0.0329x2+1.4941x-9.8644 |
Polynomial |
|
|
0.7389 |
y=3.6118e0.0275x |
Exponential |
|
|
0.8106 |
y=3.3775ln(x)-3.7395 |
Logarithmic |
|
|
0.7796 |
y=1.1904x0.5582 |
Power |
Note: R2: Coefficient of determination, x and y: regression line equation. There is a significant relationship (positive correlation) between age and total tree height, crown diameter and trunk diameter in Fraxinus rotundifolia Mill. That is, with age, according to the regression formula, the total height of the tree, crown diameter and diameter also increase. The value of R2 specifies the degree of this correlation. Given that in 5 types of regression formulas, the R2 polynomial coefficient is the highest, this formula is used for prediction. That is, by increasing 1 X unit (age), the amount of height, crown diameter and trunk diameter are determined according to the regression formula.
Boxelder maple (Acer negundo)
As the results revealed, the highest determination coefficient to determine and predict height growth with age was related to the polynomial regression (0.9005) (Figure 7). The polynomial regression had the highest coefficient of determination (0.8301) for identifying and predicting trunk height against age, too. Finally, crown diameter growth against age was best predicted by the logarithmic regression showing a determination coefficient of 0.8038 (Table 7).
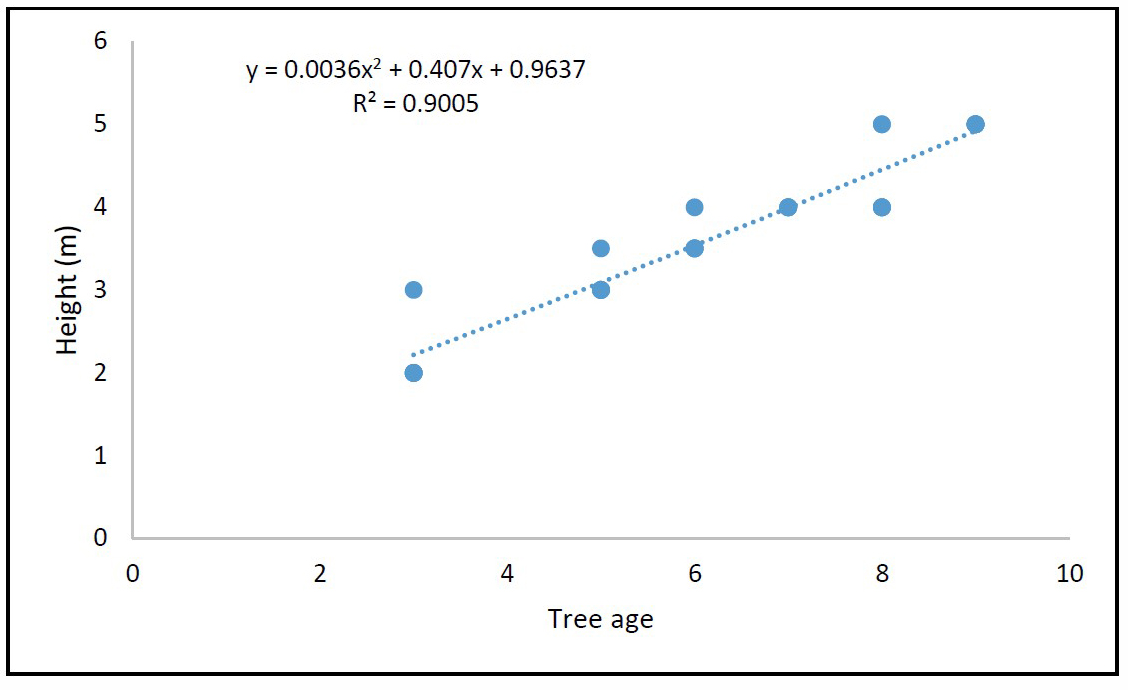
Figure 7. Regression diagram between age and total tree height (Acer negundo).
Table 7. Regression equations for Acer negundo trees.
|
R2 |
regression equations |
Type of equation |
Parameters |
|
0.9003 |
y=0.4507x+0.8473 |
Linear |
Age × total height |
|
0.9005 |
y=0.0036x2+0.407x+0.9637 |
Polynomial |
|
|
0.8853 |
y=1.5276e0.133x |
Exponential |
|
|
0.8729 |
y=2.4275ln(x)-0.629 |
Logarithmic |
|
|
0.8991 |
y=0.9561x0.7371 |
Power |
|
|
0.7558 |
y=0.3523x+0.1734 |
Linear |
Age × trunk height |
|
0.8301 |
y=-0.0595x2+1.0668x-1.7295 |
Polynomial |
|
|
0.7098 |
y=0.667e0.1892x |
Exponential |
|
|
0.8081 |
y=1.9914ln(x)-1.151 |
Logarithmic |
|
|
0.7757 |
y=0.3207x1.0812 |
Power |
|
|
0.7731 |
y=0.167x+2.9665 |
Linear |
Age × crown diameter |
|
0.7961 |
y=-0.0081x2+0.3397x+1.4796 |
Polynomial |
|
|
0.7395 |
y=1.9314e0.0808x |
Exponential |
|
|
0.8038 |
y=1.6349ln(x)+0.0877 |
Logarithmic |
|
|
0.8214 |
y=1.0264x0.587 |
Power |
Note: R2: Coefficient of determination, x and y: regression line equation. There is a significant relationship (positive correlation) between age and total tree height, crown diameter and trunk diameter in Acer negundo. That is, with age, according to the regression formula, the total height of the tree, crown diameter and diameter also increase. The value of R2 specifies the degree of this correlation. Given that in 5 types of regression formulas, the R2 polynomial coefficient is the highest, this formula is used for prediction. That is, by increasing 1 X unit (age), the amount of height, crown diameter and trunk diameter are determined according to the regression formula.
DISCUSSION
Analysis of statistical data collected based on descriptive statistics of studied trees considered in urban green space showed that Caucasian elm and Boxelder maple had the highest and lowest height, respectively. Also, the crown diameter of the studied trees (which is one of the important factors in planting trees in urban green space) has the highest crown diameter in Caucasian elm and the lowest crown diameter in the sweet gum. This can be an important factor in selecting trees in different urban areas (streets, boulevards and parks).
As it was revealed, in all six studied species (gingko, Persian iron wood, sweet gum, Caucasian elm, ash, and Boxelder maple), the polynomial regression had the highest determination coefficient in predicting the independent indices (height, trunk height, and crown diameter) in terms of the dependent (age). However, the logarithmic regression provided a better coefficient of determination for the crown diameter of Boxelder maple and plant height growth of Persian iron wood. In the studies of Karimian et al. (2015) and Karimian (2015), most regression functions were calculated from the logarithmic type. This can be attributed to the limited age of the selected trees from urban green spaces. The limiting factors of trees growth in urban green spaces can be enumerated as, but not limited to, space (construction, power facilities, etc.), legal barriers, natural disasters (snow, rain, etc.), and biotic factors (diseases). Because of these factors, trees grow less in urban areas than their natural habitats (Tabari and Kiani, 2017). Also, in urban green spaces, forming pruning is used for aesthetic purposes and also to avoid interference with traffic and urban equipment and this, in turn, affects the growth of trees (Karimian et al., 2015).
According to our results, polynomial regression functions can be used to predict tree growth in new urban green spaces in terms of environmental factors and age.
As well, if data on three dimensions are available, costs can be estimated more precisely and more suitable management plans can be developed in future years to create sustainable urban green spaces. If it is estimated by using these models and functions that a certain tree may grow fast, it can be used in public places, e.g. the side of the streets and green spaces, where fast green cover is required. Slow-growing trees are recommended to be planted in places with limited space, such as boulevards and pedestrian areas of business and crowded streets.
CONCLUSION
The results showed that polynomial regression functions provided the best determination coefficient to predict the growth indices with respect to age in the urban green spaces for aesthetic purposes and also, to reduce costs, tackle interference with transit, urban equipment, and finally developing ecosystems sustainably.
ACKNOWLEDGEMENTS
Authors thank Islamic Azad University, Rasht Branch. We cherish the memory of our dear friend and classmate, Mr. Alireza Feizinezhad.
REFERENCES
Aalbers, B.E.M. and Sehested, K. 2018. Critical up scaling. How citizens’ initiatives can contribute to a transition in governance and quality of urban green space. Urban Forestry and Urban Greening. 29: 261–275.
Bahram Soltani, K. 2016. Collection of topics and methods of urban planning (the environment). Vol. 2. Shahidi Publication. Tehran, Iran, pp. 238 (In Persian).
Cariñanos, G., Pinho, C.P., Branquinho, A., Andreucci, A., Bianco, B., Calaza-Martínez, C., Carrari, C., Chiesura, C., Gonçalves, G., Mexia, M., Paoletti, S.R., and Semenzato V. 2019. Estimation of the allergenic potential of urban trees and urban parks: Towards the healthy design of urban green spaces of the future. International Journal of Environmental Research and Public Health. 16: 1–17.
Escobedo, F.J., Kroeger, T., and Wagner, J.E. 2011. Urban forests and pollution mitigation: Analyzing ecosystem services and disservices. Environmental Pollution. 159: 2078–2087.
Hami, A., Abdi, B., Zarehaghi, D., and Maulan, S.B. 2019. Assessing the thermal comfort effects of green spaces: A systematic review of methods, parameters, and plants’ attributes. Sustainable Cities and Society. 49: 101634.
Hedman, R. 1985. Fundamentals of Urban Design. pp: 4–5, Routledge.
Karimian, Z. 2015. Estimating height and diameter growth of some street trees in urban green spaces. Journal of Ornamental Plants. 6: 93–99.
Karimian, Z., Tehranifar, A., Bannayan, M., Azizi, M., and Kazemi, F. 2015. Predicting the growth of different dimensions of mulberry (Melia azedarach) and chinaberry (Morus alba) in urban landscapes. Journal of Crop Production and Processing. 4: 99–109.
Jamei, E., and Rajagopalan, P. 2018. Effect of street design on pedestrian thermal comfort. Architectural Science Review. 62: 92–111.
Lotfi, H., Irankhah, S., and Sadeghi, B. 2010. Evaluation of sport-cultural centers for locating and founding such centers using GIS (a case study of Tehran municipality, 18th district). Environmen Based Territorial Planning (Amayesh). 3: 43–72 (In Persian).
Majedi, H., Zaker Haghighi, K., and Habib, F. 2010. Identifying effective indicators for typology of urban fabrics. Hoviatshahr. 4: 105–112 (In Persian).
Mattijssen, T.J.M., van der Jagt, A.P.N., Buijs, A.E., Elands, B.H.M., Erlwein, S., and Lafortezza, R. 2017. The long-term prospects of citizens managing urban green space: From place making to place-keeping. Urban Forestry and Urban Greening. 26: 78–84.
McHale, M.R., Burke, I.C., Lefsky, M.A., Peper, P.J., and McPherson, E.G. 2009. Urban forest biomass estimates: Is it important to use allometric relationships developed specifically for urban trees? Urban Ecosyst. 12: 95–113.
McPherson, E.G., and Muchnick, J. 2005. Effect of street tree shade on asphalt concrete pavement performance. Journal of Arboriculture. 31: 303–310.
Moser-Reischl, A., Rahman, M.A., Pauleit, S., Pretzsch, H., and Rötzer, T. 2019. Growth patterns and effects of urban micro-climate on two physiologically contrasting urban tree species. Landscape and Urban Planning. 183: 88–99.
Mullaney, J., Lucke, T., and Trueman, S.J. 2015. A review of benefits and challenges in growing street trees in paved urban environments. Landscape and Urban Planning. 134: 157–166.
Quigley, M.F. 2002. Franklin Park: 150 years of changing design, disturbance, and impact on tree growth. Urban Ecosyst. 6: 223–235.
Riechers, M., Strack, M., Barkmann, J., and Tscharntke, T. 2019. Cultural ecosystem services provided by urban green change along an urban-periurban gradient. Sustainability. 11: 1–10.
Reis, C. and Lopes, A. 2019. Evaluating the cooling potential of urban green spaces to tackle urban climate change in Lisbon. Sustainability. 11: 1–17.
Yaripour, M. and Hadizadeh Zargar, S. 2015. Evaluation of the qualitative and quantitative indicators affecting on urban green space planning (the case of Miyaneh city). Journal of Urban Economics and Management. 3: 37–57 (In Persian).
Zhanga, L., Bi, H., Chenga, P.F., and Davis, C.J. 2004. Modeling spatial variation in tree diameter–height relationships. Forest Ecology and Management. 189: 317–329.
OPEN access freely available online
Chiang Mai University Journal of Natural Sciences [ISSN 16851994]
Chiang Mai University, Thailand
https://cmuj.cmu.ac.th
Ramin Abbasgholizadeh, Ali Reza Eslami*, and Behzad Kaviani
Department of Horticultural Science, Rasht Branch, Islamic Azad University, Rasht, Iran
Corresponding author: Ali Reza Eslami, E-mail: dr_eslami2006@yahoo.com
Total Article Views
Editor: Veerasak Punyapornwithaya,
Chiang Mai University, Thailand
Article history:
Received: May 19, 2021;
Revised: June 15, 2021;
Accepted: June 23, 2021;