 ISSN: 2822-0838 Online

Physicochemical Characterization, Phytochemical and HPTLC Fingerprinting Studies on Fruit of Couroupita Guianensis
Lawrence Anna Sheba and Anuradha Venkatraman*Published Date : 2021-09-13
DOI : https://doi.org/10.12982/CMUJNS.2021.078
Journal Issues : Number 4, October-December 2021
Abstract Traditional knowledge and literature studies report that each part of a plant has tremendous medicinal values. Validation of these medicinal plants scientifically is an important criterion for the development of plant-based drugs. Couroupita guianensis (Family: Lecythidaceae) is a plant with immense medicinal properties. To authenticate its biological value, the present investigation aims to standardize the fruit of C. guianensis based on physicochemical characterization, phytochemical analysis both qualitatively and quantitatively, and high-performance thin-layer liquid chromatography (HPTLC) fingerprinting studies. Fruit pulp of C. guianensis was obtained, processed and extracted with solvents such as petroleum ether, chloroform, ethanol and hydroalcohol. Moisture content, total ash, water-soluble ash and acid-insoluble ash values were calculated. Preliminary phytochemical analysis revealed the existence of several secondary metabolites in the extracts. In addition, interpreting peaks obtained from HPTLC analysis revealed the presence of potential bioactive phytoconstituents in all the extracts. The quantitative determination proclaimed that fruit pulp was found to be rich in phenolics and flavonoids followed by tannin and saponin. Further, primary metabolites were quantified and they were found to be abundant in the fruit pulp. Henceforth, the outcome of these results provides information for assessing the quality of the sample that could help in ensuring its therapeutic efficacy.
Keywords: Couroupita guianensis, HPTLC, Physicochemical characterization, Phytochemical, Fingerprinting
Citation: Sheba, L.A. and Venkatraman, A. 2021. Physicochemical characterization, phytochemical and HPTLC fingerprinting studies on fruit of Couroupita guianensis. CMU J. Nat. Sci. 20(4): e2021078.
INTRODUCTION
Cannonball tree with the botanical name of Couroupita guianensis Aubl is a member of Lecythidaceae family (Morton et al., 1997). In India, it is regarded as a sacred tree and was commonly found in Siva temples. It is also grown as an ornamental plant across the world. It is a gigantic tree bearing colorful and strongly scented flowers. The fruits are large weighing 36 pounds and its appearance makes the plant to be popularly known as cannonball tree. The fruits are encased in a hard shell with an acidic pulp. Despite its unpleasant smell, the fruits are edible and reported to show biological activities including antioxidant, antimicrobial, cytoprotective, anti-inflammatory, antihyperglycemic, antidiabetic, neuropharmacological, insecticidal/larvicidal, wound healing, hepatoprotective, antinociceptive, immunomodulatory and antiulcer activities (Sheba and Anuradha, 2020).
Phytochemicals are metabolites produced by a plant. These phytochemicals are primary and secondary metabolites (Rehab et al., 2018) that are unique to specific species or genera and get accumulated in different regions of plants (Omojate et al., 2014). Secondary metabolites are non-nutritive and fall into the category of alkaloids, saponins, curcumins, flavonoids, plant lignans, plant steroids, phenolics, organosulfur compounds, terpenoids and glycosides (Okwu, 2004; Harborne, 1973). The type and quantity of these phytochemical compounds depend on the plant part from which it has been isolated and extracted. Plants produce these compounds as self-defense from biotic and abiotic factors (Saboon et al., 2019). In addition, these secondary metabolites play a key factor in determining the biological activities such as antimicrobial, antioxidant, anticancer, anti-inflammatory, etc. For instance, several bioactive compounds act as antioxidants by neutralizing free radicals, thus indeed playing an inevitable role in preventing and treating oxidative stress-related diseases (Pachaiyappan, 2014). Therefore, it demands an in-depth assessment of the plants to justify their potential applications. Recent studies concentrate on extracting, isolating, screening and purifying the bioactive compounds from plants, in specific, more efforts are contributed to ensure the quality and safety of phytochemicals using reliable techniques. HPTLC is one such technique, which is simple, reproducible, rapid and cost-effective. It allows quantitative and semi-quantitative analysis of phytochemicals (Attimarad et al., 2011). There are reports regarding the physicochemical studies and TLC fingerprinting analysis of whole plant of C. guianensis (Raja S and Ravindranadh K, 2014; Manimegalai and Rakkimuthu G, 2012). However, until now extensive studies on the chemical composition of fruit pulp have not been carried out to acknowledge its biological property. So, in line to gain more insights related to phytochemical composition, the present study has been framed to focus on physicochemical characterization, phytochemical components screening and quantification, and chemical fingerprinting of C. guianensis fruit pulp.
MATERIALS AND METHODS
C. guianensis fruits were obtained in and around the areas of Chennai. The fruit was authenticated by Prof. Dr. Jayaraman, Institute of Herbal Science, Plant Anatomy research center, Chennai, Tamilnadu, India. The fruit sample was authenticated to be C. guianensis with certificate number as PARC/2018/3859. Pulp of the fruit was collected, shade dried, ground and stored.
Physicochemical characterization
In this study, petroleum ether soluble extractive, chloroform soluble extractive, ethanol soluble extractive and water soluble extractive values were determined. Extractive values enable to analyze the nature and content of active components in the plant. About 5 g of the sample powder was macerated with 100 ml of ethanol in a closed flask for 24 hr, shaking frequently. The solution was filtered and 25 ml of the filtrate was evaporated in a tarred petri dish, dried at 105°C and weighed. The procedure was done in replicates and the results were expressed as percentage with reference to the air dried sample (Vatsa et al., 2016). The same method was repeated with petroleum ether, chloroform and water.
2 g of the dried of powder of C. guianensis fruit pulp was subjected to total ash, water-soluble ash and acid-insoluble ash analysis (Vatsa et al., 2016). The results were expressed as percentage with reference to the air-dried sample.
Moisture content was determined by loss on drying method. In this method, about 2 g of the sample was taken and weighed in a previously weighed flat bottle. The sample was dried using an oven maintained at 105°C until a constant weight was obtained. The dried sample was then cooled and weighed. The percentage of loss of weight was calculated (Vatsa et al., 2016).
Successive Extraction
About 100 g of the dried and powdered material was subjected to successive extraction with 300 ml of petroleum ether, chloroform, ethyl acetate, ethanol and hydroalcohol in the increasing order of polarity by hot percolation method using a Soxhlet apparatus. After distillation, the resultant extracts were pooled and evaporated to dryness in a rotary vacuum evaporator at 40-50°C and the final extracts were stored in a refrigerator until further investigations.
Phytochemical screening of the plant material
Preliminary phytochemical analysis was carried out in petroleum ether, chloroform, ethanol and hydroalcoholic extracts using standard methods (Kokate, 2005; Harborne, 1998; Om, et al., 2012). The extracts were screened for the presence of glycosides, alkaloids, steroids, triterpenoids, flavonoids, amino acids, reducing sugars, oils and fats, phenolics, tannins, saponins and anthraquinones.
Quantitative phytochemical analysis
Dried fruit powder was analyzed for carbohydrate content (Nielsen and Suzanne, 2010), protein content (Mahendra and Madhuri, 2018) and lipid content (Sangeetha et al., 2016). The procedures were repeated in triplicates and the results were expressed in mg/g of the sample.
Total chlorophyll content was estimated as per the method prescribed by Harborne, 1973. 50 mg of dried fruit powder was soaked in a mixture containing 5ml of DMSO and acetone (1:1) and kept for overnight dark incubation. The absorbance was read spectrophotometrically at 663 nm and 645 nm and total chlorophyll content was determined using the below-mentioned equations.
Chlorophyll a (Ca) = (12.25 × OD at 663) - (2.79× OD at 645) ×10/ (1000×wt)
Chlorophyll b (Cb) = (21.50 × OD at 645) - (5.10× OD at 663) ×10/ (1000×wt)
Total Chlorophyll (C) = (7.15 × OD at 663) + (18.71× OD at 645) ×10/ (1000×wt)
Crude fiber determination was carried out by following the method prescribed by Sadasivam and Manickam, 1992. This determination specifies the amount of cellulose and lignin in plant tissues.
Saponin analysis was performed according to the method described by Obadoni and Ochuko, 2002. The procedure was repeated thrice and the results were expressed as mg/g. Total saponin content was calculated by using the following formula:
Weight of total saponins: W2-W1 g
W3
Where, W1 = weight of crucible,
W2 = weight of crucible with saponins,
W3 = initial weight of plant sample taken for estimation
Similarly, flavonoid content was determined as per the procedure followed by Bohn and Kocipai, 1994. The procedure was repeated in triplicates and the results were expressed as mg/g. Total flavonoid content was calculated as follows:
Weight of total flavonoid: W2-W1 g
W3
Where, W1 = weight of crucible,
W2 = weight of crucible with flavonoid,
W3 = initial weight of plant sample taken for estimation
Tannin content was measured by following the protocol described by Folin-Ciocalteau method (Naima et al., 2012; Govindappa, 2011). Tannin content was calculated using the generated values. The procedure was done in triplicates and the results were expressed as mg equivalents/g. Phenol content was measured colorimetrically using the procedure followed by Singleton and Rossi, 1965. The total phenolic content was expressed as catechol equivalents.
HPTLC analysis of various extracts
From the observation obtained from the qualitative and quantitative phytochemical analysis, the petroleum ether, chloroform, ethanol and hydroalcoholic extracts were subjected to HPTLC analysis. The procedure was carried out as per the recommendation of Wagner H and Bladt S, 1996. Sample was taken in small quantity and was diluted with solvent. 5 μl and 8 μl of the sample was chromatographed with suitable solvent system. The solvent system toluene, ethyl acetate and formic acid in the ratio 82:1.8:0.8 was chosen for the analysis.
HPTLC analysis was carried out with CAMAG. The samples were applied in precoated TLC plate (E. Merck) of 0.2 mm thickness and 10 X 10 cm plate size and developed in CAMAG twin trough chamber. After development, the plates were air-dried and scanned on a CAMAG TLC scanner at 254 nm and 366 nm. The plates were then visualized at visible light after spraying with vanillin-sulphuric acid. The chromatogram was photographed and the peaks and retention factor (Rf) were observed.
Statistical analysis:
All the experiments were done in triplicates and the results were analyzed statistically and expressed as mean (n=3) ± standard deviation (SD).
RESULTS AND DISCUSSION
Physiochemical characterization
Standardization of physicochemical characteristics determines the quality and chemical constituents of plant material. Moisture content enables to assess the chance of alteration in the plant material. The alterations may be due to chemical reactivity or deterioration caused by bacterial or fungal contamination (Rocha, 2011). Hence it is essential for the dried plant material to be low in moisture content to increase its preservability. The moisture content was analysed by loss on drying method which has been found to be 9.10 ± 0.77% and was within limits. The presence or absence of foreign matter in the crude material can be assessed by ash values (Chaudhari and Girase, 2016). Total ash value, water soluble ash value and acid insoluble ash value have been tabulated in Table 1. Further the foreign matter in the sample was also observed with naked eye or magnifying lens and there was no observable inorganic material. The quantity of extractable matter in the dried sample material using different solvents such as petroleum ether, chloroform, ethanol and water was tabulated in Table 1. The extractive value is an indicative of the solubility nature of active components in the extract. Further, the results indicated that the fruit pulp powder has higher content of water and ethanol soluble matter.
Table 1. General physicochemical properties of C. guianensis fruit pulp.
|
Parameters |
Results |
|
Foreign matter |
0.04% |
|
Loss on drying (105 ºC) |
9.10 ± 0.77% w/w |
|
Extractive values |
|
|
Petroleum ether soluble extractive |
3.47 ± 0.24% w/w |
|
Chloroform soluble extractive |
7.28 ± 0.66% w/w |
|
Ethanol soluble extractive |
24.07 ± 0.73% w/w |
|
Water soluble extractive |
38.67 ± 0.88% w/w |
|
Total ash |
10.71 ± 0.50% w/w |
|
Acid-insoluble ash |
0.34 ± 0.05% w/w |
|
Water-soluble ash |
0.04 ± 0.00% w/w |
|
pH of 5% w/v solution |
4.01 |
Note: Values are expressed as mean±SD of the three replicates
Phytochemical evaluation
Earlier reports have proved that phytochemicals and in particular, the secondary metabolites play a key determinants of pharmacological activity. Therefore, it is inevitable to screen and quantify these phytochemicals.
Qualitative and quantitative phytochemical analysis
The basic step in determining the nature of phytochemicals is performing preliminary phytochemical analysis. The results were summarized in Table 2. The study revealed the capability of different solvents to extract various components from the fruit sample. This in turn shows the difference in solubility of various phytochemicals among different solvents of varying polarity. Further, the primary and secondary metabolites were quantified and the results were given in Table 3 and Table 4 respectively.
On performing preliminary phytochemical analysis, petroleum ether extract showed the presence of alkaloids, carbohydrates, phytosterols and triterpenoids whereas chloroform extract showed the presence of all the phytochemicals examined except triterpenoids and saponins. Ethanol extract contained alkaloids, carbohydrates, phenolics, tannins, phytosterols, amino acids, flavonoids and triterpenoids. However, oil and fats, glycosides and anthraquinones were absent in the ethanol extract. Hydroalcoholic extract showed the presence of the phytochemicals except triterpenoids, oil and fats, glycosides and anthraquinones. From various studies, it has been found out that saponins, alkaloids, tannins, anthraquinone, and glycosides are commonly seen in plants. Several such phytochemicals have been reported in various parts including leaf, stem and flower of C. guianensis. In a study conducted by Pandurangan et al., 2018, phytochemicals such as alkaloids, proteins, glycosides, phytosterols, flavonoids, tannins and terpenoids have been identified in the ethylacetate and chloroform extracts of leaf, flower and fruit of C. guianensis. Similarly, Manimegalai S, 2012 have reported the presence of alkaloids, flavonoids, steroids, saponin, phenol and triterpenoids in the petroleum ether, benzene and ethanol stem extracts of C. guianensis. By subjecting fruit pulp powder to quantitative analysis, the sample was found to be rich in phenolic content (41.35 ± 1.87 mg/g). Higher phenolic content has also been reported in leaf of C. guianensis (Srisha et al., 2018). Fruit pulp possesses a higher amount of flavonoid content followed by tannin and saponin. This result is in agreement with a report documented from a comparative study related to flavonoid content in different parts of C. guianensis. The report have demonstrated that leaves, flowers and fruit pulp were rich in flavonoids than stem bark and fruit rind (Akther et al., 2017). In the present study, fruit pulp contain tannin at an amount of 23.26 ± 1.63 mg/g. Tannin was found to be present in moderate amount in the chloroform extract of flower and fruit (Pandurangan et al., 2018). These phytochemicals probably determine the medicinal properties of the plant. For instance, alkaloids which are nitrogenous compounds make a noteworthy contribution in the management of cancer. It is well known for its antiarrhythmic, antimalarial activity and blood glucose lowering activity. They act by affecting chemical neurotransmitters such as dopamine, GABA, acetylcholine and serotonin (Nyamai et al., 2016). Similarly, plant foods contributing 12% or more of its calorific value from protein are regarded as the good source of protein (Pearson, 1976). From the present study protein content of fruit pulp powder was found to be 12 ± 0.81 mg/g and so it can be regarded as a good source of protein. Furthermore, the fruit pulp contains large amount of fiber. Generally, foods rich in fiber promote digestion. On comparing the content of carbohydrates, fats and lipids, it was found that a marked amount of carbohydrate (29.21 ± 1.52 mg/g) was present in the sample. Carbohydrates are well known for their incredible role as the resource for energy and organic compounds, particularly secondary metabolites (Sayeed A, 2007). Further, they also act as antioxidants and play an important role in conferring plant immunity (Trouvelot et al., 2014). From the above discussion it has been clear that these phytochemicals henceforth contribute to boundless benefits in human health.
Table 2. Preliminary phytochemical analysis of C. guianensis fruit pulp.
|
S. No. |
Components |
Test |
Petroleum Ether |
Chloroform |
Ethanol |
Hydroalcohol |
|
1 |
Alkaloids |
Wagner's test |
+ |
+ |
+ |
+ |
|
|
|
Mayer's test |
+ |
+ |
+ |
+ |
|
2
3 |
Reducing sugar |
Fehling's test |
+ |
+ |
+ |
+ |
|
Benedict's test |
+ |
+ |
+ |
+ |
||
|
Phenolics |
Ferric chloride test |
- |
+ |
+ |
+ |
|
|
|
|
Gelatin test |
- |
+ |
+ |
+ |
|
4 |
Tannins |
Lead acetate test |
- |
- |
+ |
+ |
|
5 |
Phytosterols |
Libermann Burchard test |
+ |
+ |
+ |
+ |
|
6 7 8 |
Flavonoids Amino acids |
Shinoda test Ninhydrin test |
- - |
+ + |
+ + |
+ + |
|
Triterpenoids |
Knoller’s test |
+ |
- |
+ |
- |
|
|
Salkowski test |
+ |
- |
+ |
- |
||
|
9 |
Saponin |
Foam test |
- |
- |
+ |
+ |
|
10 |
Oil and fats |
Spot test |
+ |
+ |
- |
- |
|
11 |
Glycosides |
Nitroprusside test |
- |
+ |
- |
- |
|
12 |
Anthraquinone |
Borntrager's test |
- |
- |
- |
- |
Table 3. Quantitative analysis of primary metabolites
|
S.No. |
Primary metabolites |
Weight (mg/g dw) |
|
1 |
Carbohydrates |
29.21 ± 1.52 |
|
2 |
Chlorophyll |
20.11 ± 0.92 |
|
3 |
Protein |
12.00 ± 0.81 |
|
4 |
Lipids |
11.07 ± 0.47 |
|
5 |
Fibre |
31.07 ± 1.40 |
Note: Values are expressed as mean ± SD of the three replicates
Table 4. Quantitative analysis of secondary metabolites.
|
S. No. |
Secondary metabolites |
Weight (mg/g dw) |
|
1 |
Total phenol |
41.35 ± 1.87 |
|
2 |
Tannin |
23.26 ± 1.63 |
|
3 |
Saponin |
15.25 ± 0.98 |
|
4 |
Total flavonoids |
39.06 ± 0.89 |
Note: Values are expressed as mean ± SD of the three replicates
Screening of phytochemicals by HPTLC
Studies have reported that toluene, ethylacetate and formic acid solvent combination were effective in separating phenols and flavonoids (David et al., 2015; Rehana and Nagarajan, 2014). In the present study, it has been confirmed that fruit pulp was rich in phenol and flavonoid. In this regard, HPTLC has been carried out using toluene, ethylacetate and formic acid solvent.
HPTLC chromatogram of petroleum ether (Figure 1), chloroform (Figure 4), ethanol (Figure 5) and hydroalcohol extracts (Figure 6) revealed the separation of various components. However, the separation is more prominent in vanillin-sulphuric acid derivatized plate scanned under visible light. Different peaks were observed in the fingerprint and densitogram for the spots appeared in the TLC plate under various detection systems. Accordingly, at 254 nm, 5 µL of petroleum ether extract exhibited 5 peaks. Peak with Rf value of 0.94 was found to be predominant as it has a maximum peak area of 58.80%. 8 µL of petroleum ether extract revealed the presence of 7 peaks, in which peak with Rf value of 0.95 has a maximum peak area of 62.85% (Figure 2). Similarly, at 366 nm, 5 µL of petroleum ether extract exhibited 4 peaks, in which peak with Rf value of 0.60 has a maximum peak area of 37.95%, and 8 µL of petroleum ether extract revealed the presence of 8 peaks, in which peak with Rf value of 0.60 has a maximum peak area of 40.37% (Figure 3)
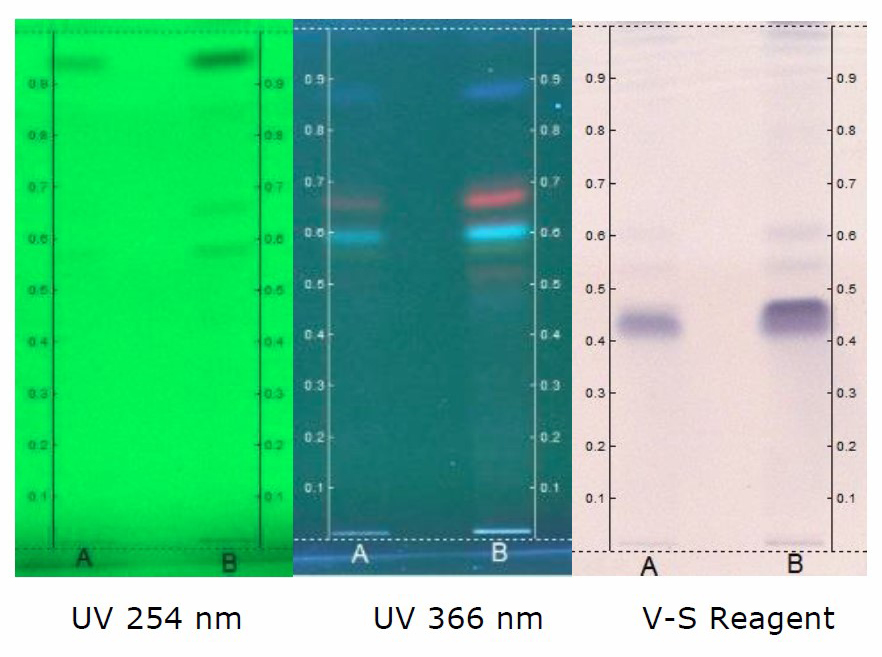
Figure 1. HPTLC chromatogram of petroleum ether extract of C. guianensis. Solvent system – Toluene: Ethyl acetate: Formic acid (8.2: 1.8: 0.1).
Track A - 5 µl; Track B - 8 µl
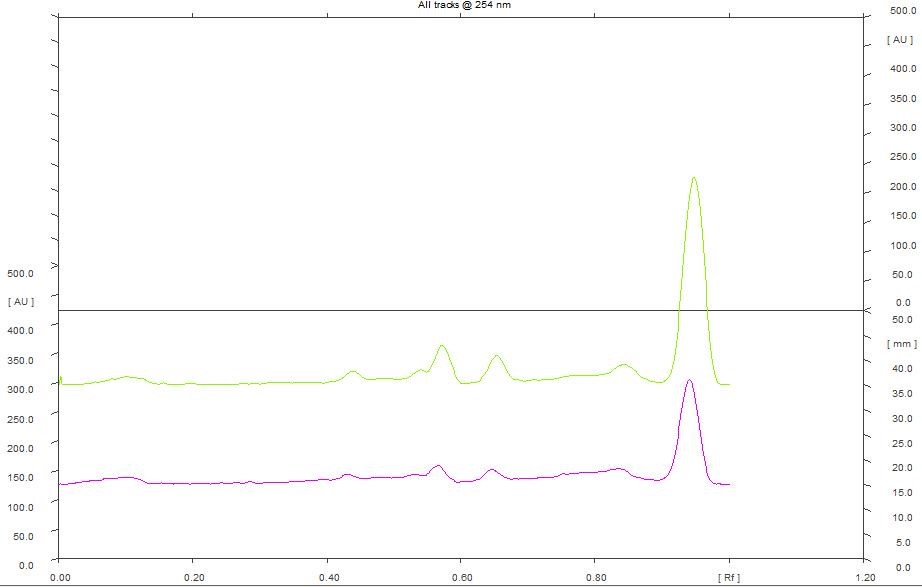
Figure 2. HPTLC densitogram of petroleum ether extract for 5 µL & 8 µL at 254 nm.
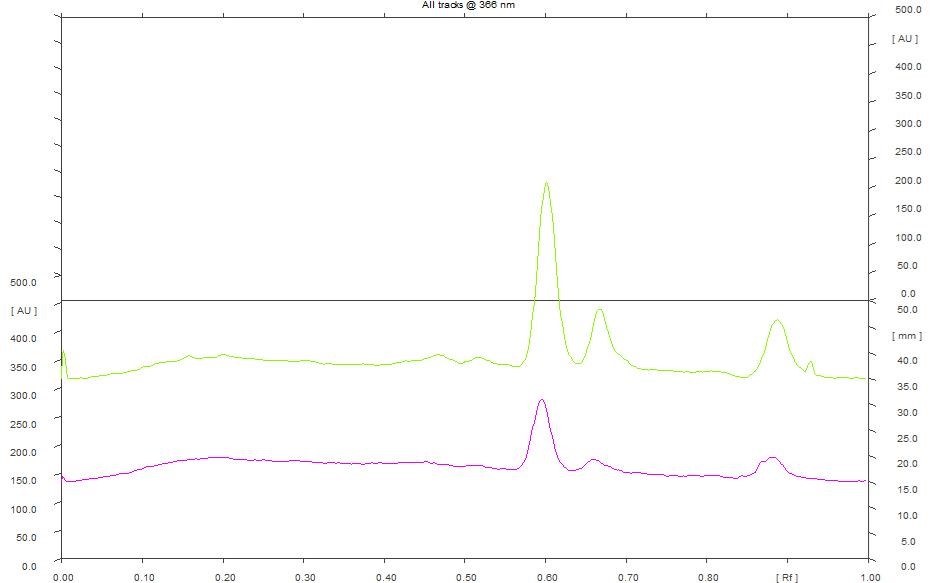
Figure 3. HPTLC densitogram of petroleum ether extract for 5 µL & 8 µL at 366 nm.
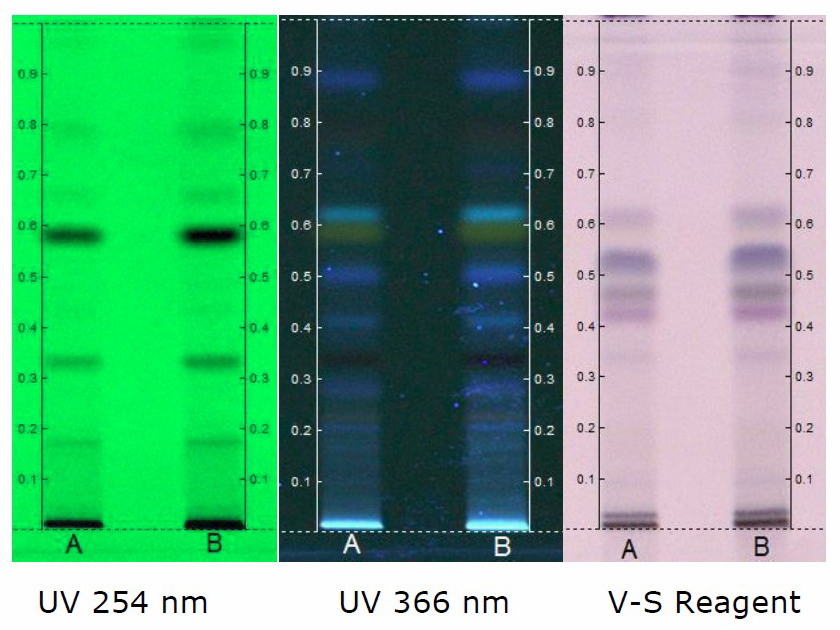
Figure 4. HPTLC chromatogram of chloroform extract of C. guianensis. Solvent system - Toluene: Ethyl acetate: Formic acid (8.2: 1.8: 0.1). Track A - 5 µl; Track B - 8 µl.
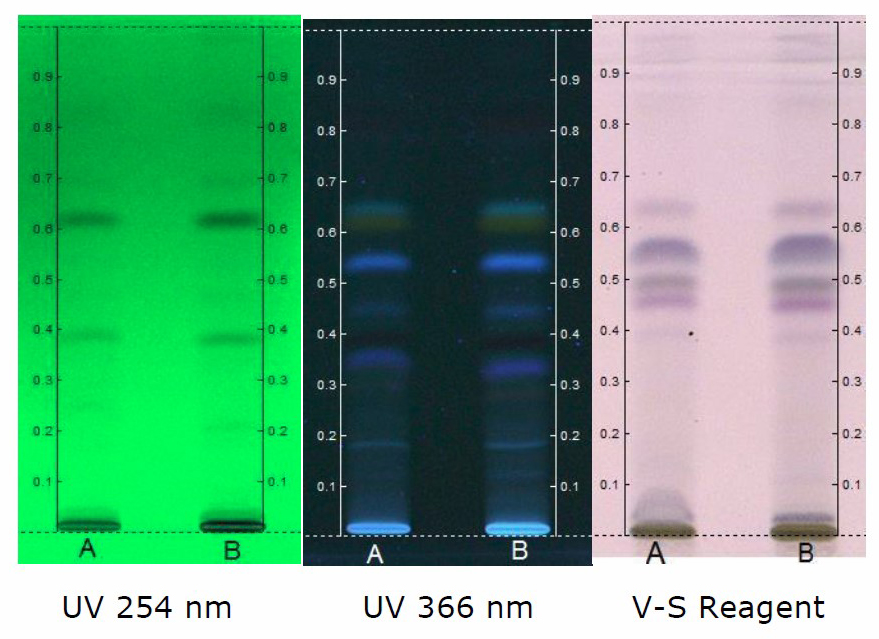
Figure 5. HPTLC chromatogram of ethanol extract of C. guianensis. Solvent system - Toluene: Ethyl acetate: Formic acid (8.2: 1.8: 0.1). Track A - 5 µl; Track B - 8 µl.
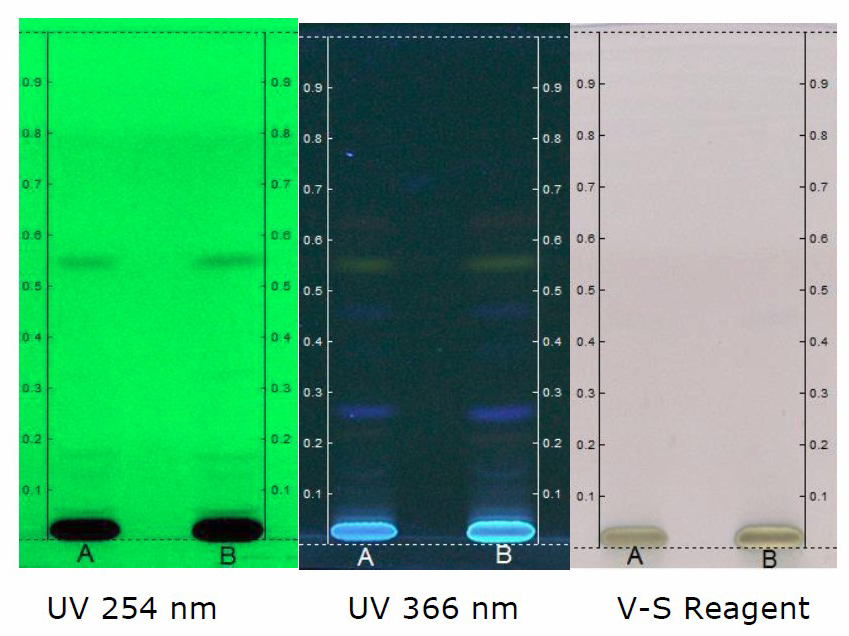
Figure 6. HPTLC chromatogram of hydroalcohol extract of C. guianensis. Solvent system - Toluene: Ethyl acetate: Formic acid (8.2: 1.8: 0.1). Track A - 5 µl; Track B - 8 µl.
At 254 nm, densitogram of 5 µL of chloroform extract showed 8 peaks and the peak with Rf value of 0.58 exhibited maximum peak area of 39.91% whereas 8 µL of the extract showed 9 peaks and the peak with Rf value of 0.57 exhibited maximum peak area of 36.03% (Figure 7).
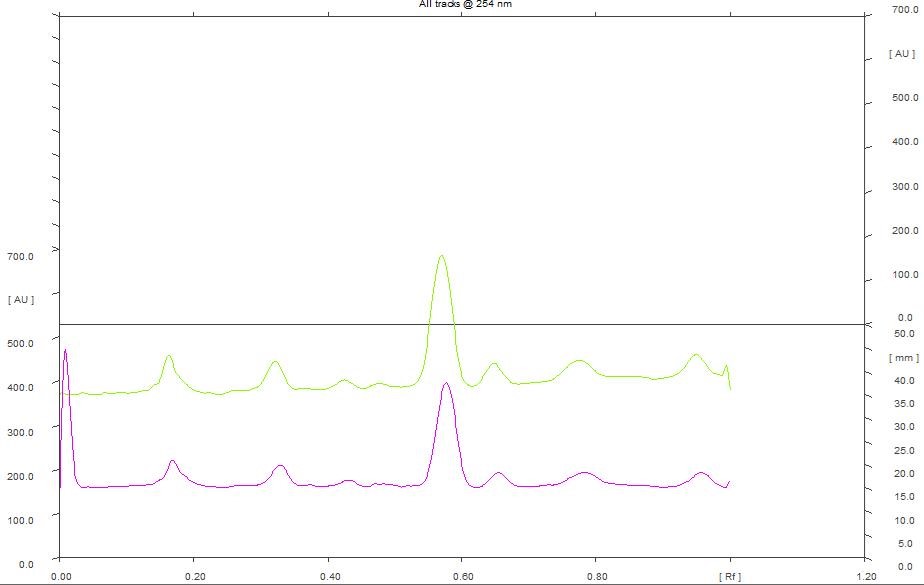
Figure 7. HPTLC densitogram of chloroform extract for 5 µL & 8 µL at 254 nm.
At 366 nm, densitogram of 5 µL of chloroform extract showed 4 peaks and the peak with Rf value of 0.58 exhibited maximum peak area of 53.08% whereas 8 µL of the extract showed 6 peaks and the peak with Rf value of 0.57 exhibited maximum peak area of 62.35% (Figure 8).
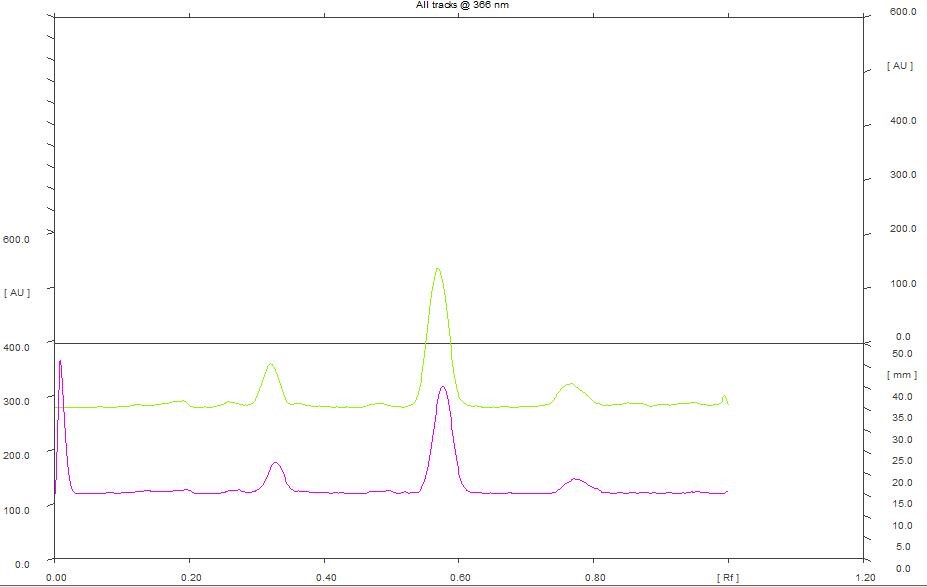
Figure 8. HPTLC densitogram of chloroform extract for 5 µL & 8 µL at 366 nm.
5 µL and 8 µL of ethanol extract scanned at 254 nm showed 12 peaks. However, the predominant peak obtained with the extracts differ in their maximum area. The data obtained revealed that the predominant peak observed with 5 µL of ethanol extract has a Rf of 0.62 and maximum area of 31.77% (Figure 9). Similarly, the predominant peak observed with 8 µL of ethanol extract has a Rf of 33.77 and maximum area of 0.61% (Figure 8). Further 5 µL and 8 µL of ethanol extract scanned at 366 nm showed 7 peaks. The data obtained revealed that the predominant peak observed with 5 µL of ethanol extract exhibited a Rf of 0.62 and maximum area of 52.91%. Similarly, the predominant peak observed with 8 µL of ethanol extract has a Rf of 0.61 and maximum peak area of 55.53% (Figure 10).
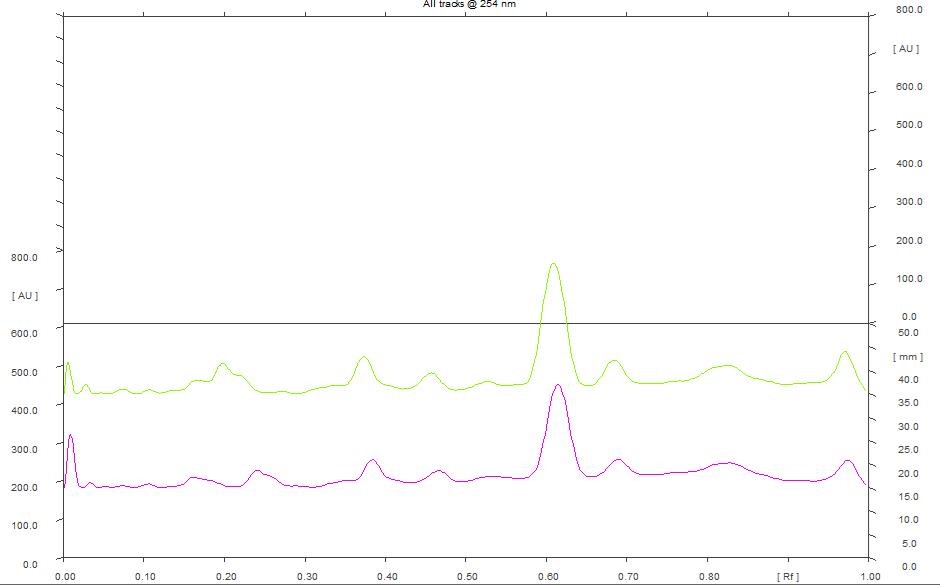
Figure 9. HPTLC densitogram of ethanol extract for 5 µL & 8 µL at 254 nm.
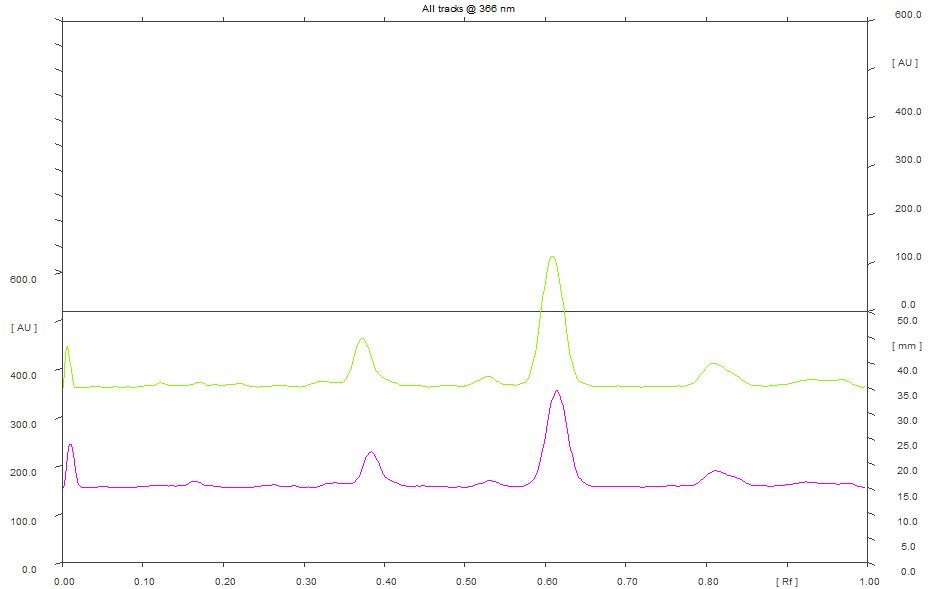
Figure 10. HPTLC densitogram of ethanol extract for 5 µL & 8 µL at 366 nm.
There is not significant difference in the number of peaks obtained when hydroalcoholic extract was scanned at 254 and 366 nm. At 254 nm, peak with maximum area (40.84%) obtained with 5 µL of the extract exhibited a Rf of 0.53 and peak with maximum area (35.90%) obtained with 8 µL of the extract exhibited a Rf of 0.54 (Figure 11). Furthermore, at 366 nm, peak with maximum area (33.48%) obtained with 5 µL of the extract exhibited a Rf of 0.21 and peak with maximum area (36.99%) obtained with 8 µL of the extract exhibited a Rf of 0.22 (Figure 12). The study clearly indicated that maximum number of peaks have been observed with ethanol extract. This can be correlated with number of phytochemicals present in the extract. Further, the variations of Rf values and the percentage area of the peaks reflects the presence of various phytochemicals at different concentrations in the extracts.
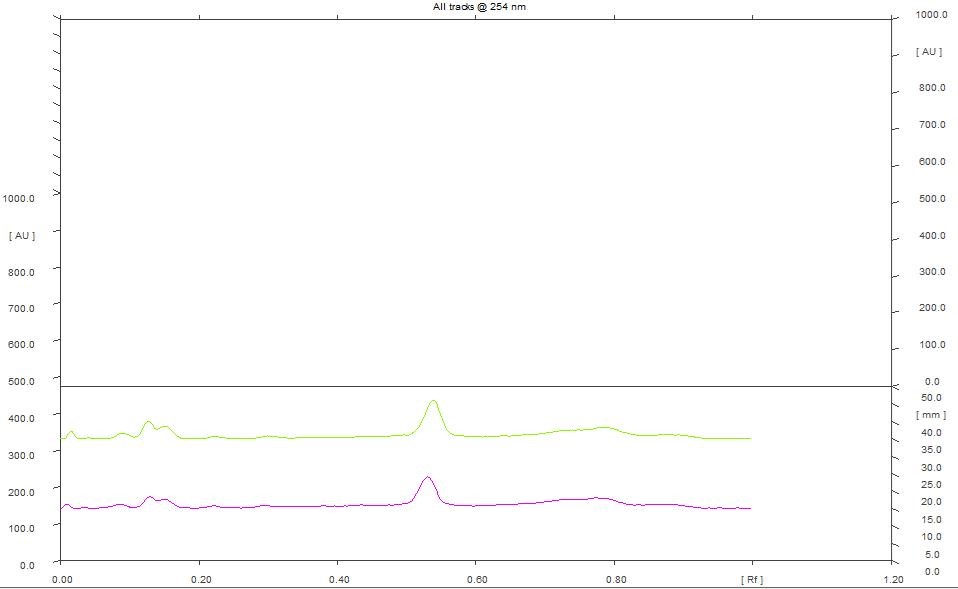
Figure 11. HPTLC densitogram of hydroalcohol extract for 5 µL & 8 µL at 254 nm
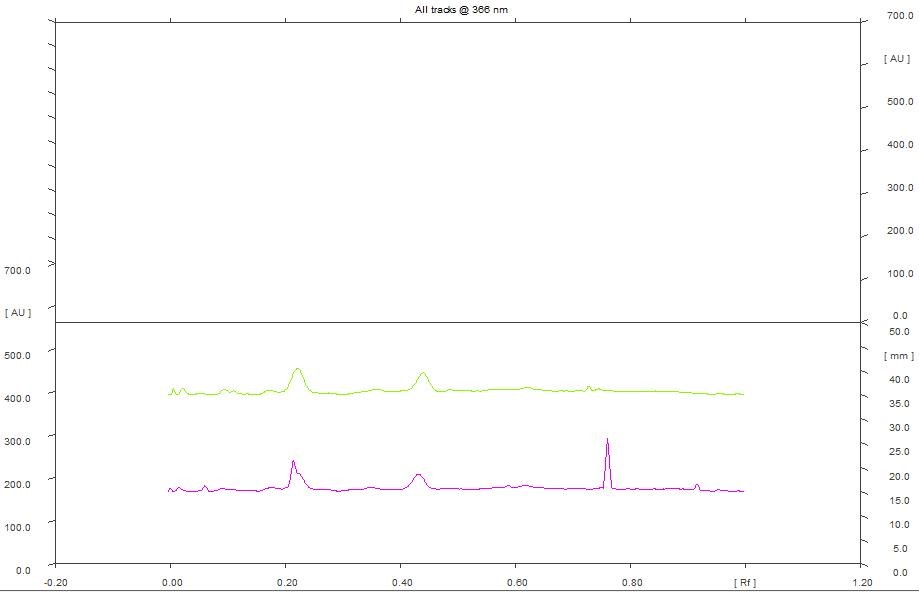
Figure 12. HPTLC densitogram of hydroalcohol extract for 5 µL & 8 µL at 366 nm
CONCLUSION
Standardization of medicinal plant at chemical level is a prerequisite for creating a scientific profile for the traditionally well-claimed medicinal plant. In this context, the outcome of the present study has ascertained that C. guianensis fruit is rich in several secondary metabolites and these metabolites are considerably soluble in water and ethanol. HPTLC analysis further confirmed that ethanol extract has more number of chemical compounds compared with other extracts. Future investigation should focus on the isolation and identification of bioactive compounds and their pharmacological activities to justify the ethnopharmacological value of the plant.
ACKNOWLEDGEMENTS
We express our sincere gratitude to all the staffs of the Regional Research Institute of Unani Medicine, Chennai for their time and cooperation in completing this work.
AUTHOR CONTRIBUTIONS
All authors made substantial contributions to conception and design, acquisition of data, or analysis and interpretation of data; took part in drafting the article or revising it critically for important intellectual content; agreed to submit to the current journal; gave final approval of the version to be published; and agree to be accountable for all aspects of the work.
CONFLICT OF INTEREST
The authors report no conflicts of interest in this work.
REFERENCES
Akther, T., Khan, M.S., and Hemalatha, S. 2017. Extraction of flavonoids from various parts of Couroupita guianensis and its. Asian Journal of Pharmaceutical and Clinical Research. 10: 354-358.
Attimarad, M., Ahmed, K.K., Aldhubaib, B.E., and Harsha, S. 2011. High-performance thin layer chromatography: A powerful analytical technique in pharmaceutical drug discovery. Pharm Methods. 2: 71-75.
Bohm, B.A. and Kocipai, A.R. 1994. Flavonoid and condensed tannins from the leaves of Vaccinum raticulatum and Vaccinum calcyimium. Journal of Pacific Science. 48: 458-463.
Chaudhari, R.K. and Girase, N.O. 2015. Determination of soluble extractives and physico-chemical studies of bark of Sesbania sesban (L) Merr. Journal of chem pharm research. 7: 657-660.
David, T. and George, K.V. 2014. HPTLC Analysis of the Leaf Extract of Hydnocarpus pendulus Manilal, Sabu & Sivarajan. International Journal of Pharmaceutical and Life Science. 25: 3452-3462.
Govindappa, M., Naga, S.S., Poojashri, M.N., Sadananda, T.S., and Chandrappa, C.P. 2011. Antimicrobial, antioxidant and in vitro anti-inflammatory activity of ethanol extract and active phytochemical screening of Wedelia trilobata (L.) Hitchc. Journal of Pharmacognosy and Phytochemistry. 3: 43-51.
Harborne, A.J. 1998. Phytochemical methods a guide to modern techniques of plant analysis. London, UK: Chapman and Hall.
Harborne, J.B. 1973. Phytochemical methods: A guide to modern techniques of plant analysis. London, UK: Chapman and Hall.
Kokate, C.K. 2005. A text book of pharmacognosy. India: Vallabh Prakashan.
Mahendra, A.D. and Madhuri, A.T. 2018. Phytochemical screening, quantitative analysis of primary and secondary metabolites of Acacia Arabica bark. International Journal of Current Pharm Research. 10: 35-37.
Manimegalai, S. and Rakkimuthu, G. 2012. Phytochemical screening of stem of Couroupita guianensis. International Journal of Current Pharm Research. 3: 4434-4437.
Morton, C., Mori, S., Prance, G., Karol, K., and Chase, M. 1997. Phylogenetic relationships of Lecythidaceae: a cladistic analysis using rbcL sequence and morphological Data. American Journal of Botany. 84: 530-540.
Naima, S., Muhammad, R.K., and Maria, S. 2012. Antioxdant activity, total phenolic and total flavanoid contents of whole plant extracts Torilis leptophylla L. BMC Complementary Alternative Medicine. 12: 221.
Nielsen Suzanne S. 2010. Phenol-sulfuric acid method for total carbohydrates. In: Nielsen, Suzanne S ed. Food analysis laboratory manual. Food Science Texts Series. Boston: Springer. 47-53.
Nyamai, D.W., Arika, W., Ogola, P.E., Njagi, E.N.M., and Ngugi, M.P. 2016. Medicinally important phytochemicals: An untapped research avenue. Res Rev: Journal of Pharmacognosy and Photochemistry. 4: 35-49.
Obadoni, B.O. and Ochuko, P.O. 2002. Phytochemical studies and comparative efficacy of the crude extracts of some haemostatic plants in edo and delta states of Nigeria. Global Journal Pure Applied Science. 8: 203-208.
Okwu, D.E. 2004. Phytochemicals and vitamin content of indigenous spices of South Eastern Nigeria. Journal of Sustain Agricultural Environment. 6: 30–34.
Om, S.C., Amit, J., and Bal, K.D. 2012. Pharmacognostical, phytochemical evaluation and antiinflammatory activity of stem of Kalanchoe pinnata pers. International Journal of Pharm Science and Research. 3: 1133-1140.
Omojate, G.C., Enwa, F.O., Jewo, A., and Eze, C.O. 2014. Mechanisms of antimicrobial actions of phytochemicals against enteric pathogens – A Review. Journal of Pharmaceutical, Chemical and Biological science. 2: 77-85.
Pachaiyappan, A., Muthuvel, A., Sadhasivam, G., Vidhya Sankar, V.J., Sridhar, N., and Kumar, M. 2014. In vitro antioxidant activity of different Gastropods, Bivalves and Echinoderm by solvent extraction method. International Journal of Pharm Science and Research. 5: 2539-2545.
Pandurangan, P., Sahadeven, M., Sunkar, S., and Dhana, S.K. 2018. Comparative analysis of biochemical compounds of leaf, flower and fruit of Couroupita guianensis and synthesis of silver nanoparticles. Pharmacognosy Journal. 10: 315-323.
Pearson, D. 1976. Chemical analysis of foods. London, UK: Church Hill Livingstone.
Raja S. and Ravindranadh K. 2014. Phyto, physicochemical standardization and TLC fingerprinting of Medicinal plant Couroupita guianensis. International Journal of phytomedicine. 6: 587-584.
Rehab, A.H., Amira, A., and El-Anssary. 2018. Plants secondary metabolites: The key drivers of the pharmacological actions of medicinal plants. In: Philip F. Builders. Herbal Medicine. IntechOpen.
Rehana, B.H. and Nagarajan, N. 2014. TLC and HPTLC fingerprinting of leaf extracts of Wedelia chinensis (Osbeck) Merrill. Journal Pharmacognosy and Phytochemistry. 2: 29-33.
Rocha, R.P., Melo, E.C., and Radünz, L.L. 2011. Influence of drying process on the quality of medicinal plants: a review. Journal of Medicinal Plant Research. 5: 7076-7084.
Saboon, Chaudhari S.K., Arshad, S., Amjad, M.S., and Akhtar, M.S. 2019. Natural compounds extracted from medicinal plants and their applications. In: Akhtar M, Swamy M, Sinniah U ed. Natural bio-active compounds. Singapore: Springer.
Sadasivam, S. and Manickam A. 1992. Biochemical methods for agricultural sciences. India: Wiley Eastern.
Sangeetha, P., Suganya, V., Bhuvana, P., Anuradha, V., and Syed Ali, M. 2018. Physicochemical characterization and drug standardization of Nannochloropsis Oculata. World Journal of pharm medicine research. 4: 167-171.
Sayeed, A. 2007. Pharmacognosy: Introduction of plant constituents and their tests. Faculty of Pharmacy. Jamia Hamdard, New Delhi, India.
Sheba, L.A. and Anuradha, V. 2020. An updated review on Couroupita guianensis Aubl: a sacred plant of India with myriad medicinal properties. Journal of Herbmed Pharmacology. 9: 1-11.
Singleton, V.L., and Rossi, J.A. 1965. Colorimetry of total phenolics with phosphomolybdic‒phosphotungstic acid reagents. American Journal of Enology Viticulture. 16: 144‒158.
Sirisha, M. and Jaishree, V. 2018. Phytochemical screening, antioxidant and antiproliferative activities of successive extracts of Couroupita guianensis Aubl. Plant. Indian Journal of Natural Products and Resources. 9: 22-27.
Trouvelot, S., Heloir, M., Poinssot, B., Gauthier., A., Paris, F., Guillier, C., Combier, M., Trda, L., Daire. X., and Adrian, M. 2014. Carbohydrates in plant immunity and plant protection: roles and potential application as foliar sprays. Front. Plant Sci. 5: 592.
Vatsa, E., Chandel, S., Parashar, B., and Neeru. 2016. Physico-chemical and phytochemical evaluation of Dendrobium macraei Lindl. (Whole Plant). International Journal of Pharmacognosy Phytochemsitry. 8: 1801-1811.
Wagner, H., Baldt, S., and Zgnaisnki, E.M. 1996. Plant drug analysis. Berlin: Springer.
OPEN access freely available online
Chiang Mai University Journal of Natural Sciences [ISSN 16851994]
Chiang Mai University, Thailand
https://cmuj.cmu.ac.th
Lawrence Anna Sheba1, 2 and Anuradha Venkatraman1,*
1 Department of Biochemistry, Mohamed Sathak College of Arts and Science, Chennai 6000199, India
2 Department of Biochemistry, Soka Ikeda College of Arts and Science for Women, Chennai 600099, India
Corresponding author: Anuradha Venkatraman, E-mail: vanuradha2712@gmail.com
Total Article Views
Editor: Nisit Kittipongpatana,
Chiang Mai University, Thailand
Article history:
Received: April 14, 2021;
Revised: May 5, 2021;
Accepted: June 9, 2021;