Dynamics of Pulmonary Functions based on Body Mass Index Categories in Wet-Blue Leather Tannery Workers
Irfan Saleem*, Zulfiqur Ali, Ali Hussain, Sana Hafeez, Gaitee JoshuaPublished Date : 2021-09-13
DOI : https://doi.org/10.12982/CMUJNS.2021.072
Journal Issues : Number 4, October-December 2021
Abstract Almost 30% of the global population is obese and overweight. In Pakistan, the latest research reveals that 28% of peoples are overweight and 16% obese. However, scarce data is available to report a relationship between obesity and pulmonary health in workers. For this reason, the current study aimed to study dynamics of pulmonary function parameters based on body mass index (BMI) categories, through a spirometer device, among wet-blue leather tannery workers. A total of 116 male tannery workers was selected as a studied population. Workers excluded who had age < 20 years, ever-smokers; respiratory disorders, cardiac illness, diabetes, and hypertension. The study was conducted between September to December 2019. Age, height, weight, and BMI were noted. The following BMI categories were used: normal-weight (18.5-24.9), overweight (25.0-29.9), and obese (≥ 30.0). The Pearson correlation test was run to determine was any linear correlation between pulmonary function parameters and BMI categories. Age, weight and BMI showed statistical differences in all BMI categories except height (P= 0.058). In obese and overweight workers, lower mean values of the pulmonary function parameters were observed compared to normal weight workers, respectively. A significant a significant linear correlation between FEV1 %, FVC % and BMI categories except for FEV1/FVC. It was concluded that obese and overweight workers might have reduced pulmonary function parameters. Future studies among tannery workers are highly recommended to find a correlation between BMI categories and pulmonary function with dust exposure.
Keywords: Body mass index, Lung, Obesity, Overweight, Pakistan
Citation: Saleem, I., Ali, Z., Hussain, A., Hafeez, S., Joshua, G. 2021. Dynamics of pulmonary functions based on body mass index categories in wet-blue leather tannery workers. CMU J. Nat. Sci. 20(4): e2021072.
INTRODUCTION
The superiority of obesity has reached epidemic proportions (Peters and Dixon, 2018) and affects virtually 30% of the worldwide population. Pakistan has been declared the ninth most obese country (Siddiqui et al., 2018) and latest researches reveal that 28% peoples are overweight and 16% obese (Dennis et al., 2006). The World Health Organization defines obesity and overweight as inordinate fat storage that may undermine wellness. A simple index to measure obesity and overweight is body mass index (BMI) in kg/m2. Obesity is declared at BMI < = 30 kg/m2 (WHO, 2020).
It has been frequently reported among workers that they have reduced lung capacity due to poor environmental conditions such as dust exposure and air pollution. Moreover, some other physical factors of the human body like age, ethnicity, etc. may be involved in the declining respiratory capacity of the lungs (Chandrasekaran et al., 2014; Jamal et al., 2017; Dalju et al., 2019; Ahmad and Balkhyour, 2020; Gholami et al., 2020). On the other hand, over-accumulation of fat in the human body in the form of obesity and overweight may be associated with hazardous occupational conditions. Notably, the peril of obesity is escalating in polluted workplaces and reported as allied agents in the development of heart problems (Mafort et al., 2016) and lung diseases commonly reported at workplaces (Schulte et al., 2017). Obesity is influential in declining lung capacity independent from the dust exposure (Khade et al., 2018) and acts through different modalities such as the constriction of the respiratory tract.
The mechanical attributes of the lung and chest wall become compromised due to the deposition of fat, hence reducing compliance in respiratory performance (Jones and Nzekwu, 2006; Peters and Dixon, 2018). In Pakistan, scarce data of the workers is available to examine a correlation between obesity and lung functions. Hence, the present study was planned to measure a relationship between lung functions and body mass index (BMI) categories among wet-blue leather tannery workers of Kasur city, Pakistan.
MATERIALS AND METHODS
One hundred sixteen tannery workers were selected from four different wet-blue leather tanneries in Kasur city, Pakistan. The research was carried out between September-December 2019. There was no female tannery worker in the studied tanneries.
Exclusion criteria
Subjects with age less than 20 years, ever-smokers, lung and heart illness, diabetes, and high blood pressure were excluded.
Bioethical clearance certificate
A bioethical clearance certificate was obtained through the departmental ethical committee of the University of Punjab, Pakistan.
Anthropometric measurements
Anthropometric measurements such as age in years (yr), height in centimeter (cm), weight in kilogram (kg), and body mass index (BMI in kg/m2) measured from 116 tannery workers. BMI categorized as normal-weight (BMI: 18.5- 24.9), overweight (BMI: 25.0-29.9), and obese (BMI: ≥ 30.0). All data noted on the data collection proforma.
Spirometry
A portable spirometer (Spirotron MDX, USA) was used to perform these tests. Before performing spirometry, all anthropometric data was entered into the spirometer. The methodology and guidelines were adopted from Townsend et al., (2000) and Viegas et al., (2017). The test was performed at their workplace from 9.00 AM to 12:00 PM. The test was repeated if not performed accurately. Participants in a comfortable sitting posture performed all tests by using nose clips. The highest reading was considered among the three taken values.
Pulmonary function parameters
These parameters were forced expiratory volume in one second (FEV1), forced vital capacity (FVC), and the ratio of FEV1 and FVC (FEV1/FVC). The values were taken as percentage predicted for FEV1 and FVC.
Statistical analysis
All information input was analyzed through SPSS (version 25). The mean and standard deviation of all anthropometric and pulmonary function data was determined and analyzed through one-way analysis of variance (ANOVA). Pearson correlation was used to find out the linear correlation between BMI categories and pulmonary function parameters. Statistical analysis was performed applying a significant value of 0.05.
RESULTS
Mean values of all variables were studied after stratification based on BMI categories in the studied population (n=116). A strong statistical difference (P ≤ 0.05) was shown by all variables except height (P = 0.058) in different categories of BMI (Table 1).
|
Table 1. Characteristics stratified based on of BMI Categories. |
||||
|
Variables |
BMI Category |
*P-value |
||
|
Normal |
Overweight |
Obese |
||
|
Age (yr) |
36.60 ± 10.76 |
38.88 ± 10.23 |
43.15 ± 9.90 |
0.034 |
|
Height (cm) |
163.24 ± 10.42 |
158.33 ± 9.36 |
157.52 ± 9.73 |
0.058 |
|
Weight (kg) |
60.72 ± 10.17 |
69.83 ± 10.42 |
84.55 ± 10.18 |
0.000 |
|
BMI (kg/m2) |
22.64 ± 1.61 |
27.77 ± 1.48 |
34.11 ± 3.39 |
0.000 |
|
FEV1 % |
86.04 ± 4.92 |
75.50 ± 3.22 |
65.21 ± 2.87 |
0.000 |
|
FVC % |
87.84 ± 1.62 |
81.39 ± 3.90 |
74.71 ± 6.91 |
0.000 |
|
FEV1/FVC % |
97.97 ± 5.87 |
92.89 ± 4.12 |
87.76 ± 6.15 |
0.000 |
|
Note: Data indicated as Mean± SD; *P ≤ 0.05 is significant and calculated through ANOVA |
||||
In the current study, mean values of pulmonary function parameters were reduced at maximum in obese workers than overweight and normal. Obese workers had lower values of FEV1 % (65.21 ± 2.87) than overweight (75.50 ± 3.22) and normal-weight workers (86.04 ± 4.92). Similarly, Similarly, FVC and FEV1/FVC had shown reduced mean values in obese workers (74.71 ± 6.91) (87.76 ± 6.15) as compared to the normal weight (87.84 ± 1.62) (97.97 ± 5.87), respectively (Table 1). A correlation between pulmonary function parameters and BMI was determined (Table 2). A negative correlation was found between BMI and FEV1, FVC and FEV1/FVC with a statistical significance (P = 0.000).
Table 2. Relationship between pulmonary function parameters and BMI (kg/m2).
|
|
FEV1 |
FVC |
FEV1/FVC |
|
|
BMI |
Pearson Correlation |
-.914** |
-.818** |
-.478** |
|
Sig. (2-tailed) |
.000 |
.000 |
.000 |
|
|
N |
116 |
116 |
116 |
|
Note: **Correlation is significant at the 0.01 level (2-tailed). , *Correlation is significant at the 0.05 level (2-tailed).
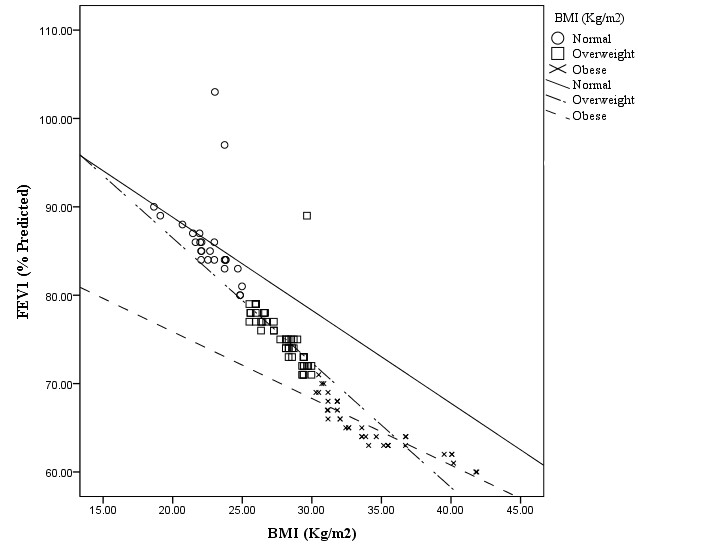
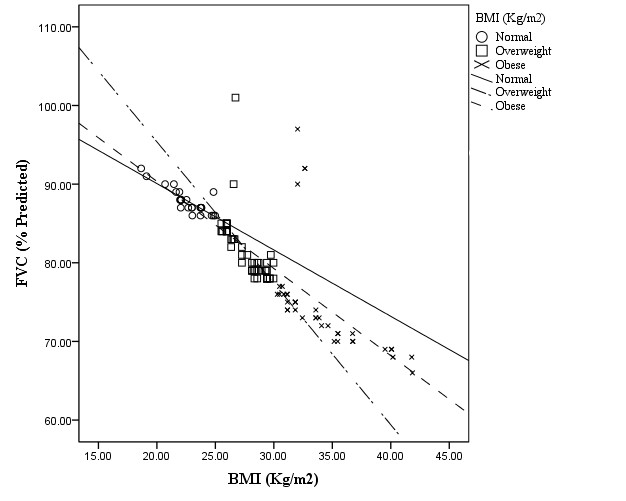
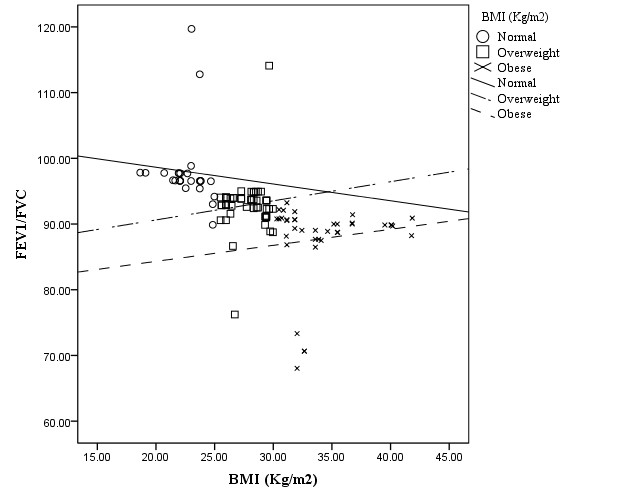
Furthermore, a linear correlation was also determined between BMI and pulmonary functions parameters split by BMI categories. BMI showed linear correlation with FEV1 in obese workers (r = - 0.892; P < 0.001) and overweight (r = - 0.650; P < 0.001) as shown in Figure 1. Similarly, BMI had linear correlation with FVC in obese workers (r = - 0.545, P = < 0.001) and overweight (r = - 0.683; P = < 0.001) (Figure 2). However, in case of FEV1/FVC %, the correlation was insignificant (P > 0.05) (Figure 3).

Figure 1. Effect of increasing BMI on FEV1 percentage predicted split by BMI categories.
The Pearson correlation coefficients split by BMI category in the above figure are:
Normal: r = - 0.346, p = 0.90;
Overweight: r = - 0.650, P <0.001*;
Obese: r = - 0.892, P = <0.001*; * Significant at P < 0.05 level.

Figure 2. Effect of increasing BMI on FVC percentage predicted split by BMI categories.
The Pearson correlation coefficients split by BMI category in the above figure are:
Normal: r = - 0.841, P =<0.001*;
Overweight: r = - 0.683, P = <0.001*;
Obese: r = - 0.545, P = <0.001*; * Significant at P < 0.05 level.

Figure 3. Effect of increasing BMI on FEV1/FVC percentage split by BMI categories.
The Pearson correlation coefficients split by BMI category in the above figure are:
Normal: r = - 0.070, P = 0.738
Overweight: r = 0.105, P = 0.456
Obese: r = 0.135, P = 0.420
DISCUSSION
In the present study, a measurable difference in the mean values of FEV1, FVC and FEV1/FVC was obtained in all BMI categories at the significant level of P = 0.00. A study was conducted among healthy peoples of Sindh by Bhatti et al. (2019), also reported significant variations (P < 0.01) shown by all lung function values except FVC in different BMI categories.
Mean values of all studied pulmonary functions parameters were lowered in obese (BMI > 30 kg/m2) and overweight workers (BMI: 25.0-29.9 kg/m2) as compared to normal weight (BMI < 25 kg/m2). Previous studies conducted among workers and adults endorse current findings. They concluded that obese people had lower mean values of FEV1 and FVC than normal weight workers (Khade et al., 2018; Bhatti et al., 2019). However, the present finding was dissimilar from Wang et al., (2017), who reported that only FVC was reduced in obese peoples. This confliction, perhaps, a based on different standards set for the classifications of BMI categories and different sample sizes.
A negative correlation was found between BMI and pulmonary function parameters with a significant statistical difference (P = 0.000). It may be because the deposition of fat leads to decrease in respiratory performance (Salome et al., 2010). The results were in line with the findings of Attaur-Rasool et al., (2012), who reported that FEV1% and FVC% were negatively correlated with BMI in both males (P < 0.001) and females adults (P < 0.022). Another study backed up the present findings that all pulmonary functions negatively correlate with BMI in the rural population (Kharodi et al., 2019).
In the present investigation, BMI and FEV1 showed negative linear correlation in overweight (r = - 0.650) and obese workers (r = - 0.892). This finding was consistent with the findings of Attaur-Rasool et al., (2012). According to them, BMI and FEV1 showed a negative linear correlation in overweight (r = -0.10) and obese workers (r = -0.48). Similarly, BMI and FVC showed strong linear relationship in overweight (r = - 0.683) and obese workers (r = - 0.545). This result also agreed with the results reported by Attaur-Rasool et al., (2012), where FVC and BMI showed a linear correlation in overweight (r = -0.19) and obese workers (r = -0.48). However, there was an exceptional result in the present study where FEV1/FVC did not show a linear correlation with BMI. This finding was in agreement with Helala et al., (2014).
CONCLUSION
The current study points to the conclusion that pulmonary function parameters decline with an increase in BMI. Overweight and obese tannery workers had reduced FEV1 and FVC as compared to normal-weight workers. We observed a linear correlation between FEV1, FVC and BMI categories. Future research among tannery workers is highly recommended to find a correlation between BMI categories and pulmonary function with dust exposure.
LIMITATIONS OF THE STUDY
This work suffers from several of limitations. For example, the sample size was limited. The possible effect of gender on pulmonary function could not be observed due to the non-availbility of female tannery workers. Dust exposure, ethnicity, and body fat distribution were not evaluated.
ACKNOWLEDGMENTS
The authors would like to express special thanks of gratitude in carrying out the statistical analysis as well as language content editing by Muhammad Noman Malik.
CONFLICT OF INTEREST
There is no conflict of interest to uncover.
REFERENCES
Ahmad, I., and Balkhyour, M.A. 2020. Occupational exposure and respiratory health of workers at small scale industries. Saudi Journal of Biological Sciences 27: 985-990.
Attaur-Rasool, S., and Shirwany, T.A. 2012. Body mass index and dynamic lung volume in office workers. Journal of the College of Physicians and Surgeons Pakistan 22: 163-167.
Bhatti, U., Laghari, Z.A., and Syed, B.M. 2019. Effect of body mass index on respiratory parameters: A cross-sectional analytical study. Pakistan Journal of Medical Sciences. 35: 1724-1729.
Chandrasekaran, V., Dilara, K., and Padmavathi, R. 2014. Pulmonary functions in tannery workers--a cross sectional study. Indian Journal of Physiology and Pharmacology. 58: 206-210.
Dalju, I., Dessie, A., Bogale, L., and Mekonnen, T.H. 2019. Occupational risk factors associated with respiratory symptoms among tannery workers in Mojo town, Southeast Ethiopia, 2018: a comparative cross-sectional study. Multidisciplinary Respiratory Medicine. 14: 1-10.
Dennis, B., Aziz, K., She, L., Faruqui, A.M., Davis, C.E., Manolio, T.A., Burke, G.L., and Aziz, S.D. 2006. High rates of obesity and cardiovascular disease risk factors in lower middle class community in Pakistan: the Metroville Health Study. Journal of Pakistan Medical Association 56: 267-272.
Gholami, A., Tajik, R., Atif, K., Zarei, A.A., Abbaspour, S., Teimori-Boghsani, G., and Attar, M. 2020. Respiratory symptoms and diminished lung functions associated with occupational dust exposure among iron ore mine workers in Iran. Open Respiratory Medicine Journal. 14:1-7.
Helala, L., Wagih, K., and El Monem, M.A. 2014. Study the relation between body mass index, waist circumference and spirometry in COPD patients. Egyptian Journal of Chest Diseases and Tuberculosis. 63: 321-327.
Jamal, A., Mehmood, A., Putus, T., Savolainen, H., and Liesivuori, J. 2017. Prevalence of respiratory symptoms, bronchial asthma and obstructive lung disease among tannery workers. Peertechz Journal of Environmental Science and Toxicology. 2: 33-42.
Jones, R.L., and Nzekwu, M.M.U. 2006. The effects of body mass index on lung volume. Chest. 130: 827-833.
Khade, Y.S., Bagali, S., and Aithala, M. 2018. Impaired pulmonary lung function in workers exposed to bagasse: Is obesity an added risk? Indian Journal of Occupational and Environmental Medicine. 22: 92-96.
Kharodi, C., Goel, A., Puri, N., and Singh, S. 2019. Correlation of body mass index with pulmonary function tests in North Indian females. International Journal of Contemporary Medical Research 6: 10-12.
Mafort, T.T., Rufino, R., Costa, C.H., and Lopes, A.J. 2016. Obesity: systemic and pulmonary complications, biochemical abnormalities, and impairment of lung function. Multidisciplinary Respiratory Medicine 11: 1-11.
Peters, U., and Dixon, A.E. 2018. The effect of obesity on lung function. Expert Review of Respiratory Medicine 12: 755-767.
Salome, C.M., King, G.G., and Bernard, N. 2010. Physiology of obesity and effects on lung function. Journal of Applied Physiology 108: 206-11.
Schulte, P.A., Wagner, G.R., Ostry, A., Blanciforti, L.A., Cutlip, R.G., Krajnak, K.M., Luster, M., Munson, A.E., O’Callaghan, J.P., Parks, C.G., Simeonova, P.P., and Miller, D.B. 2017.Work, obesity, and occupational safety and health. American journal of public health 97: 428-436.
Siddiqui, M., Hameed, R., Nadeem, M., Mohammad, T., Simbak, N., Latif A.Z.A., Abubakar, Y., and Baig, A.A. 2018. Obesity in Pakistan; current and future perceptions. Current Trends in Biomedical Engineering & Biosciences 17: 20-23.
Townsend, M.C., Lockey, J.E., and Velez, H. 2000. ACOEM position statement. Spirometry in the occupational setting. Journal of occupational and environmental medicine. 42: 228-245.
Viegas, S., Caetano, L.A., Korkalainen, M., Faria, T., Pacífico, C., Gomes, A.Q., and Viegas, C. 2017. Cytotoxic and inflammatory potential of air samples from occupational settings with exposure to organic dust. Toxics 5: 1-16.
Wang, S., Sun, X., Hsia, T.C., Lin, X., and Li, M. 2017. The effects of body mass index on spirometry tests among adults in Xi’an, China. Medicine. 96: 1-4.
World Health Organization. 2020. Obesity and overweight [online]. Website https://www.who.int/news-room/fact-sheets/detail/obesity-and-overweight. [Accessed 10 November 2020].
OPEN access freely available online
Chiang Mai University Journal of Natural Sciences [ISSN 16851994]
Chiang Mai University, Thailand
https://cmuj.cmu.ac.th
Irfan Saleem1,*, Zulfiqur Ali2, Ali Hussain3, Sana Hafeez4, Gaitee Joshua5
1, 2, 4 Department of Zoology University of the Punjab, Lahore, Pakistan
3 Department of Wildlife and Ecology, University of Veterinary and Animal Sciences, Pattoki, Pakistan
5 Department of Zoology, Kinnaird College for Women University Lahore, Pakistan
Corresponding author: Irfan Saleem, E-mail: irfansaleemssbio@gmail.com
Total Article Views
Editor: Veerasak Punyapornwithay,
Chiang Mai University, Thailand
Article history:
Received: January 6, 2021;
Revised: April 17, 2021;
Accepted: April 27, 2021;

