 ISSN: 2822-0838 Online

Valuation of External Costs of Wet-Season Lowland Rice Production Systems in Northern Thailand
Kamthorn Thambhitaks* and Jirawan Kitchaicharoen
Published Date : 2021-04-01
DOI : https://doi.org/10.12982/CMUJNS.2021.057
Journal Issues :
Number 3, July-September 2021
Valuation of External Costs of Wet-Season Lowland Rice Production Systems in Northern Thailand
Abstract This study aims to assess the external costs of environmental impacts associated with the rice production systems using LCA approach and evaluated them into the economic value. The study compared the different chemical and energy use, as well as straw management of the three different rice production systems, included the mainstream conventional rice system, GAP rice system, and the organic rice system in Northern Thailand. The LCA analysis quantified the midpoint and endpoint of five environmental impacts, including climate change, terrestrial acidification, eutrophication, water depletion, and human health damage, from cradle-to-farm gate.
The results of economic valuation revealed that the external costs of the conventional and GAP rice systems have significantly higher than that of the organic system. Most external costs came from the wastewater treatment cost due to the eutrophication mainly arising from the use of chemical fertilizer. Besides, about one-fourth of the total external costs came from the human health damage cost due to the open-air rice straw burning. To reduce the external costs of rice production, the amount of chemical fertilizer use causing eutrophication should be diminished and replaced by applying organic fertilizer from incorporating rice straw into the soil as well as growing a rotational crop after rice cultivation to stop the open-air rice straw burning and reduced the human health damage. The government should encourage rice farmers to the organic rice farming and manage the rice straw without burning because they may have the cost burden, whereas society gains more benefits from less pollution.
Keywords: Economic valuation, Environmental impacts, Life Cycle Assessment, Rice production systems, Thai Good Agricultural Practice
Citation: Thambhitaks, K. and Kitchaicharoen, J. 2021. Valuation of external costs of wet-season lowland rice production systems in Northern Thailand. CMUJ. Nat. Sci. 20(3): e2021057.
INTRODUCTION
Rice is Thailand’s most important crop for both consumption and export. Thailand produced 27 million tons of rice in 2018 and rice export (11.5 million tons) (OAE, 2019). However, conventional rice production has led to a growing number of environmental and health impacts. Excessive use of chemical fertilizers and pesticides in rice production has polluted surface water and groundwater through seepage (Pathak et al., 2006; Tirado et al., 2008; PCD, 2011). Some pesticide uses of paddy farming have also affected farmers’ health as it decreased the level of acetylcholinesterase (AchE) in farmers’ blood (Aittiphol et al., 2014). Traditional rice growing in flooded fields have produced vast amounts of methane greenhouse gas (ONEP, 2000; Sakaorat et al., 2009). Besides, open-field burning of rice straw after harvesting has generated air pollution, especially in Northern Thailand (Gadde et al., 2009; Thambhitaks et al., 2019). These negative environmental impacts and health damage also have generated the external costs to farmers and society which were omitted from the cost of rice production. Even though there has been the promotion of organic rice production and the reduction of open-field burning in Thailand, there is still less practice due to a lack of strong supports from the government. In this paper, we will comparatively analyze the negative impacts of rice production systems using Life Cycle Assessment approach and evaluate the negative impacts into monetary terms (economic value) as the external costs of rice production as well as identify which production activity created the most external cost. The findings will provide a clear understanding of the steps essential for management attention to lower negative impacts and promote the environment-friendly rice production systems.
MATERIALS AND METHODS
Rice production in Thailand has been distinguished into three systems based on the input use and management criteria for the purposes of certification, and environmental and consumer concern. These systems include the mainstream conventional systems (CON) in which chemical fertilizers and pesticides are usually applied based on farmers’ knowledge and experience, the GAP systems in which farmers can apply chemical fertilizers and pesticides by following the Thai Good Agricultural Practice Standard, and the organic system (OR) in which farmers cannot use any chemicals for production. All three rice production systems are investigated in terms of method and input factors from the stage of land preparation, planting, cultural practices, to the stage of harvesting. This study on the environmental impacts deals with the significant environmental impacts (climate change, terrestrial acidification, eutrophication, water depletion and human health damages) which are calculated to obtain the negative externality costs of each rice production system. The assessment is made employing the Life Cycle Analysis (LCA) algorithm and economic value.
Study area and sample collection
The target population in the study area was in the plain valley between the Kok River and Ing River Basin and focused on rain fad rice of lowland production system in Chiang Rai and Phayao. The number of rice-growing households was surveyed during the crop-year 2015/16, coming to a total of 413 samples (without controlled) which was determined using the Taro Yemen technique at the 95 % confidence level. These numbers consisted of CON farmers 82% (329 cases), good agricultural GAP farmers 14% (58 cases) and OR farmers 4% (26 cases).
Life Cycle Analysis (LCA)
This study applies LCA (cradle-to-gate) to evaluate the effect of a production activity throughout the entire period of its life cycle (Hayashi et al., 2006). The study hypothesis is that different rice production systems use the dissimilar quantity of input factors (fertilizer, fuel, pesticide ---field data---) and pollute mainly the different quantity of environmental impacts (the midpoint level) which includes climate change, acidification, eutrophication, water depletion, and human toxicity. Additionally, the endpoint level is human health damage which is expressed by Disability of Adjust Life Year (DALY) following the manual report of ReCiPe 2008 (Mark et al., 2008). The assessment of midpoint level and endpoint level are made on functional of area (land size: rai) and a kilogram of rice (Hayashi et al., 2006; Gian et al., 2009; Hokazono et al., 2009)
Besides, the pollutant of fertilizer used, NUTMOM approach is used to calculate the precise amount of nitrogen and potassium leaching for LCA from fertilizer used (Willigen, 2000). The assessment of the methane from the decomposition organic matters (DOM) and open-air rice straw burning (ORSB) are separately calculated by the IPCC method (IPCC, 1996, 2006; Gadde et al., 2009; Siriruk et al., 2013) as showed in Figure 1.
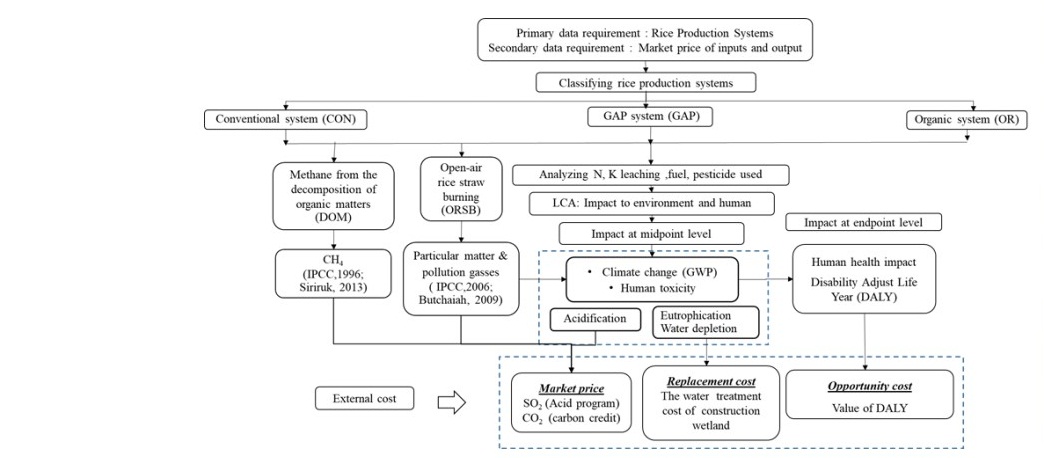
Figure 1. Conceptual framework.
Estimate of CH4 from the decomposition of organic matters (DOM)
To estimate the volume of methane, this study adopts the formula of IPCC (1996) and Siriruk (2013) as shown in Equation 1
CH4 emission from paddy field (kg CH4) =EF * SF *A * T * 10-3 --- (1)
EF is the emission factor of CH4 in the rice paddy field (g CH4 / day.m2) that is 0.2. SF is the scaling factor of water of paddy field in season that is 1.4. A is paddy area (m2). T (field data) is the total day of rice cropping season (125 days).
Assessment of environmental impacts from open-air rice straw burning (ORSB)
In order to quantify the gas emission from ORSB, the initial step is to estimate the quantity of rice straw burning based on the quantity of rough rice product (yield) as shown by equations (2) and (3) (Gadde et al., 2009).
QSSFB = PRR*SGR*QSFB --- (2)
Where QSSFB is the quantity of rice straw subject to open burning in kg per rai. PRR(field data) is the rough rice production in kg per rai. SGR is a straw to grain ratio (0.75). QSFB (field data) is a proportion of rice straw subject to open field burning (%). The next step is to estimate GHG emissions from the quantity of rice straw open burning by the following equation (3)
Ea = QSFB * EFa * fco --- (3)
Ea is the emission of a (type of greenhouse gas) in kg per rai. EFa is the emission factor of a in gram per kg of dry straw. fco is the combustion factor 0.8. Additionally, the emission factors (EFa) for GHGs emitted from ORSB (1,460 of CO2, 1.2 of CH4, 0.07 of N2O, 34.7 of CO, 4 of NMHC, 3.1 of NOx, 2.0 of SO2, 12.95 of PM2.5, 3.7 of PM10, 18.62 x 10⁻³ of PAH and 5 x 10⁻¹⁰ of PCDD) (IPCC, 2006; Gadde et al., 2009).
Assessment disability-adjusted life year (DALY)
Following the assessment of human health damage from climate change, human toxicity and particulate matter (PM), WHO (2013) has developed a measure of a life year lost from mortality and morbidity in 1993 and called the disability-adjusted life year (DALY). The calculation of DALY of LCA is made by characterization factors (CFs) of emission impacts (climate change and human toxicity) (Mark et al., 2008). To calculate DALY of GHGs and particulate matter (PM) from open-air rice straw burning (ORSB), the marginal changes of GHGs and PM emission from ORSB are considered (Rosalie et al., 2008). In this study CFs (DALY per 1 kg emission gas) are CO2 1.19 x 10⁻⁶, NMHC 1.28 x10⁻⁶, NOx 5.7 x10⁻⁵, SO2 5.1 x10⁻⁵, PM2.5 3.02 x10⁻⁷, PM10 0.00026, PAH 1.7 x10⁻⁴ and PCDD 2.02 x10⁻³ (Mark et al., 2008; Rosalie et al., 2008; CML, 2016; UNEP, 2017).
Calculation of external costs
The external costs of rice production are calculated by the quantity of environmental impacts (CH4 decomposition of organic matters, open-air rice straw burning, climate change, terrestrial acidification, eutrophication, and human health damage) multiply with prices (the market price of CO2 and SO2, the replacement cost of water treatment, and the opportunity cost of human health damage) as follows.
Environmental impacts cost of climate change and terrestrial acidification, the amount of gas emission equivalent CO2 and SO2 are multiplied with its market prices which are the average CO2 price of European Emission Allowances 12 months (January – December 2017) (EUA, 2017; Worldbank, 2018) and the SO2 spot price of 2017 Acid Rain SO2 Allowance Auction program (EPA, 2017). For the cost of eutrophication, this study applies the replacement cost method of the constructed wetland (adjusting the present value). The cost of construction and maintenance was 6.96 baht per m3 (PCD, 2004). Additionally, the critical of the eutrophication problem was considered the weight kg of phosphate, which is larger than 0.00004 kg phosphate per m3 (William et al., 1995).
The cost of human health damage is estimated by the total disability of adjusted- life year (DALY) multiplied with the opportunity costs of illness. The calculation of illness opportunity costs was an acceptable threshold budget of WHO (2002). This number was the budget of developing country for the investment of healthcare improvement each year. The effective cost for reducing one unit of DALY would be less than three times of Gross Domestic Product per head (GDP per capita) (WHO, 2002; John and Ross, 2008). This study applies the average one time of GDP per capita (193,961 baht) during 2012- 16 (Worldbank, 2018).
RESULTS
Inputs and outputs of three different rice production systems
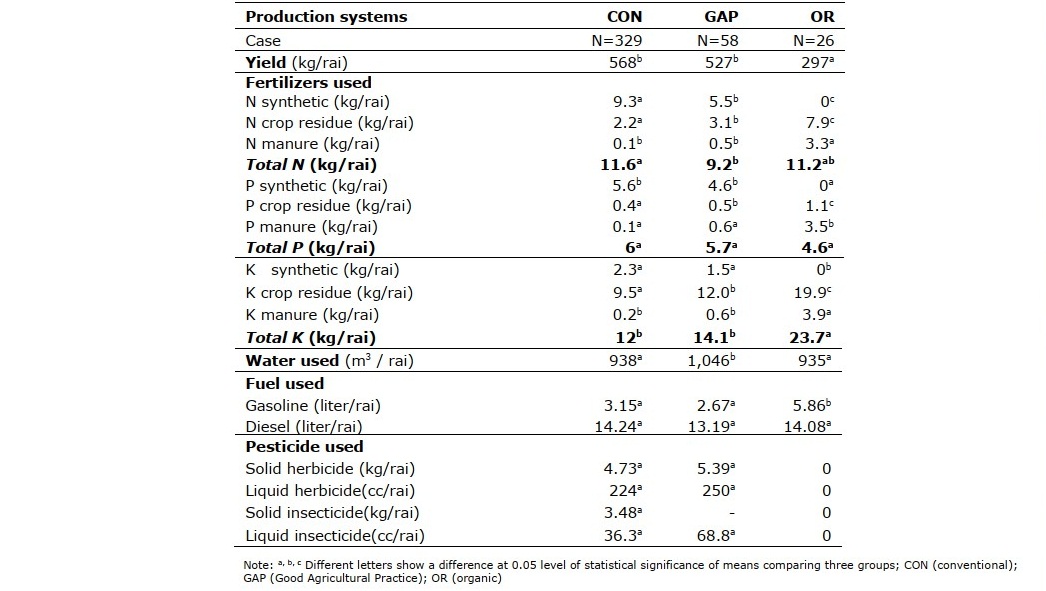
In the study area, rice is cultivated in the water-logged condition under which the microbial decomposition of organic matters in soil produces methane that is released into the atmosphere and the ploughing of crop residues to add organic matters into the soil is partly a cause of the problem. Besides, some farming households in the conventional system (40%) and the GAP system (24%) still burned rice straw residues after harvesting to prepare the land for the next cropping season. The volume of rice produced and that of rice straws vary proportionally in the same direction. The study found rice yield of the organic system to be significantly lower than those in the conventional system and the GAP system, as shown in Table 1.
Rice farmers applied synthetic fertilizers, crop residues (rice straw and rotational crop residues) and animal manure as fertilizers in the rice production.
N fertilizer used. The conventional system used N synthetic fertilizer significantly more than the GAP system. The organic system used N crop residue and N manure significantly higher than the levels in the conventional and the GAP systems. Besides, the total N of the conventional system is significantly more than the GAP system, as shown in Table 1.
P fertilizer used. From nature, most plants receive phosphate from the breakdown of rocks making this fertilizer difficult to dissolve in water and thus plants need the supplement of this nutrient from synthetic phosphate fertilizer. This study found that the total P used was not significantly different across rice production systems, as shown in Table 1.
Meanwhile, the Rice Department has established the recommended doses of 16- 20-0 fertilizer for the production of daylight sensitive rice varieties at 20-35 kg/rai which are equivalent to 3.2-5.6 kg nitrogen (N) /rai and 5.6 -7 kg phosphate (PO4-3)/rai. Meanwhile, if the 46-0-0 fertilizer is applied instead, the recommended rate is 5-10 kg/rai, equivalent to 2.3-4.6 kg nitrogen /rai (RD, 2015). Apparently, the farming households in this study used N fertilizer over the recommended rates.
K fertilizer used. This study found that most of the K fertilizer for rice growth was derived from green manure which is the product of ploughing over the rice straws and stubs and rotational crop residues into the soil. The total K of the organic system were detected significantly higher than those in the conventional system and the GAP system, as shown in Table 1.
Water used. The volume of water used in rice production formed the basis for assessing the amount of water depletion from applying fertilizer and pesticides as well as to determine the replacement cost of eutrophication. The volume of water used for the GAP system was significantly more than those in the conventional system and the organic system, as shown in Table 1.
Fuel used in rice production systems, beginning with the various paddy plot activities including land ploughing, pumping water by a small engine, crop care and plot maintenance, harvesting, and then transportation. The main farm machinery is classified into two types by size: large diesel-operated machines (tractor, two-wheel tractor, cart, combine harvester and water pump) and small gasoline-operated machines (weed mower, fertilizer and pesticide sprayers, and small water pump). The fuel used for machinery shows the average gasoline use per rai for the organic system, which is significantly more than the consumption in the conventional system and the GAP system, as shown in Table 1. The combustion of gasoline and diesel in the engines emit toxic gases to the environment which will be analyzed for impacts in terms of terrestrial acidification and the endpoint of climate change.
Pesticides are used by the farming households in the conventional system and the GAP system for weed control by spraying liquid herbicides before broadcasting rice seeds and before transplanting rice into the main plot. Insecticides in either solid (kg/rai) or liquid (cc/rai) forms are also used if there are plant disease and insect outbreaks. The finding of pesticide used reveals no difference in the pesticide use rate between the two rice systems, as shown in Table 1.
Table 1. Factor inputs in rice production.
Environmental impacts
Climate change. This study assessed the environmental impacts on climate change associated with the methane emitted from the organic matters decomposition process and the removal of crop residues from paddy fields through the open-air rice straws burning (ORSB). The impact was assessed upon the calculated kg CO2 equivalent per rai of the pollutants. The results show that the conventional system has emitted the highest levels of CO2 and followed by the GAP system and the organic system, as shown in Figure 2.
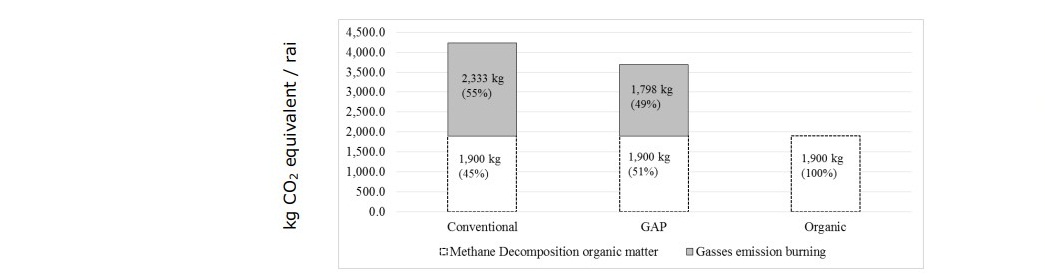
Figure 2. Climate change (kg CO2 equivalent / rai)
Terrestrial acidification was assessed by the weight of air pollutants emission converted into kg equivalent of sulfur dioxide (SO2) per rai from the fertilizer and fuel used. The results show the extent of the terrestrial acidification contributed by all the three rice production systems from the fertilizer used. The lowest SO2 emission is the organic system and followed by the GAP system and the conventional system, as presented in Figure 3.
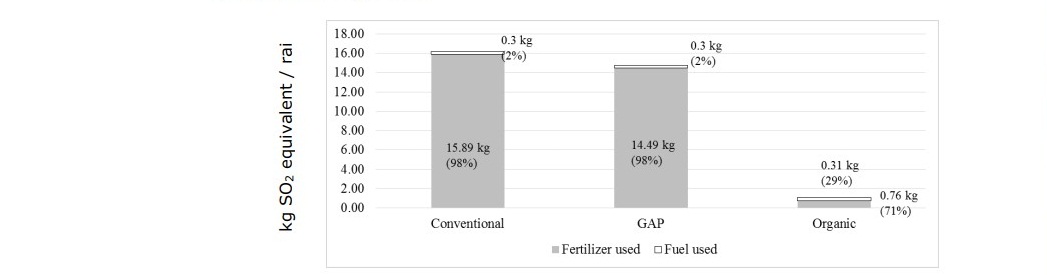
Figure 3. Terrestrial acidification (kg SO2 equivalent /rai)
Water depletion. The estimated volume of water depletion from the fertilizer and pesticide used is used for the estimation of the concentration of water-soluble phosphate and the evaluation of the external cost of eutrophication. The findings indicate that water depletion was primarily caused by the fertilizer used. The total volume of water depletion is accounted mainly by the GAP system and the conventional system and with the relatively smaller amount by the organic system, as shown in Figure 4.

Figure 4. Water depletion (Cubic meter (m3) /rai)
Eutrophication. The eutrophication impact was estimated by the average weight of pollution emissions equivalent to PO4- 3 per rai from the use of fertilizer and pesticide. Most eutrophication was caused by fertilizer use in all three rice production systems and the organic system was lowest PO4- 3, as shown in Figure 5. Besides, the total contribution to eutrophication for all systems was divided by the volumes of water depletion. These provided the concentration rates of the water-soluble PO4- 3 for the conventional system (0.000338 kg/m3), the GAP system (0.0003104 kg/m3) and the organic system (0.0000173 kg/m3). Besides, the concentrations of the water-soluble PO4- 3 of the conventional system and the GAP system are over the threshold level that induces algae booming (William, 1995). Therefore, there is a problem with eutrophication (CON, GAP) in assessing the external costs section.
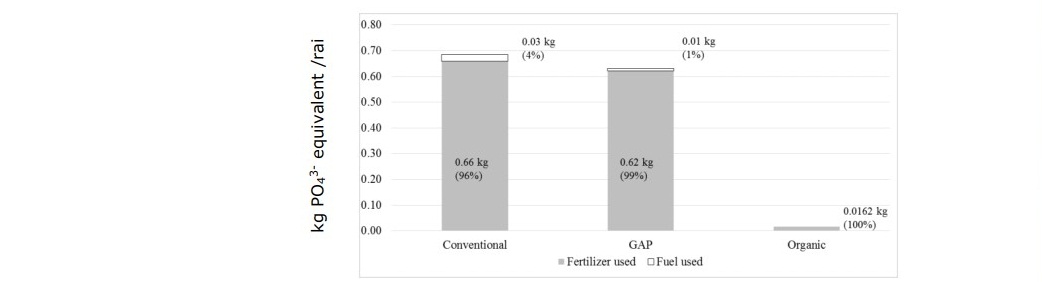
Figure 5. Eutrophication (kg PO43- equivalent /rai)
Human health damage. The environmental impact in terms of human health damage is estimated from 1) pollutants released to the ambient air from the open-air rice straw burning, the midpoint analysis of climate change from 2) fertilizer used, 3) fuel used, 4) pesticide used and 5) human toxicity of pesticide used. This impact is displayed by Disability Adjusted-Life Years (DALY) unit/rai. The results show that most human health damage is caused by the open-air rice straw burning, which happens in the conventional system and GAP system. Some human health damage from the conventional system associated with fertilizer. Meanwhile, human health damage caused by the organic system is shallow, as presented in Figure 6.
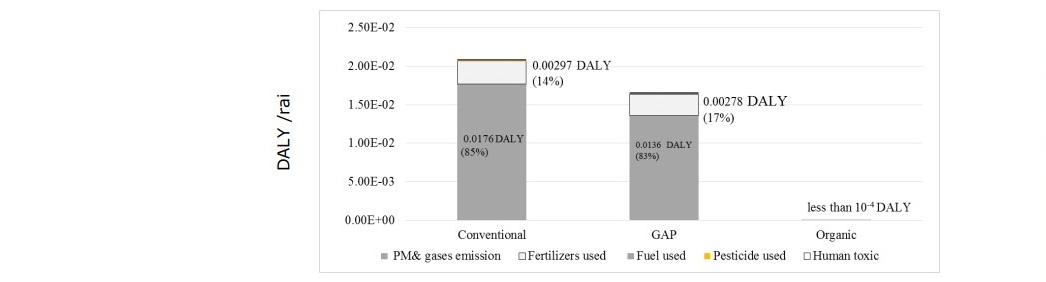
Figure 6. Human health damage (DALY /rai) Monetary value of environmental impacts (External costs)
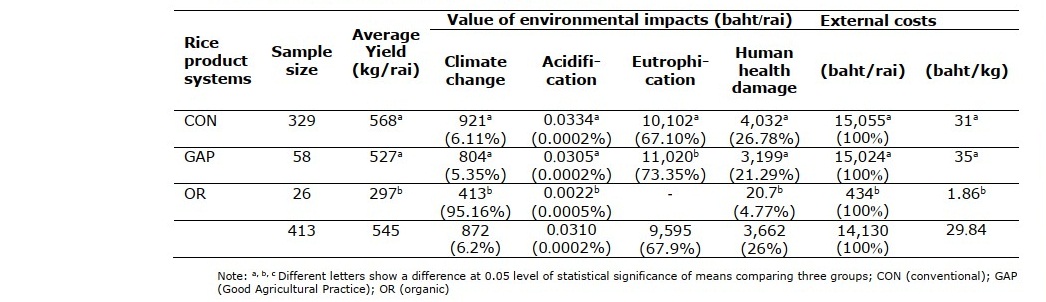
The external costs of impact on climate change, terrestrial acidification and human health damage component of the organic system are significantly lower compared to the conventional system and the GAP system. Besides, the external cost of eutrophication shows that the GAP system is higher significantly than the conventional system. The total external cost of impacts shows the convention system and the GAP system are higher significantly the organic system. The most external cost was caused by the cost of eutrophication (fertilizer used) and followed by the cost of human health damage (the open-air rice straw burning) and the cost of climate change (the open-air rice straw burning) as presented in Table 2.
Table 2. Total environmental impact value.
DISCUSSION
This study has integrated LCA for environmental impact assessment and evaluated the impacts into the economic value (external costs). Accurate calculation of both tools is suitable to compare the external costs of different rice product systems (the conventional rice system, the GAP rice system and the organic rice system)
This study LCA was able to assess both the midpoint environmental impacts (climate change, terrestrial acidification, eutrophication) and the endpoint environmental impacts (human health damage). This study was different from previous studies of Hokazono et al. (2009) which studied the environmental impact of the climate change and eutrophication, and of Akaraphon (2014) which studied mainly the climate change impact as well as of Benoit et al. (2014) which studied only the impact of nitrate leaching.
The result of the external costs show that the organic rice system had less the cost of the negative impacts than other rice systems and was consistent with the study of Hokazono et al. (2009) and Benoit et al. (2014). However, Akaraphon (2014) found particularly issue that the climate change assessment of the organic rice system for the methane emission of organic matter decomposition in the paddy field, GHGs from the open-air burning rice straws and the fertilizer used (both manure and green manure) was higher than the other rice systems. Meanwhile, this study assessed the climate change of the methane emission of organic matter decomposition for all rice systems and found that there were no significant differences among the systems and the diffusion GHGs from the open-air burning rice straw occurred only in the conventional and GAP rice systems. In this study, the GHGs from the fertilizer used was assessed as a part of the endpoint analysis. Besides, the overall result of the endpoint analysis disclosed that the organic rice system produced a lower impact than the other rice systems. Whereas, Hokazono et al. (2009) assessed only the GHGs from fertilizer used and the organic rice system also showed the lowest impact.
The highest impact from the rice production system in this study was from the overuse of fertilizer which had affected eutrophication in both conventional and GAP rice systems. This result was consistent with the previous study of Hokazono et al. (2009), Benoit et al. (2014), and some studies showing the overuse of nitrogen fertilizer caused the water pollution in the central watershed in Thailand (Pathak et al., 2006; PCD, 2011). Besides, the chemical fertilizer used of the conventional and GAP rice systems had affected terrestrial acidification because the production process of chemical fertilizers was the most significant energy consumption and closely related to GHGs emission (Galloway et al., 2003). Therefore, the rice production system must attempt to reduce the environmental impact by the use of the appropriate amount of N for both chemical and organic fertilizers. Soil testing before fertilizer application should be introduced to farmers.
This approach of the study was different from other previous studies. The environmental impact of the rice production process was assessed in the initial stage throughout the endpoint of the human health’s impact, which was rarely found in other studies. Disability-adjusted life years (DALYs) was adapted to assess the human health damage from GHGs, human toxicity of the pesticide used and particular matter of the open-air burning rice straw as well as the pollution emission from the production process of input factors. This approach adapted the study of McMichael et al. (2003).
The external costs of rice production were assessed at the midpoint throughout the endpoint and transformed to be the economic value. The result of this study disclosed that the organic rice production system produced the lowest environmental impact compared to the conventional and GAP systems. The results of this study confirmed the conclusion of Hokazono et al. (2009) and Benoit et al. (2014) that the organic rice production system is beneficial for the health of producers and consumers as well as the environment.
CONCLUSION
The result of the study shows that the conventional and GAP rice systems produced higher the external costs of environmental impacts than the organic rice system. These cost impacts were from the overuse of fertilizer and the open-air burning rice straw. Therefore, to reduce the environmental impacts of rice production, the government has to promote the use of rice straw as organic fertilizer by providing knowledge on how to use it appropriately. For example, farmers should know how many kilograms of rice straw that incorporated into the soil as organic fertilizer can replace the use of one kilogram of synthetic fertilizers. Besides, how much the production cost can be reduced from saving the use of synthetic fertilizers as well as how much the external cost from burning rice straw can be reduced or how good to environment and society to stop burning crop residue. Knowledge on the benefits of using the alternative rice straw of management should be compared to its cost. If a farmer’s benefit is lower than its cost, an incentive payment should be considered in order to reduce the external costs of society.
However, transforming environmental impacts to the economic value has the limitation as the market price is applied. The monetary value of the external cost from climate change and terrestrial acidification seems to be not significant because the carbon price and the spot price of Acid Rain Sulfur Dioxide Allowance Auction program have been declined since 2008 as the international carbon market has been failing. Therefore, the estimation of external costs (climate change, terrestrial acidification) have to use the alternative methods for the next future study.
ACKNOWLEDGEMENTS
The author would like to express my gratitude to academic advisors and staffs of CARSR, Faculty of Agriculture, Graduate School at Chiang Mai University for useful recommendations, helping for this study at Chiang Mai University.
REFERENCES
Akaraphon, H. 2014. Farming management and greenhouse gas emission in paddy field at Srisakrat: seminar of the agricultural carbon footprint project. Available from http://thaipublica.org/wp-content/uploads/2014/09/PPT_.
Aittiphol, D., Bundit, A., and Natha, H. 2014. The use of organophosphate and carbamate pesticides on paddy fields and cholinesterase levels of farmers in Sam Chuk District, Suphan Buri Province, Thailand. Thammasat Internaitonal Journal of Science and Technology. 19.
Benoit, M., Garnier, J., Anglade, J., and Billen, G. 2014. Nitrate leaching from organic and conventional arable crop farms in the Seine Basin. Nutrient Cycling in Agro ecosystems. 100: 285-299.
CML. 2016. CML-IA Characterisation Factors. Institute of Environmental Sciences(CML). Available from https://www.universiteitleiden.nl/en/research/research-output/ science/cml-ia-characterisation-factors# downloads.
EPA. 2017. The spot auction of SO2 Allowance Auction in United States Environmental Protection Agency (EPA). Available from https://www.epa.gov/airmarkets/ 2017-so2-allowance-auction-0#tab-2.
EUA. 2017. Price of CO2 in European Emission Allowances (EUA). Available from http://www.eex.com/en/products/environmental-markets/emissions-auctions/ overview.
Gadde, B., Bonnet, S., Menke, C., and Garivait, S. 2009. Air pollutant emissions from rice straw open field burning in India, Thailand and the Philippines. Environ Pollut. 157: 1554-1558.
Galloway, J.N., Aber, J.D., Erisman, J.W., Seitzinger, S.P., Howarth, R.W., Cowling, E.B., and Cosby, B.J. 2003. The Nitrogen Cascade. BioScience. 53: 341-356.
Gian, A. B. and Busto, M. 2009. The life cycle of rice: LCA of alternative agri-food chain management systems in Vercelli (Italy). Journal of Environmental Management, 90: 1512-1522.
Hayashi, K., Gaillard, G., and Nemecek, T. 2006. Life cycle assessment of agricultural production systems: Current issues and future perspectives, Good Agricultural Practice (GAP) in Asia and Oceania. Proceedings of International Seminar on Technology Development for Good Agricultural Practice in Asia and Oceania, pp 98-110.
Hokazono, S., Hayashi, K., and Sato, M. 2009. Potentialities of organic and sustainable rice production in Japan from a life cycle perspective. Agronomy Research, 7(Special Issuse1). 257-262. Available from http://agronomy.emu.ee/ vol07Spec1/p7sI18.pdf
IPCC. 1996. Methane Emissions from Rice Cultivation:Flooded Rice Fields. Revised 1996. IPCC Guidelines for National Greenhouse Gas Inventories: Reference Manual. Available from http://www.ipcc-nggip.iges.or.jp/public/gl/guidelin/ ch4ref5.pdf.
IPCC. 2006. IPCC Guildelines 2006 for National Greenhouse Gas Inventories Volume 4 Agriculture, Forestry and Other Land Use. Available from http://www.ipcc- nggip.iges.or.jp/public/2006gl/vol4.html.
John, R.M., and Ross, H. 2008. Economic value of disability-adjusted life years lost to cancers. J Clin Oncol. 28.
Mark ,G.R., Heijungs, M., Huijbregts, An De Schryver, J. Struijs, and Yelm., A.R.V. 2008. A life cycle impact assessment method which comprises harmonised category indicators at the midpoint and the endpoint level: Ruimte en Milieu Ministerie van Valkshuisvesting, Ruimtelijke Ordening en Milieubeheer.
McMichael, A.J., Campbell-Lendrum, D.H., Corvalan, C.F., Ebi, K.L., Githeko, A., Scheraga, J.D., Woodward,A., 2003. Climate change and human health. Risk and responses. Word Health Organization. Geneva.322p.
OAE. 2019. Thailand Foreign Agricultural Trade Statistics 2019. Available from http://www.oae.go.th/assets/portals/1/files/jounal/2563/tradestat62.pdf.
ONEP. 2000. The Quantity of Greenhouse Gas Emission in Thailand in 2000: The Second Report of Office of Natural Resources and Environmental Policy and Planning (ONEP) In The Potential and Solution of Greenhouse Gas Emission of the Waste of Agricultural Sector. Available from http://www.environnet.in.th/2014/?p=5213.
Pathak B., T. I., Futaba Kazama, and Deb P Jaisi. 2006. Nitrogen contribution to the river basin from tropical paddy field in the central Thailand. Paper prepared for 9th International Riversymposium 2006, 4-7 September, Brisbane, Australia.
PCD. 2004. Project development and technical demonstration constructed wetland treatment system. Environmental Quality and Laboratory of Pollution Control Department (PCD). Available from http://infofile.pcd.go.th/ptech/constructed. pdf?CFID=3650741&CFTOKEN=25451525.
PCD. 2011. Water Pollution from Rice and Mangement Final Report (Pollution Control Department). Available from http://infofile.pcd.go.th/water/waterrice.pdf?CFID=818947&CFTOKEN=13460781.2015. Rice Industry of Thailand 2015-2016: Thailand Rice Production Potential and Trend (May 20, 2015). Office of Policy and Strategic Grain Rice. Rice Department (RD). Available from http://www.dft.go.th /LinkClick.aspx?fileticket=p6iLTgSSD_4%3D&tabid=401.
Rosalie van Zelm, Huijbregts Mark A. J., den Hollander , H. A., van Jaarsveld, H. A., Sauter, F. J., Struijs, J., . . . van de Meent, D. 2008. European characterization factors for human health damage of PM10 and ozone in life cycle impact assessment. Atmospheric Environment. 42: 441-453.
Sakaorat, K., Paengjuntuek, W., Saikhwan, P., and Phungrassami, H. 2009. Life cycle assessment of milled rice production: case study in Thailand. European Journal of Scientific Research. 30: 195-203.
Siriruk, P., Nakarin, C. and Sittichai, P. 2013. Estimating methane emissions from rice fields in Phayao province. Naresuan Phayao Journal. 6.
Thambhitaks, K., Kitchaicharoen, J., Sangchyoswat, C., and Jakrawatana, N. 2019. Economic Return of Crop Rotation and Reduction of Open-air Rice Straw Burning in Rice-based Cropping System in Upper Northern Thailand. Paper presented at the Proceeding on the 5th Environment Asia International Conference 13-15 June 2019 (section 2 pp.55-69). Chiang Mai, Thailand.
Tirado, R., Englande, A.J., Promakasikorn, L., and Novotny, V. 2008. Use of agrochemicals in Thailand and its consequences for the environment. Green Peace Research Laboratory Technical note. February.
UNEP. 2017. Global Guidance for Life Cycle Impact Assessment Indicators Volume 1. Available from https://www.lifecycleinitiative.org/applying-lca/lcia-cf/.
WHO. 2002. The world health report 2002 - reducing risks, promoting healthy life. Available from http://www.who.int/whr/2002/en/
WHO. 2013. Methods and data sources for global burden of disease estimates 2000- 2011. Department of Health Statistics and Information Systems WHO, Geneva Available from http://www.who.int/healthinfo/statistics/GlobalDALYmethods_2000_2011.pdf? ua=1.
Willigen, P. 2000. An Analysis of the Calculation of Leaching and Denitrification Losses as Practiced in the NUTMON Approach. Report 18. Wageningen, The Netherlands,Plant Research International, in Peter, L.J., Stoorvogel, J.J. & Smaling, A.E.M. (2004). Scaling soil nutrient balances. Enabling mesolevel applications for African realities: Food and Agriculture Organization of the United Nations, FAO.
William ,W.W, Jr., and Karl,E.H. 1995. Relating algal bloom frequencies to phosphorus concentrations in Lake Okeechobee. Lake and Reservoir Management. 11:77- 83.
Worldbank. 2018. Exchange-rate, Inflation and GDP per capita (current us$). Available from http://databank.worldbank.org/data/reports.aspx?source=world-development-indicators&preview=on#
OPEN access freely available online
Chiang Mai University Journal of Natural Sciences [ISSN 16851994]
Chiang Mai University, Thailand https://cmuj.cmu.ac.th
Kamthorn Thambhitaks 1,* and Jirawan Kitchaicharoen 2
1 Center for Agricultural Resource System Research, Faculty of Agriculture, Chiang Mai University, Chiang Mai 50200, Thailand
2 Department of Agricultural Economy and Development, Faculty of Agriculture, Chiang Mai University, Chiang Mai 50200, Thailand
Corresponding author: Kamthorn Thambhitaks, E-mail: thorn97@yahoo.com
Total Article Views
Editor: Korakot Nganvongpanit, Chiang Mai University, Thailand
Article history:
Received: December 8, 2020;
Revised: January 20, 2021;
Accepted: January 21, 2021;
Published online: March 12, 2021