 ISSN: 2822-0838 Online

The Application of Revenue Management in Chilled Storage Area Allocation: Simulation Study
Chompoonoot Kasemset*, Tattayana Pangsuta, and Chawis BoonmeePublished Date : 2021-04-01
DOI : https://doi.org/10.12982/CMUJNS.2021.029
Journal Issues : Number 2, April-June 2021
Abstract Resource planning in service industries is a difficult task and quite different from resource planning in manufacturing. Revenue management is one concept used in service industries when capacity and inventory are challenging to identify. In this study, the company case study provides chilled storage areas for customers. Different products are served and service charging is calculated based on the product’s weight and storing time. Currently, the target revenue cannot be achieved. This study presents the application of revenue management in chilled storage area allocation. From a previous study, there were four classes of products based on their importance level as A, B, C and D. Among all classes, the cost of under and overestimating demand was calculated for setting up the area allocation by following the concept of revenue management. Monte Carlo simulation was applied to simulate the existing and improved systems. The simulation results indicated that the average daily revenue could be improved when the storage area allocated to the lowest priority class (class D) was limited to be equal to the average daily demand of class D. Applying the proposed policy can help in increasing yearly revenue by approximately 73,638.75 Thai Baht. Finally, the implementation of the proposed procedure was discussed under the concept of Logistics 4.0.
Keywords: Revenue Management, Simulation, Warehousing
Funding: This research was supported by the Thailand Institute of Scientific and Technological Research. Also, researchers have received funding from the European Union’s Horizon 2020 research and innovation program under the Marie Skłodowska-Curie grant agreement No 734713.
Citation: Kasemset, C., Pangsuta, T., and Boonmee, C. 2021. The application of revenue management in chilled storage area allocation: simulation study. CMUJ. Nat. Sci. 20(2): e2021029.
INTRODUCTION
Warehousing is an activity in supply chain and product distribution. Some companies have their own warehouses, but some of them use logistics service providers (LSPs) to handle activities occurring in warehouses, including receiving, storing, picking and shipping. A chilled storage warehouse is a service provided by LSPs because owning this type of warehouse is costly due to controlling temperature, leading to high energy costs, so many manufacturers outsource this activity to third- party logistics providers (3PLs).
The company in the present case study provides chilled storage warehouses. Presently, this company cannot achieve its revenue target for this service due to inefficient procedures for allocating storage areas. Stored products are charged based on their weights and storage duration. Sometimes, most of the area is occupied for storing products that generate low revenue. Thus, when other high-revenue generating products arrive, there is no space to store them.
For service industries, like LSPs, demand forecasting is a difficult task due to demand uncertainty. Revenue management is a technique used to deal with uncertain demand, which is common in service industries. The concept of revenue management is to maximise profit mainly from time-sensitive products and services—usually in industries with inflexible and expensive capacity, perishable products and uncertainty demand (Russell and Taylor, 2011). Example applications of revenue management are overbooking (Phumchusri and Maneesophon, 2014; Saito et al., 2019), fare classes (Raza and Akgunduz, 2010), and single order quantities (D'Huart, 2010).
Saito et al. (2019) proposed the application of revenue management for online hotel booking systems that consider overbooking because of the increasing number of bookings through online booking websites and last-minute cancellations, which cause severe damage to the hotel management. This paper provided numerical examples of the optimal room charges and overbooking levels by using actual online booking data from a Japanese booking website for two major luxury hotels in the Shinjuku ward in Tokyo. In such a case, the proposed model can help to determine the overbooking level and the room charge efficiently. Moreover, many papers have applied revenue management to the airline industry. Raza and Akgunduz (2010) presented an airline revenue management strategy to jointly determine both seat allocation and fare price for a single leg flight in a duopoly market. Furthermore, this study also employed game-theoretic analysis and regression analysis. Most of the research usually employs the revenue management strategy in hotels (Aydin and Birbil, 2018), airlines (Kyparisis and Koulamas, 2018), restaurants (Guerriero et al., 2014), cruise ships (Maddah et al., 2010), railways (Bharill and Rangaraj, 2008), stadiums (Ogasawara, 2017), and theatres (Choi et al., 2015).
The pricing mechanism is a major researched area in revenue management (Cheraghi et al., 2010). Caldentey and Wein (2006) studied an electronic market with two selling channels. The firm in this study aimed to determine whether to accept or reject incoming orders in order to maximise revenue while reducing inventory, holding and backorder costs. This study found that segregating orders and accepting the high-priced ones by the proposed order acceptance policy could help the system achieve higher profits than the blind acceptance of incoming orders. Recently, dynamic pricing has become a significant trend in pricing mechanism because it allows optimal response to real-time demand and supply information. Several papers have applied this mechanism in revenue management. Gayon and Dallery (2007) proposed a comparison between a static pricing problem and a dynamic pricing problem in a make-to-stock queue with a partially uncontrolled production environment. The results indicated that dynamic pricing is much more beneficial than static pricing when the production is not controlled. Tian et al. (2018) presented a dynamic pricing model for a reservation-based parking system through the revenue management method. This study aimed to maximise the expected revenue of the parking manager. Numerical examples show that the proposed dynamic pricing model can provide significant increases in revenue and make full use of the parking resources during peak periods. Another article related to the dynamic pricing model is Selc̣uk and Avṣar (2019).
Some articles have focused on storage capacity allocation through revenue management. Harris and Pinder (1995) were the first to study storage capacity allocation in revenue management. They considered an assemble-to-order environment and proposed pricing strategies and stopped sales tactics to allocate the pre-existing capacity optimally. Maglaras and Meissner (2006) determined how to maximise profits over a time horizon by applying a pricing mechanism and capacity allocation. They proposed heuristics for pricing and capacity controls in a multi- product environment. Zou and Ding (2008) proposed a capacity allocation optimisation model for sea cargo based on revenue management. This objective’s function is aimed to maximise the revenue, in which the goal of revenue management is to sell the container capacity to the right customer at the right price at the right time. Another paper related to cargo by Armar (2009) developed a framework for the application of revenue management, specifically for capacity control, to space logistics for use in the optimisation of mission cargo allocation. Xian-hao et al. (2015) proposed a robust optimisation of capacity allocation policies in a third-party warehouse, which provides several different level storage services at different prices under uncertain market demand. The model focused on the revenue management perspective to maximise the revenue in the system. According to the literature review, no research was found that employs a revenue management strategy in chilled storage area allocation. Hence, we aim to apply revenue management in this study.
To evaluate the performance of implementation under random variables represented by probability distributions, Monte Carlo simulation is a technique that can resolve this problem. Several papers employ Monte Carlo simulation in many fields, including revenue management. Li et al. (2016) studied the capacity allocation game between duopolistic airlines, which could offer callable products; the revenue management technique and Monte Carlo simulation were applied in this study. Furthermore, Pimentel et al. (2018) developed a simulation model of a hotel reservation system for transient customers that has all of the elements of a real-world hotel revenue management system. Monte Carlo simulation was used to provide a point estimate of the expected net revenue across the planning horizon. Based on the advantage of this approach, the Monte Carlo simulation is employed in the present study for testing the proposed improvement.
Nowadays, industry is in the fourth industrial revolution period (Industry 4.0). Industry 4.0 implications in logistics, namely Logistics 4.0, were addressed by Barreto et al. (2017). Many companies have prepared themselves for this revolution and several technologies have been applied in many companies, including information technology (IT). Trab et al. (2015) proposed product allocation planning with compatibility constraints. They aimed to solve the problem of storing hazardous products and constraint-dependent products in warehouses via negotiation mechanisms based on Internet of Things (IoT) infrastructure and multi-agent systems. This proposed idea provides several advantages in warehouse management systems, such as the reduction of human error or products’ misplacements. Other related papers in applying IT were Tejesh and Neeraja (2018) and Mourtzis et al., (2019). Owing to the advantage of IT, we aim to propose such an idea in the present study.
Upon review of the existing research, there is a lack in research regarding the application of revenue management in chilled storage area allocation. Therefore, this research aims to propose the application of revenue management strategy in chilled storage area allocation. There are three contributions to this research. The first objective is to propose a policy for chilled storage area allocation using revenue management. Secondly, the Monte Carlo simulation is adopted to evaluate the proposed system in comparison with the existing system (no systematic method). Finally, the conceptual system design under the concept of Logistics 4.0 is proposed together with the proposed method.
MATERIALS AND METHODS
As this research is a case study, the methodology developed by Yin (2011) was applied in this study, which consists of plan, design, prepare, collect, analyses and share. The research methodology was addressed as follows.
Data collection
The company’s data were studied and collected; the data included product items, serviced quantities (unit: pallet), storage area, the revenue of service and chilled storage’s operating cost, in which those primary data were from observation and interviewing the company’s officers who take care of this service. Then, secondary data were collected from historical data of the company, such as product lists.
Product classification
The data clustering technique was applied, as presented in Pangsuta et al. (2018). The first step was to identify product classification criteria through interviews. Pairwise comparison from the AHP procedure was carried out to derive each criterion’s weight. Then, impact criteria could be identified and carried on to K-means clustering for grouping products. Finally, products were classified to multiple groups with different levels of importance.
Storage area allocation using revenue management
In order to calculate the storage area for each class of product, the general formula from Russel and Taylor (2014) for revenue management was applied as equation 1:
![]()
when
C0 = Cost of overestimating demand (when an assigned area is higher than demand, cost of opportunity loss) (Baht).
Cu = Cost of underestimating demand (when the assigned area is less than demand, loss profit) (Baht).
M = Demand (pallet).
X = Assigned area (pallet).
P(M<X) = Probability that coming demand is less than the fixed number of allocated areas.
After P(M<X) is estimated, this value is compared to the demand data to identify the optimal number of areas for each product class.
Monte Carlo simulation
The simulation study was conducted using the following steps.
Data fitting. Input data were analyzed in the form of a probability distribution.
Random number mapping. Random numbers were mapped to each random variable used in the model.
Simulation performing. The first simulation was for the existing system; the procedure was as follows:
1) Parameter setting: Parameters including run length (days) and warm-up period (days) were set.
2) Random numbers (RNs) were generated and compared with RN mapping based on the probability distribution for creating each random variable.
3) Daily revenue was calculated as the performance measurement of the system.
Verification and validation. The results of the existing system were verified and validated to confirm the rightness of the model by comparing it with the real data from the company.
Experiment for improvement. The area allocation based on revenue management was simulated. The results comparison was carried out to present the improvement in comparison with the existing system.
RESULTS
Firstly, the general data were studied. The company in the present case study provides a chilled storage warehouse for agricultural products such as vegetables, fruits, flowers, juice, etc., in which 280 pallets can be stocked in this chilled storage warehouse (the size of a pallet is 120 × 115 × 80cm.). Currently, the company calculates the service charge based on weights and storage duration without considering appearance and volume of products in which the service charge for the first week of storage is 1 Baht per kilogram and the service charge for the next week until the last week of storage is reduced to 0.5 Baht per kilogram. Sometimes, most of the area is occupied for storing products that generate low revenue. Thus, when other high-revenue generating products arrive, there is no space to store them. Owing to this issue, the company cannot reach its revenue target. The present revenue of this company is approximately 220,000 - 260,000 Baht per month.
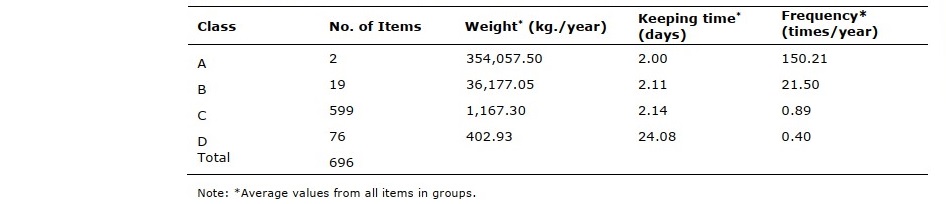
Pangsuta et al. (2018) proposed to consider three criteria—product’s weight, keeping time and frequency -- to classify products for cold storage service. Based on the company case study, four classes were determined, as presented in Table 1. For more details, see Pangsuta et al. (2018).
From Table 1, class A is the most crucial group because average keeping weight is the highest, which means high revenue generation when the turnover rate is short as well. Class D is the least significant group because of less revenue generation due to the long keeping time, which occupies storage area and leads to lost opportunities for storing high revenue products.
Table 1. Product classes of the company case study.
The proposed area allocation policy
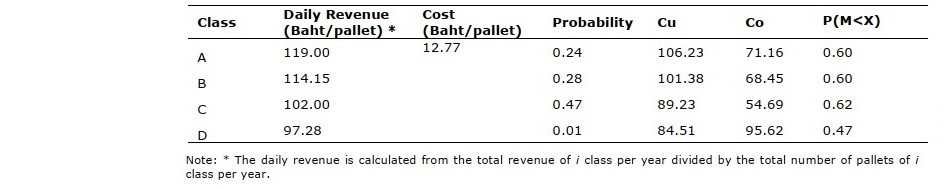
Based on revenue management, Co and Cu should be estimated. Co and Cu of each class are presented in Table 2 based on sampling as 190 days from 365 working days (Yamane, 1973). Then, P(M>X) of each class was compared with the data of the product to define the optimal number of pallets for each class. An example of class A is presented in Table 3.
Table 2. Co and Cu Estimation.
From Table 3, 12 pallets were dedicated to class A based on revenue management. Whereas products in class A are generally kept for two days on average, the number of pallets should be adjusted to 24 pallets (Two days x 12 pallets). The total number of pallets allocated for all classes was 163 pallets when the capacity of the chilled storage area is 280 pallets. Finally, the adjusted number was derived by the same percentage. For example, the total number of pallets from the first approximation was 163 when class A was 24/163 or 14.72%. For implementation, 14.72% of 280 pallets (42 pallets) should be allocated to class A.
Table 3. Pallet allocation for class A.
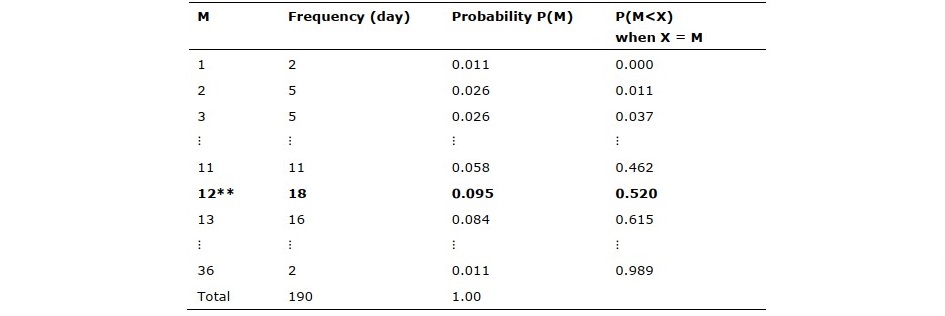
Table 4. Pallet allocation.

Monte Carlo simulation
Existing system. The simulation model for the existing service was developed, as presented in Figure 1. From Figure 1, the number of items was generated daily among 34 – 91 items (per the example data in Table 5). For example, when the RN is 0.03, the number of items on that day should be 35 items. Then, each item was assigned to each class of product based on product probability as RN mapping, as presented in Table 6. The number of pallets that should be stored was assigned based on the probability and RN mapping as an example of class A in Table 7. For each item, the number of stored pallets was compared with the current capacity of the storage area (maximum as 280 pallets). If the capacity is available, profit from service can be calculated, but opportunity loss is calculated when the capacity is full and the item should then be rejected.
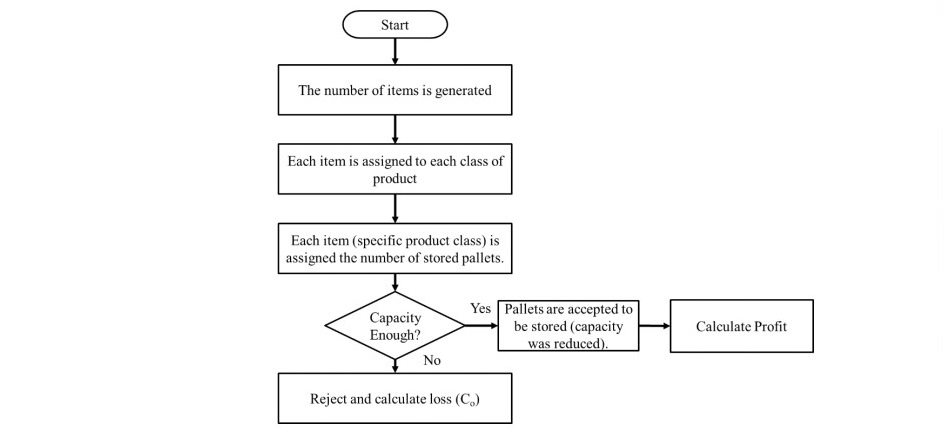
Figure 1. Flow chart of the existing service.
Table 5. The number of items and RN mapping based on probability distribution.

Table 6. Product class and RN mapping based on probability distribution.

Table 7. The number of stored pallets for class A and RN mapping based on probability distribution.

Then, the simulation was run for 60 days with warm-up periods of 10 days (the number of samples for 365 working days) and daily revenue was determined as presented in Figure 2. The daily average revenue from the simulation model was 7,440 – 8,139 Baht (95% mean confidence interval (CI)). These results were compared with the real data of the company as daily revenue at 95% CI as 7,333.33 – 8,666.67 Baht per day. The results from the simulation and the company data were not significantly different. Hence, the results from the comparison can confirm that the simulation model was valid to represent the existing system.

Figure 2. 95% mean confidence interval of daily revenue.
Improved system. The simulation model for the existing service was modified to implement area allocation for each product class. As presented in Table 4, 42, 73, 124 and 41 pallets were assigned for class A, B, C and D, respectively. The operations flow of the system was changed, as presented in Figure 3. From the proposed policy, as shown in Figure 3, after each item was assigned the number of stored pallets, each item was separated into each product class (A, B, C, or D). Then, the number of stored pallets was compared with the current capacity of the storage area in each product class (the maximum of each product class is presented in Table 2). If the capacity was available, profit from service could be calculated, but opportunity loss was calculated when the capacity was full and the item should be rejected.
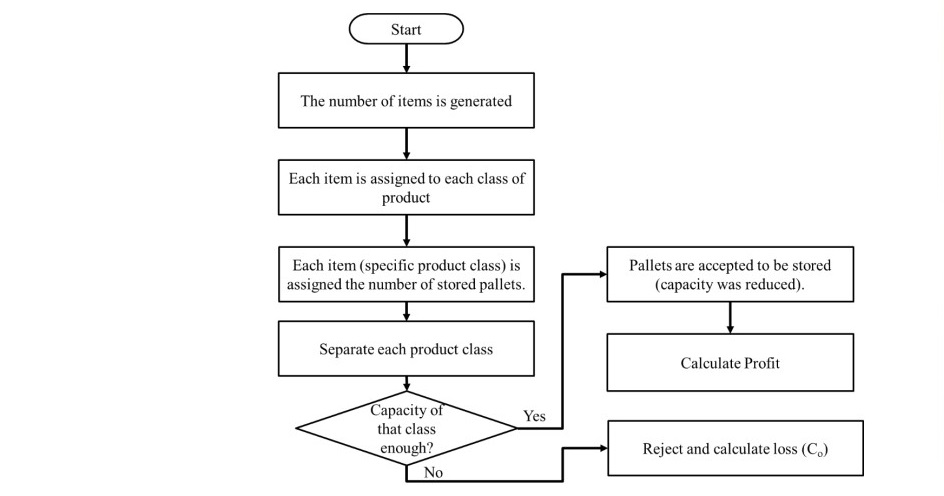
Figure 3. Flow chart of the proposed policy.
Result Comparison. Simulation results of both systems were compared using paired T-test mean comparison, as in Figure 4.
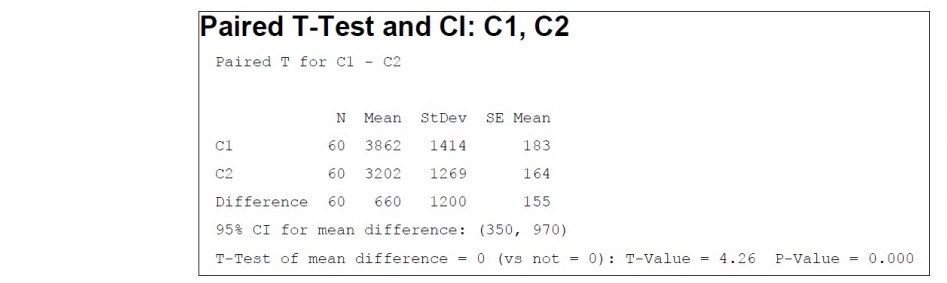
Figure 4. Paired T-test results.
µD is the difference in profit mean of the two situations when the same random numbers are used in the simulation (C1 for the existing system and C2 for the revenue management system).
Hypothesis Testing:
H0: µD = 0
H1: µD ≠ 0
The results in Figure 4 showed that the average profit of the existing system was 3,862 Baht while the average profit of the revenue management system was 3,202 Baht. According to the results for the paired T-test, the average profit comparison between the existing and improved systems was significantly different because P value was 0.00 (using α = 0.05), so H0 was rejected. Also, the 95% CI of profit means produced positive values, so it can be concluded that C1 is greater than C2. For this test, the area allocation cannot help in increasing the revenue of this service.
The simulation results presented that the area allocation based on revenue management cannot increase the profit of this service. Then, the results of the proposed system were investigated in detail. The number of rejected products was studied and we found that class A products were rejected because the allocated number of pallets was not sufficient. However, the pallets allocated to D were idle during the simulation run. According to Caldentey and Wein (2006), the acceptance of high-priced products by the order acceptance policy can help the system achieve higher profits than the acceptance of low-priced products and the random acceptance of incoming orders. Hence, the second improvement was proposed.
The second improvement was set to reduce the number of pallets allocated for class D to 25 pallets as its average daily demand and the reduced pallets were added to class A. Finally, the area allocation for the second improvement was determined as presented in Table 8.
Table 8. Pallet allocation.

Then, the simulation test was run for the second improvement. The results of the mean profit comparison between the existing and second improvement are presented in Figure 5 (C4 for the existing system and C5 for the revenue management system).
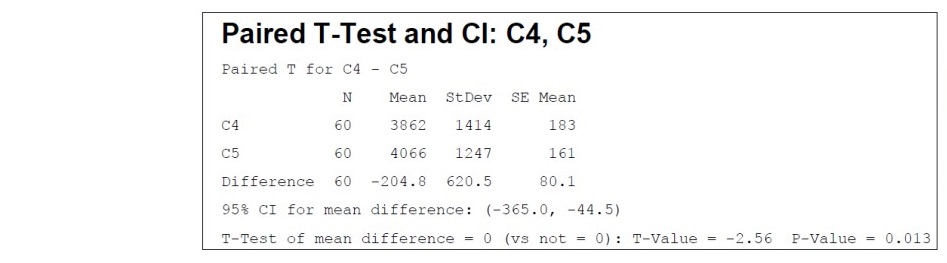
Figure 5. Paired T-test results.
Hypothesis Testing:
H0: µD = 0
H1: µD ≠ 0
The results in Figure 5 showed that the average profit of the revenue management system for the second improvement was increased to 4,066 Baht. The results for the paired T-test showed that the average profit comparison between the existing and second improvement was significantly different because P value was 0.013 (using α = 0.05), so H0 was rejected. In addition, the 95% CI of mean profit difference had negative values, thus, it can be concluded that C5 was greater than C4. For this study, the area allocation can help in increasing the revenue of this service.
DISCUSSIONS
Owing to the results in the above section, we found that the application of revenue management theory in this case study is limited, in which the first improvement cannot increase the profit of the service. However, when the results of the first improvement were investigated in detail and the second improvement system was proposed based on the reallocation of the number of pallets for class A and D, the second improvement can increase the profit of the service. Therefore, it means that not only a theoretical perspective, but also a practical perspective, should be focused simultaneously.
Nowadays, we are in the fourth industrial revolution (Industry 4.0). Warehouse management system (WMS) is a technological application for companies to handle the increasing complexity of planning and control practices in warehouses. In practice, the proposed method from this study cannot be implemented effectively without introducing information technology (IT) solutions for WMS to the case study company. Whereas the initial step of smart warehousing is to prepare the current warehousing to be systematic and optimised (Kasemset and Petchalalai, 2018), the proposed method can be adopted after completing an evaluation using the simulation procedure. The recommendation to the company is to implement WMS starting from
(i) developing a database for all products, (ii) collecting related data and providing real-time visibility into inventory levels and area usage, and (iii) developing a user interface to allow users to make the decision on receiving and outgoing products based on the proposed method. The conceptual system design of WMS based on the proposed model is presented in Figure 6.
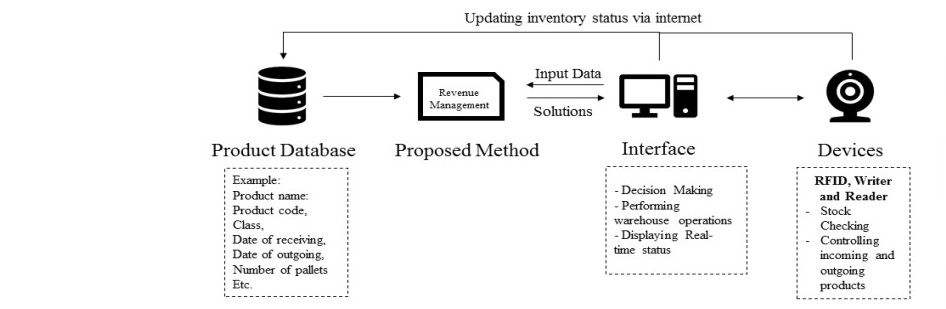
Figure 6. WMS conceptual model for the case study company.
Figure 6 presents the conceptual model of WMS. To start from the product database, information related to products (e.g., product code, product name, class) is stored here. This database is updated when users perform operations such as receiving, outgoing and checking stocks through the user interface and devices. RFID is recommended for storing information of the received products and RFID tags must be attached to the pallets of products before storing in the storage area. RFID is useful for stock checking and updating the product database using wireless and internet systems. Users are allowed to carry out the operations using the user interface and can perceive the real-time inventory status, as well.
CONCLUSIONS
This research aims to propose the application of revenue management in chilled storage area allocation. In this study, the company case study provides a chilled storage area for customers. Different products are served and service charges are calculated based on the product’s weight and storing time. From Pangsuta et al. (2018), four classes of products were classified based on their importance level, represented as A, B, C and D. According to Pangsuta et al.’s (2018) classification, cost of under (Cu) and over (Co) estimating demand was calculated for setting up the area allocation following the concept of revenue management. Then, the Monte Carlo simulation was applied to simulate the existing and improved systems. The simulation results found that the first improvement cannot increase the revenue of the company case study, in which the profit of the first improvement was reduced to 3,202 Baht per day. Since the first improvement cannot increase the profit of the service, this was investigated in detail. The results showed that class A products were rejected because the allocated number of pallets was not sufficient. However, the pallets allocated to class D were idle during the simulation run. Therefore, the second improvement was set to reduce the number of pallets allocated for class D and the reduced pallets for class D were added to class A. The simulation results of the second improvement found that this procedure can help in increasing yearly revenue by approximately 73,638.75 Baht.
The weakness of this research is the data collection since the company collected few historical data, which affects the calculation of probability and cost of under (Cu) and over (Co) estimating demand and the simulation analysis. Hence, the company should collect more data so as to enhance the service in the future.
In addition, to implement the proposed method efficiently, the conceptual system design of WMS was presented. With WMS, when data of products are complete and accurate, the future plan can be more precise under the changing environment of supply chains.
ACKNOWLEDGEMENTS
This research was supported by the Thailand Institute of Scientific and Technological Research.
REFERENCES
Armar, N., and de Weck, O. 2009. Cargo revenue management for space logistics. Proceeding of AIAA SPACE 2009 Conference & Exposition; 2009 Sep 14 – 17. Pasadena, California. p. 6723.
Aydin, N., and Birbil, S. I. 2018. Decomposition methods for dynamic room allocation in hotel revenue management. European Journal of Operational Research. 271: 179-192.
Barreto, L., Amaral, A., and Pereira, T. 2017. Industry 4.0 implications in logistics: and overview. Procedia Manufacturing. 13: 1245-1252.
Bharill, R., and Rangaraj, N. 2008. Revenue management in railway operations: A study of the Rajdhani Express, Indian Railways. Transportation Research Part A: Policy and Practice. 42: 1195-1207.
Caldentey, R., and Wein, L. M. 2006. Revenue management of a make-to-stock queue. Operations Research. 54: 859-875.
Cheraghi, S. H., Dadashzadeh, M., and Venkitachalam, P. 2010. Revenue management in manufacturing: a research landscape. Journal of Business & Economics Research. 8: 63-72.
Choi, C., Jeong, M., and Mattila, A. S. 2015. Revenue management in the context of movie theaters: Is it fair?. Journal of Revenue and Pricing Management. 14: 72-83.
D'Huart, O.O.E.M. 2010. A competitive approach to airline revenue management. [dissertation]. Cambridge, United States: Massachusetts Institute of Technology.
Gayon, J. P., and Dallery, Y. 2007. Dynamic vs static pricing in a make-to-stock queue with partially controlled production. Or Spectrum. 29: 193-205.
Guerriero, F., Miglionico, G., and Olivito, F. 2014. Strategic and operational decisions in restaurant revenue management. European Journal of Operational Research. 237: 1119-1132.
Harris, F.H.D., and Pinder, J.P. 1995. A revenue management approach to demand management and order booking in assemble-to-order manufacturing. Journal of Operations Management. 13: 299-309.
Kasemset, C. and Petchalalai, A. 2018. Application of Mathematical Model for Raw Material Storage Management. In Proceeding of the 2018 IEEE International Conference on Industrial Engineering and Engineering Management (IEEM); 2018 Dec 16-19; Bangkok, Thailand. p. 879-883.
Kyparisis, G.J., and Koulamas, C. 2018. Optimal pricing and seat allocation for a two- cabin airline revenue management problem. International Journal of Production Economics. 201: 18-25.
Li, T., Xie, J., Lu, S., and Tang, J. 2016. Duopoly game of callable products in airline revenue management. European Journal of Operational Research. 254: 925- 934.
Maddah, B., Moussawi-Haidar, L., El-Taha, M., and Rida, H. 2010. Dynamic cruise ship revenue management. European Journal of Operational Research. 207: 445- 455.
Maglaras, C., and Meissner, J. 2006. Dynamic pricing strategies for multiproduct revenue management problems. Manufacturing & Service Operations Management. 8: 136-148.
Mourtzis, D., Samothrakis, V., Zogopoulos, V., and Vlachou, E. 2019. Warehouse Design and Operation using Augmented Reality technology: A Papermaking Industry Case Study. Procedia CIRP. 79: 574-579.
Ogasawara, Y. 2017. A dynamic model with resources placed on single line in revenue management. Journal of the Operations Research Society of Japan. 60: 91- 100.
Pangsuta, T., Kasemset, C., and Thammasat, E. 2018. Product classification for cold storage warehouse: A case study. In Proceedings of the 21st AFBE International Conference 2018; 2018 Jan 15 – 16; Phuket, Thailand. p. 437 – 447.
Phumchusri, N., and Maneesophon, P. 2014. Optimal overbooking decision for hotel rooms revenue management. Journal of Hospitality and Tourism Technology. 5: 261-277.
Pimentel, V., Aizezikali, A., and Baker, T. 2018. An evaluation of the bid price and nested network revenue management allocation methods. Computers & Industrial Engineering. 115: 100-108.
Raza, S. A., and Akgunduz, A. 2010. The impact of fare pricing cooperation in airline revenue management. International Journal of Operational Research. 7: 277- 296.
Russell, R.S., and Taylor-Iii, B.W. 2011. Operations management along the supply chain [7th ed.]. Asia: John Wiley & Sons, Singapore.
Saito, T., Takahashi, A., Koide, N., and Ichifuji, Y. 2019. Application of online booking data to hotel revenue management. International Journal of Information Management. 46: 37-53.
Selc̣uk, A.M., and Avṣar, Z. M. 2019. Dynamic pricing in airline revenue management. Journal of Mathematical Analysis and Applications. 478: 1191-1217.
Tejesh, B.S.S., and Neeraja, S. 2018. Warehouse inventory management system using IoT and open source framework. Alexandria Engineering Journal. 57: 3817-3823.
Tian, Q., Yang, L., Wang, C., and Huang, H.J. 2018. Dynamic pricing for reservation- based parking system: A revenue management method. Transport Policy. 71: 36-44.
Trab, S., Bajic, E., Zouinkhi, A., Abdelkrim, M.N., Chekir, H., and Ltaief, R.H. 2015. Product allocation planning with safety compatibility constraints in IoT-based warehouse. Procedia Computer Science. 73: 290-297.
Xian-hao, X., Wei-hong, D., and Hongxia, P. 2015. A robust optimization of capacity allocation policies in the third-party warehouse. Mathematical Problems in Engineering.
Yamane, T. 1973. Statistics: An introductory analysis [2nd ed.]. Harper & Row, New York.
Yin, R.K. 2011. Applications of case study research. Sage. SAGE Publications, California.
Zou, H., and Ding, J. 2008. Analysis of capacity allocation for sea cargo based on revenue management. Proceeding of 2008 IEEE International Conference on Service Operations and Logistics, and Informatics; 2008 Oct 12-15. Beijing, China. p.1399-1402.
OPEN access freely available online
Chiang Mai University Journal of Natural Sciences [ISSN 16851994]
Chiang Mai University, Thailand https://cmuj.cmu.ac.th
Chompoonoot Kasemset*, Tattayana Pangsuta, and Chawis Boonmee
Department of Industrial Engineering, Faculty of Engineering, Chiang Mai University, Chiang Mai 50100, Thailand
Corresponding author: Chompoonoot Kasemset, E-mail:chompoonoot.kasemset@cmu.ac.th
Total Article Views
Editor: Wasu Pathom-aree,
Chiang Mai University, Thailand
Article history:
Received: February 6, 2020;
Revised: May 12, 2020;
Accepted: May 27, 2020