 ISSN: 2822-0838 Online

Optimizing Lot-Sizes and Scheduling in Terms of Mass Customization
Modrak Vladimir*, Soltysova Zuzana and Semanco PavolPublished Date : 2021-04-01
DOI : https://doi.org/10.12982/CMUJNS.2021.026
Journal Issues : Number 2, April-June 2021
Abstract The goal of mass customisation is to offer products tailored to the specific needs of the customers. Even though customers are aware that manufacturers need a certain time to produce and deliver customised products, the companies might guarantee that their products will arrive on time. Then, the objective of manufacturing managers is to minimise the total flow time of parts through the shop. One of the effective ways to reach this objective is to optimise schedules in order to satisfy the due date criterion, which plays a crucial role in the mass customisation environment. This paper, in the first part, outlines methodological tools to tackle the problem of shortening delivery times through scheduling and management of resources. In the second part of the paper, the proposed methodology framework through the theoretical example is applied.
Keywords: Batch size, Due date, Mass customisation, Scheduling software
Funding: This publication presents the partial results of the project that received funding from the European Union’s Horizon 2020 research and innovation program under the Marie Skłodowska-Curie grant agreement Number 734713. Moreover, the authors wish to acknowledge the contribution of the Scientific Grant Agency of the Slovak Republic -VEGA under the grant No. 1/0419/16.
Citation: Vladimir, M., Zuzana, S., and Pavol, S. 2021. Optimizing lot-sizes and scheduling in terms of mass customization. CMUJ. Nat. Sci. 20(2): e2021026
INTRODUCTION
Mass customisation (MC) includes several specific attributes, such as the ability to provide individually designed products. However, this marketing and manufacturing strategy brings some drawbacks for both customers and organisations. Changes in the mix of products usually lead to changes in loading among the different machines as they produce different volumes of jobs in a certain period of time (Chatzopoulos et al., 2011). Consequently, manufacturing lead times are substantially longer in comparison to the manufacturing of standardised products. According to Chandra and Kamrani (2004), customers are likely to be more willing to wait for customised products if delivery times are predictable and consistent. In this context, one of the challenges of MC is to focus on the development methods and tools to minimise delivery time and lead-time. In MC, the delivery time can be effectively minimised in several ways, e.g., by increasing the commonality between products, implementing group technology, and other approaches (Lau and Elaine, 2008). One of the effective ways to reach this objective is to optimise schedules in order to satisfy the due date criterion, which plays a crucial role in the mass customisation environment. For this purpose, methods of operations research are commonly employed. Even though manufacturing lead-time includes a more or less exact structure of time items, operations research focuses on substantial ones, such as flow times or/and make- span. Therefore, in our approach, only operational times will be assumed as critical ones. An actual task in scheduling approaches lies in reflecting new requirements on production optimisation. Numerous existing optimisation methods which were developed during previous decades followed requirements either for mass production or tailored production. However, mass customisation presents a paradox by combining customisation and mass production, and this new phenomenon opens a new field in operations research. This paper aims to propose a method that may contribute to the scheduling policies in terms of mass customised manufacturing. Its novelty consists of the generating optimised scheduling diagrams based on specification of an optimal pair of scheduling characteristics, which are represented by transport batch sizes and number of transport batches. The optimal scheduling parameters are obtained through the new approach by using specialised software.
This paper is divided into two main parts. The first part describes the methodological procedure for developing a production planning schedule in terms of mass customisation. The second part proposes methodology framework through the theoretical. Finally, the discussion and conclusion bring some relevant considerations.
MATERIALS AND METHODS
Related Works
Firstly, it could be useful to mention the existing literature reviews in the wider topic and scheduling problems of discrete processes, which offers a whole picture of the current literature. Chen et al. (2004) presented a comprehensive literature review on process planning and production scheduling in terms of mass customisation. The authors emphasise that: ‘traditionally, process planning and production scheduling are considered as two isolated tasks and conducted by separate departments in manufacturing enterprises. Such isolation has become a major factor that limits the full utilization of manufacturing resources and adversely impacts overall performance.’ Yao and Liu (2009) set up a dynamic and multi-objective optimisation mathematical model to solve optimisation and scheduling problems in mass customisation. Dou et al. (2016) developed an approach to customer-oriented product collaborative customisation in order to improve the design process. A novel optimisation for rescheduling workpieces was given by Gujjula and Günther (2009) and Valero-Herrero et al. (2014) proposed an innovative method on the resequencing problem by using several rules for placing and releasing workpieces. Gaia et al. (2002) studied the problem of assigning operations to an ordered sequence of non-identical workstations; in their method, precedence relationships and cycle time restrictions were taken into consideration. The solution to the problem was based on a dynamic programming algorithm. Tabue and Minner (2018) defined the two-index vehicle flow formal description for the vehicle routing problem, whereas a multi-objective mixed-model assembly line sequencing problem related to routing problems was presented by Rahimi-Vahed et al. (2007). Related operational complexity issues of assembly processes were studied by literature, see for example, Modrak and Marton (2014) and Modrak and Soltysova (2017). Kim et al. (2000) developed a genetic algorithm in order to minimise the number of stations in a two-sided assembly line balancing problem., Castillo and Gazmuri (2015) viewed that the heuristics used in the batch scheduling problems are dispatching rules and built a batch sequence schedule, while Modrak and Pandian (2010) suggested an alternative heuristic algorithm for the flow shop scheduling problem to minimise completion time for the n-jobs m-machines problem, which can be effectively used in terms of a mass customisation environment. Later, the performance of the algorithm was successfully benchmarked with competitive constructive heuristics on actual theoretical flow shop problems (Semanco and Modrak, 2012). There are many scheduling software solutions for manufacturing optimisation, such as Fishbowl Manufacturing, NetSuite, JobBOSS, etc., but most of them are paid and focused on traditional production optimisation problems. Some of them need to be used only by educated workers or users with training. Due to this reason, we provide online available software, which is free and everyone can use it without need for training.
Proposed Methodology
The effective production of a high variety of products assumes using optimised scheduling methods with the purpose of reducing all waste time and minimising manufacturing lead-time. Scheduling in the mass-customised manufacturing is a typical multi-objective dynamic optimisation problem, which is constrained, especially, by stochastic demand, available production sources, and due dates. With the aim to contribute to solving such problems, we construct a novel dynamic scheduling model by considering the key features of the MC, namely, distinctive characteristics of customisation orders.
The first step of the proposed method is grouping individual orders (jobs) into the short time periods, e.g., daily quantities.
Subsequently, for each group of daily orders, we create m x n matrices with m machines and n jobs. Then, specific jobs of the given days might be divided into transport batch sizes (QT) and the number of transport batches (L). In the beginning, it is reasonable to set up minimal and maximal QT for each group of daily orders. Even though minimal makespan will be reached by using minimal QT =1, it does not mean that such solution will satisfy defined criterion DD optimally. Therefore, trade- off between QT =1 and QT =QP in order to find sufficiently small lot- sizes is considered here as a proper way to solve the problem.
Due dates can be unified for each individual cumulative orders of the given days or can differ from each other. We will prefer to identify unified ones. In this case, DDs can be defined as the mean of minimal Cmax values (Cmaxmean) that can be obtained by setting transport batch sizes according to OPF. Then, the mean value is rounded to the nearest higher integer, and DD ≥ rounded Cmaxmean.
After DD is determined, QT and L might be specified for each job of daily order. For this purpose, we need to find identical numbers of transport batches L for all jobs by using the formula:
![]()
where Qpi – production batch size of the i-th job.
To demonstrate the procedure of finding optimal QT, the following example is used.
Let us say, that ordered quantities for jobs Qp1 = 107, Qp2 = 43 and Qp3 = 17. Firstly, the ordered quantity of Qp1 will be divided into two sub-jobs, e.g., Qp1A = 100 and Qp1B = 7, Qp2 into Qp2A = 40 and Qp2B = 3, and Qp3 into Qp3A = 10 and Qp3B = 7.
Subsequently, it is possible to identify all alternative transport batch sizes by dividing all production batches of the given day by common divisors. Quantities of Qp1A, Qp2A and Qp3A are divisible by common divisors 1, 2, 5 and 10. Once the uniform numbers of transport batches L are known (L= 1, 2, 5 and 10), possible optimal transport batch sizes for Qp1A, Qp2A and Qp3A can be determined.
In the next step, Cmax for each of four FSPs with the uniform number of transport batches is calculated by common heuristics, see, e.g., Modrak and Pandian (2010). Subsequently, the best
Then, the objective function for the given flow shop scheduling problem can be formally expressed as minimisation of the so-called Remaining Slack (RS) value, i.e.:
RS → min, while RS ∈ 〈0,∞), (2)
where
RS= DD - Cmax (3).
This objective function will be used to identify optimal transport batch sizes. The procedure will be further described in detail through the theoretical case study, where, after optimisation of transport batch size for groups of daily orders, the optimal production-planning schedule will be defined and its graphical model shown.
he proposed methodology for the production planning uses specialised software (see link in the reference list), which generates graphical and numerical outputs according to defined input data. In the next section, the description of developed software will be explained due to its more straightforward and faster application.
Characteristics of the Developed Software
The software applied in this research is available online as a helpful tool for generating outputs in the form of tables and graphs based on the input data (Online computing software, see link in the reference list). Input data includes:
- matric m x n containing processing times in seconds for each job (Figure 1a),
- number of processing operations for each job within one transport batch size (Figure 1b),
- number of transport batches for each job, (Figure 1c),
- selected jobs sequence numbered by order (Figure 1d).
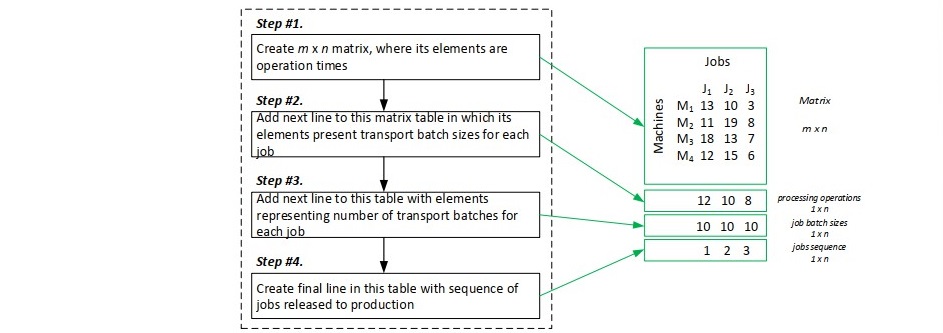
Figure 1. The table format for insertion of input data.
Its application in the first step needs to copy input data in the form of Microsoft Office Excel Table and paste them in the input data window. A flowchart of how to generate outputs is shown in Figure 2.
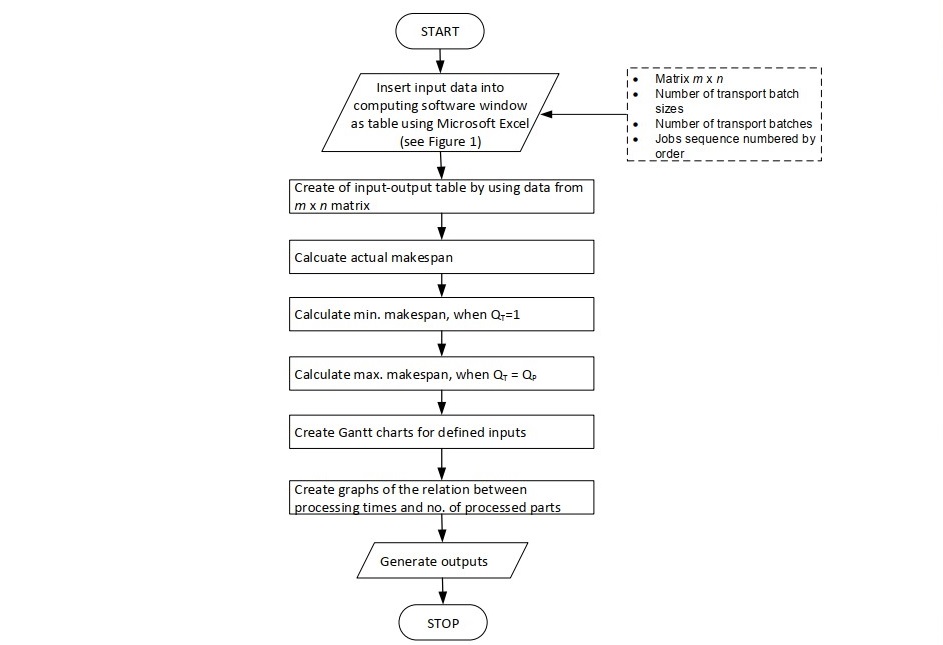
Figure 2. Software flowcharts with acquired input data.
Subsequently, it is possible to generate results in the form of the following outputs:
- Information table with summarised input data to check the completeness of input data,
- Automatically generated optimal sequence of the jobs in order to minimise the makespan.
- Maximum and minimum makespan values,
- In-Out Table for the optimal sequence of the jobs,
- The Gantt chart of the generated schedule for the makespan minimisation
- Graphs for each job showing the relation between the number of process parts (products) and processing time in seconds.
In the subsequent section, its functionalities are presented through the hypothetical case study.
RESULTS
Theoretical Case Study
Here, the theoretical case study demonstrates the application of the proposed scheduling method by using specialised software.
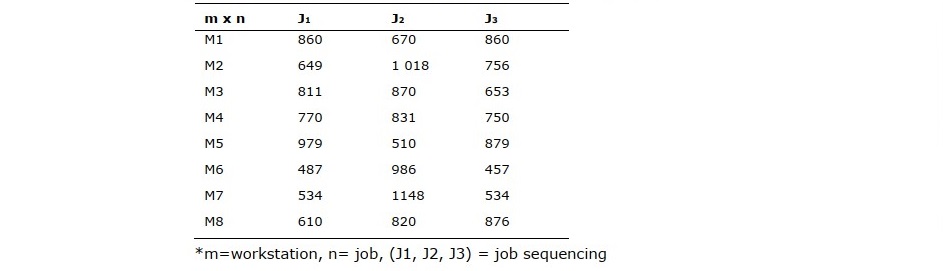
Let us have the manufacturing system containing eight machines or workstations (M), where three jobs marked as J1, J2, and J3 are produced. We will consider the job sequence J3 - J2 - J1 according to the Cmax criterion. Table 1, in which m x n problem is adapted from (Zhang et al., 2009), shows the processing times of each job (n) on each workstation (m) in seconds.
Table 1. Processing times for the case study in seconds.
Gathered orders are, as the first step, summarised and categorised into groups of daily orders with quantities as follows. For Day #1, Day #4, and Day #5 are job quantities Qp1 = 125, Qp2 = 73, and Qp3 = 47, for Day #2 are job quantities Qp1 = 83, Qp2 = 45, and Qp3 = 29, and for Day #3 are job quantities Qp1 = 169, Qp2 = 87, and Qp3 = 45.
As can be seen from these quantities, the number of ordered daily quantities needs to be modified because the quantities are not in the form of rounding to the nearest 10, as described in the third section of this paper. Firstly, in the case of Day #1, the ordered quantities will be divided as follows, Qp1 into Qp1A = 120, and Qp1B = 5, where QT1B =5, and L1B = 1; Qp2 is divided into Qp2A = 70, and Qp2B = 3, where QT2B=3, and L2B= 1; quantity of Qp3 is separated into Qp3A = 40 a Qp3B = 7, where QT3B =7, and L3B= 1. Analogically, this procedure is applied for the rest of the daily orders, and the modified quantities are shown in Table 2.
Table 2. Modified quantities of daily orders.

Determination of due dates
For the determination of DD for the given five daily orders, as the first step, the data from Tables 1 and 2 will be used to calculate the minimum and maximum Cmax for individual daily orders. Maximum Cmax values are useful only for comparison of their upper bounds against lower bounds. For this purpose, developed software will be used. Input data for a software application in case of calculation of Cmax and generation of the Gantt chart for the same groups of orders of Day #1, Day #4 and Day #5 have to be structured as shown in Figure 3.
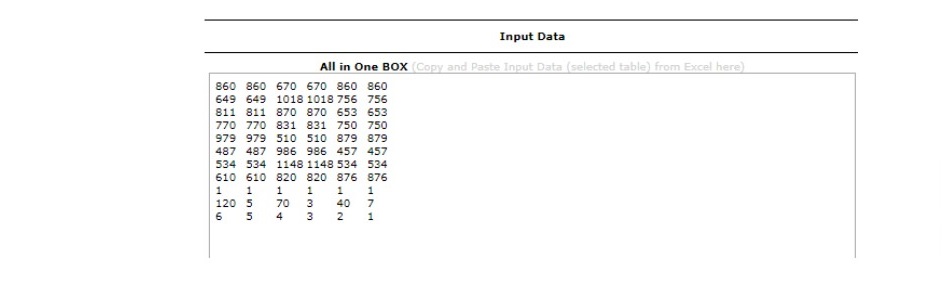
Figure 3. An example of the arrangement of input data for the software (created by Print Screen).
The software outputs for the groups of orders of Day #2, and Day #3 are obtained in the same way. Further, it is assumed that production takes place in three shifts, for 24 hours. Output values of minimum and maximum Cmax for each day are summarised. Minimum Cmax = 2.47 days and maximum Cmax = 9 days for the order of Day #1, Day #4 and Day #5. Minimum Cmax = 1.63 days and maximum Cmax = 5.95 days for the order of Day #2. Minimum Cmax = 3.06 days and maximum Cmax = 11.77 days for the order of Day #3.
In order to estimate DD, the average value of minimal makespans is rounded to a higher integer and then, DD ≥3.
Determination of transport batch size for individual jobs
In this step, optimal QT for specific jobs will be identified. The procedure for the selection of optimal QT is explained in a few steps for days with the same number of orders, i.e., Day #1, Day #4, and Day #5, as was described in the third section.
In the following step, all possible number of transport batches for Qp1A, Qp2A, and Qp3A, can be identified as values 1, 2, 5 and 10.
Subsequently, minimum Cmax values for all alternatives are calculated through the software.
Table 3. All possible Li and QTi for Day #1, Day #4 and Day #5.
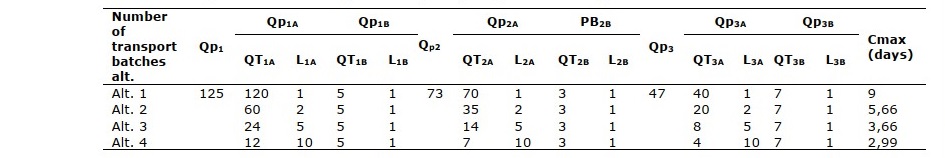
Finally, the results of RS values using equation (3) are enumerated for all alternatives. RS = - 6 days for Alternative 1, RS = -2.66 days for Alternative 2, RS = -0.66 days for Alternative 3, and RS = 0.01 days for Alternative 4. According to these results, the optimal unified QT4 is identified as Alternative 4. Its value equals 2.99 days (Table 3), which satisfied predetermined DD according to objective function determined in expression (2).
The optimal QTi can be generated for the remaining daily orders in the same way. Summarised results with optimal QTi, where optimal Li for Day #2 equals to 10, and for Day #3 equals to 40, are shown in Table 4.
Table 4. Optimal QTi for five daily orders.

As can be seen from Table 8, the final makespan for groups of orders of Day #3 is over DD. Then, we have two possibilities, to leave the scheduled as it is, with given tardiness, or to split the daily order into two sub-orders, which would be processed in parallel. The next subsection will describe the first possibility.
Production planning and capacity modelling
Finally, it is possible to generate Gantt charts using the software that present common graphical interpretation for production scheduling and capacity modelling. The multi Gantt chart for the orders of Days #1 - #5 is depicted in Figure 4.
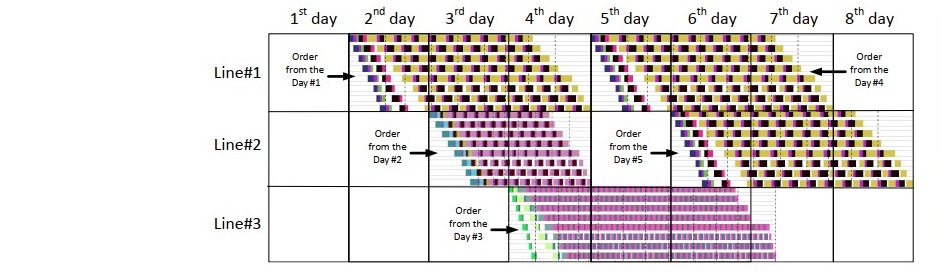
Figure 4. The multi Gantt chart for selected daily orders.
In a given case, three lines are assumed, and the schedule is continuously set up into the whole days. Production requirements from Day #1 can be started to produce on the production Line #1, by starting on the second day and finishing on the fourth day. Order from Day #2 can be started to produce on the production Line #2, while it will also be finished on the fourth day. It is possible to continue in the same way for orders from Day #3, Day #4, and Day #5, while orders from Day #4 and Day #5 can be produced on Lines #1 and 2 because the previous production was completed the day before. This is a schedule for five daily orders which can be finished to eight days using the defined three production lines.
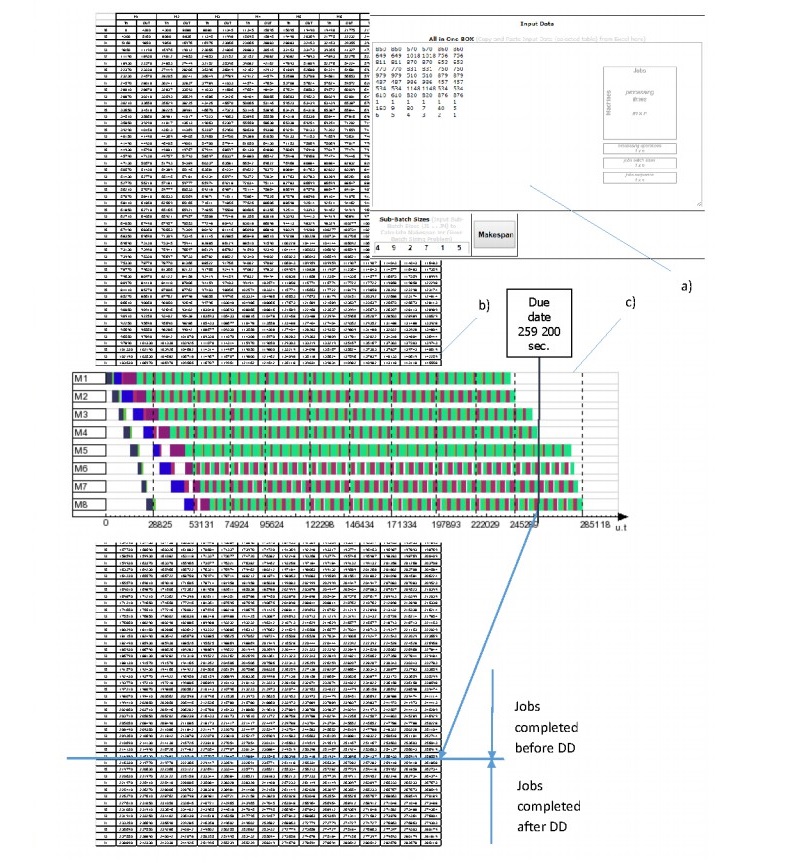
Idle time of Line #2 on the fifth day can be utilised for the second sub-order of Day #3. Then, the tardiness would be eliminated. The splitting of the any daily order can be supported by the software. To be specific, the order of Day#3 could be split up into two sub-orders by the following manner, as shown in Supplement A. Firstly, we will use outputs of the software in the form of Gantt chart representing the sub- schedule for orders of Day#3 (Supplement A (c)). One can see from the Gantt chart where DD is depicted that several transport batches of different jobs will be completed after DD. In order to identify all such transport batches, the available table with in-out times of each transport batch of given job on each machine can be used (Supplement A (b)). Then, we can exactly determine the number of transport batches of each job with tardiness. Namely, they are five transport batches of J1, four transport batches of J2 and four transport batches of J3, totally 32 uncompleted parts.
DISCUSSIONS
Obtained and above referred results provide evidence that proposed idea to split QP of all jobs to the same or almost the same transport batches is not only useful, but also practicable in real time operation.
Further, as it has been shown in previous section, sometimes can occur specific situations that require reorganizing customer orders from one day to another with the aim to keep due dates in mind. Then, reorganization of multi Gantt charts can be easily reached by supporting software, by which single Gantt charts are generated and in –out times of each transport batch of given job on each machine are enumerated as shown in Supplement A.
By satisfying the due date constraint, the proposed solution guarantees to cover the large variety of demands. On the other hand, by satisfying the time horizon constraint, the solution assures that the products are on-time delivered to the customer, and this will increase the competitiveness of the mass customization producer. Moreover, the lower production costs obtained thanks to the lover number of changeovers can increase competitiveness and profit.
The important rule of proposed scheduling method is determination of optimal smallest scheduling periods, e.g., days. Idle time between the end and the beginning of the production can be used, e.g., for quality control operations.
The proposed method enables to model the production schedules continually and eliminate of stochastic effects in the production. Developed software is free and available online through the link in reference list. Obviously, this software cannot cover all possible scheduling tasks in terms of mass customization (Chandra and Kamrani, 2004). Its main limitation lays in the fact that setup times are included in the processing times, or are even ignored. Moreover, each machine can process, at most, one job at a time. Future research directions may be also oriented on incorporation different constraints such as the minimal number of changeovers, the elimination of idle times, the flow time minimization, etc.
Moreover, our next effort will be also focused on verification of this method in different manufacturing conditions.
REFERENCES
Castillo, F., and Gazmuri, P. 2015. Genetic algorithms for batch sizing and production scheduling, International Journal of Advanced Manufacturing Technologies. 77: 261–280.
Chandra, C., and Kamrani, A.K. 2004. Mass customization: a supply chain approach. Springer Science & Business Media.
Chatzopoulos, C., Tsigkas, A., Anisic, Z., and Freund, R. 2011. Making Approaches Between Flow Manufacturing and Mass Customization Industries. In Proceedings of the XV International Scientific Conference on Industrial Systems (IS'11). p. 53.
Chen, Y.J., Zhang, M., and Tseng, M.M. 2004. An integrated process planning and production scheduling framework for mass customization. Journal for Manufacturing Science and Production. 6: 89-101.
Dou, R., Zong, C., and Nan, G. 2016. Multi-stage interactive genetic algorithm for collaborative product customization. Knowledge-Based Systems. 92: 43–54.
Gaia N., Pacciarelli D. and Pacifici A. 2002. Optimally balancing assembly lines with different workstations Discrete applied mathematics. 118: 99-113.
Gujjula R. and Günther H.O. 2009. Resequencing mixed-model assembly lines under just in-sequence constraints. In: International conference on computers and industrial engineering (CIE 2009). IEEE: 668–73.
Kim, Y.K., Kim, Y., and Kim, Y.J. 2000. Two-sided assembly line balancing: a genetic algorithm approach, Production Planning & Control. 11: 44-53.
Lau, W.K. Elaine. 2008. Factors influence on success mass customization. Proceedings of Decision Sciences Institute Conference. MD: Baltimore.
Modrak, V. and Marton, D. 2014. Configuration complexity assessment of convergent supply chain systems. International Journal of General Systems. 43: 508-520.
Modrak, V. and Pandian, R.S. 2010. Flow shop scheduling algorithm to minimize completion time for n-jobs m-machines problem. Tehnički vjesnik. 17: 273- 278.
Modrak, V. and Soltysova, Z. 2017. Novel complexity indicator of manufacturing process chains and its relations to indirect complexity indicators. Complexity. 2017: Article ID 9102824.
Rahimi-Vahed, A.R., Rabbani, M., Tavakkoli-Moghaddam, R., Torabi, S.A., and Jolai F. 2007. A multi-objective scatter search for a mixed-model assembly line sequencing problem. Advanced Engineering Informatics, 21: 85-99.
Semanco, P. and Modrak, V. 2012. A comparison of constructive heuristics with the objective of minimizing makespan in the flow-shop scheduling problem. Acta Polytechnica Hungarica, 9: 177-190.
Taube, F., Minner, S. 2018. Resequencing mixed-model assembly lines with restoration to customer orders. Omega. 78: 99–111.
Valero-Herrero, M., Garcia-Sabater, JP., Vidal-Carreras, P.I. 2014. Canos-Daros L., Solving the car resequencing problem with mix banks. Dirección y Organización, 54: 36–44.
Yao, J. and Liu, L. 2009. Optimization analysis of supply chain scheduling in mass customization. International Journal of Production Economics. 117: 197–211.
Zhang, Z., Cheng, W., Song, L., and Yu Q. 2009. An ant-based algorithm for balancing assembly lines in a mass customization environment. In Intelligent Systems and Applications, 2009. ISA 2009. International Workshop on IEEE: 1-4.
OPEN access freely available online
Chiang Mai University Journal of Natural Sciences [ISSN 16851994]
Chiang Mai University, Thailand https://cmuj.cmu.ac.th
Supplement A
a) Table with in-out times of each QT of given job on each machine of the order of the Day #3.
b) Gantt chart of the jobs sequence on the machines of the order of the Day #3.
c) Input data of the order of the Day #3.
Modrak Vladimir1,*, Soltysova Zuzana1 and Semanco Pavol2
1 Faculty of Manufacturing Technologies, Technical University of Kosice, Presov 08001, Slovensko
2 Lear corporation, Presov 08001, Slovakia
Corresponding author: Modrak Vladimir, E-mail: vladimir.modrak@tuke.sk
Total Article Views
Editor: Wasu Pathom-aree,
Chiang Mai University, Thailand
Article history:
Received: February 6, 2020;
Revised: May 12, 2020;
Accepted: May 27, 2020