 ISSN: 2822-0838 Online

IT Usage in Logistics and Supply Chain of Thai Industry Toward Industry 4.0
Sakgasem Ramingwong, Korrakot Yaibuathet Tippayawong, Apichat Sopadang, Salinee Santiteerakul, Alonggot Limcharoen, and Wapee Manopiniwes*
Published Date : 2021-04-01
DOI : https://doi.org/10.12982/CMUJNS.2021.021
Journal Issues :
Number 2, April-June 2021
IT Usage in Logistics and Supply Chain of Thai Industry Toward Industry 4.0
Abstract The paper aims at exploring the level of Information Technology usage in managing logistics and supply chain of Thai industry. The paper investigates the level of IT usage in managing logistics and supply chain of nine industry groups, based on the database of Logistics/ Supply Chain Scorecard (LSC). Of interest are (1) data interchange coverage, (2) open standards and unique identification codes and (3) logistics and supply chain IT capacity building. By mapping the logistics potential expectation of each industry, the paper can identify the levels of IT usage in each industry. The finding is suggestive of whether any policy be made to promote or support each of these industries.
Keywords: IT in Logistics, Scorecard, Supply Chain Management, Thai industry
Citation: Ramingwong, S., Tippayawong, K.Y., Sopadang, A., Santiteerakul, S., Limcharoen, A., and Manopiniwes, W. 2021. IT usage in logistics and supply chain of thai industry toward industry 4.0 CMUJ. Nat. Sci. 20(2): e2021021.
INTRODUCTION
Thailand is the world’s 20th biggest economy with GDP of 406.9 US$ billion with the industry sector contribution accounting for 39.2% of GDP. Recently, Thailand has positioned toward a value-added economy with key agendas of creativity, innovation, and digitalisation to overcome a middle-income trap. The scheme is called Thailand 4.0, a revised version of Industry 4.0 with national sustainability harmonisation (Jones and Pimdee, 2017; Puncreobutr, 2017).
Industry 4.0 is referred as the 4th Industrial Revolution and is a concept where industry utilises Cyber-Physical Systems (CPS), the Internet of Things (IoT) and the Internet of Services to leverage manufacturing. Industry can then decentralise, integrate horizontally and vertically. The production system and the supply chain can be controlled and analysed effectively (Jazdi, 2014; Lasi et al., 2014; Gilchrist, 2016) with the use of smart technology such as sensors, actors, and autonomous systems (Lucke, Constantinescu and Westkämper, 2008).
Information Technology is undoubtedly the essence of Industry 4.0 where data and information must be stored, retrieved, and manipulated. Thus, the system can be connected and communicated. It is, therefore, the aim of the paper to investigate level of Information Technology usage within Thai industry. Of interest to this paper is the information and Information Technology (IT) usage in managing logistics and supply chain of Thai industry which are the critical keys of this transformation (Baxter, 2017; Thailand Board of Investment, 2017; Ramingwong and Manopiniwes, 2019).
Of the concerned industries, 40.7% are medium hi-tech and hi-tech (Martin et al., 2018). The two major categories of goods produced in Thailand are automotive and electronics. Food and agricultural industries are also among the top contributors in terms of labour and productivity (Pungchompoo and Sopadang, 2015). However, the study shows that logistics performances of Thai industry are debatably improving. Accuracy, flexibility and reliability are among the concerns. Also, logistics costs in Thailand are high (Limcharoen et al., 2017; Jangkrajarng et al., 2018).
Whilst data and information are critical to logistics management as well as to Industry 4.0 challenge, the level of Information Technology (IT) usage in Thai industry is questionable. The paper is, then, aiming at investigating the level of IT usage in managing logistics and supply chain of Thai industry.
It shall be noted that each industry requires different objectives of logistics and supply chain management, e.g., cost, responsiveness, agility. Therefore, the level of IT usage can be varied by industry sectors. In addition, 96% of Thai enterprises are small and medium (SMEs). Their investment can be low, and, as such, the level of technology sophistication and IT usage can be conditional (World Bank Group, 2017). It is clear that, without data, information or IT, it is very difficult to create anything. Therefore, it can be a big obstacle for any industry if their level of IT usage is limited (Bellinger, Castro and Mills, 2004; Lee, Kao and Yang, 2014; Ramingwong, Manopiniwes and Jangkrajarng, 2019).
The logistics and IT ecosystem of Thailand are investigated and reviewed by many sources. In the World Bank’s Logistics Performance Index Report, Thailand’s logistics performance has not been improved significantly from 35th rank in 2014 to 34th rank in 2018 out of 160 countries (Arvis et al., 2018). In terms of IT, Thailand is ranked low at 78 out of 176 countries on ITU’s ICT Development Index 2017 (International Telecommunication Union, 2017). Thailand is also ranked 62 out of 139 countries on the World Economic Forum’s (WEF’s) Networked Readiness Index 2016 (Baller, Dutta and Lanvin, 2016). These are only some reflections to the logistics of Thai industry and their IT ecosystems.
MATERIALS AND METHODS
The paper aims at exploring the level of IT usage of Thai industries. The investigation will base on the database of Logistics/ Supply Chain Scorecard (LSC), developed and collected by the Ministry of Industry.
Survey on Logistics Potential of Thai Industry
The Division of Logistics, Ministry of Industry of Thailand, holds the main responsibility for industrial logistics improvement of Thailand. The division has supported thousands of industries to increase logistics capability and, hence, their competitiveness (Ramingwong, Sopadang and Tippayawong, 2015; Manopiniwes et al., 2019). The national survey on logistics potential of Thai industry was a highlight project of the division. The project aims at exploring and investigating the logistics potential of Thai industry. The survey uses as an assessment tool.
Logistics/ Supply Chain Scorecard
LSC is a structural self-assessment scorecard. The participants can evaluate their logistics potential and benchmark with their peers with the basic statistics (e.g., min, max, mode) available in the database. The scorecard is based on original work by Tokyo Institute of Technology in collaboration with the Japan Institute of Logistics System (JILS) (Yaibuathet, Enkawa and Suzuki, 2007; 2008). LSC was further developed by the Ministry of Industry of Thailand per Thai industry nature (Ministry of Industry of Thailand, 2017).
LSC is constructed of five assessment areas, including Area 1: Corporate strategy and inter-organisation alignment, Area 2: Planning and execution capability, Area 3: Logistics performance, Area 4: IT methods and implementation and Area 5: External collaboration.
Each area then comprises several items of interest. For example, three items in Area 4: IT methods and implementation, i.e., item 4.1 Data interchange coverage, item 4.2 Open standards and unique identification codes and item 4.3 Logistics and supply chain IT capacity building. Figure 1 illustrates five areas, 23 items in a scope of LSC.
LSC structure is well-developed. Each item of assessment is clearly defined per their objectives of assessment. The scorecard is then developed to identify the potential, based on 5-pint scale. In general, the fifth level (or score 5) indicates as the best practice of logistics and supply chain management. On the other hand, the first level (score 1) indicates the least preferable.
Of interest of this paper is the level of IT usage of Thai industries. Therefore, the data in Area 4: IT methods and implementation are focused. They are as follows:
Item 4.1 Data interchange coverage focuses on how Electronic Data Interchange (EDI) is used within the company and its supply chain. The use of EDI will ensure that the information sharing is effective (Yu, Yan and Cheng, 2001). It helps reduce logistics cost and allows the company to be agile (Christopher, 2000; Machuca and Barajas, 2004). This is a very basic backbone of smart logistics and supply chain management for Industry 4.0.
Item 4.2 Open standards and unique identification codes are means to improve logistics efficiency by simplifying data processing and logistics communication. If extended to the supply chain level, the total supply chain cost can be reduced (Li et al., 2009; Musa, Gunasekaran and Yusuf, 2014).
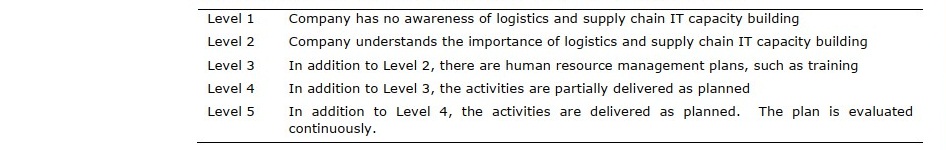
Item 4.3 Logistics and supply chain IT capacity building focuses on planning and activities in capacity building of IT personnel as a key driver of the Information System (Broderick and Boudreau, 1992; Ross, Beath and Goodhur, 1995; Powell and Dent-Micallef, 1997). Here, the human resource management and development system is considered.
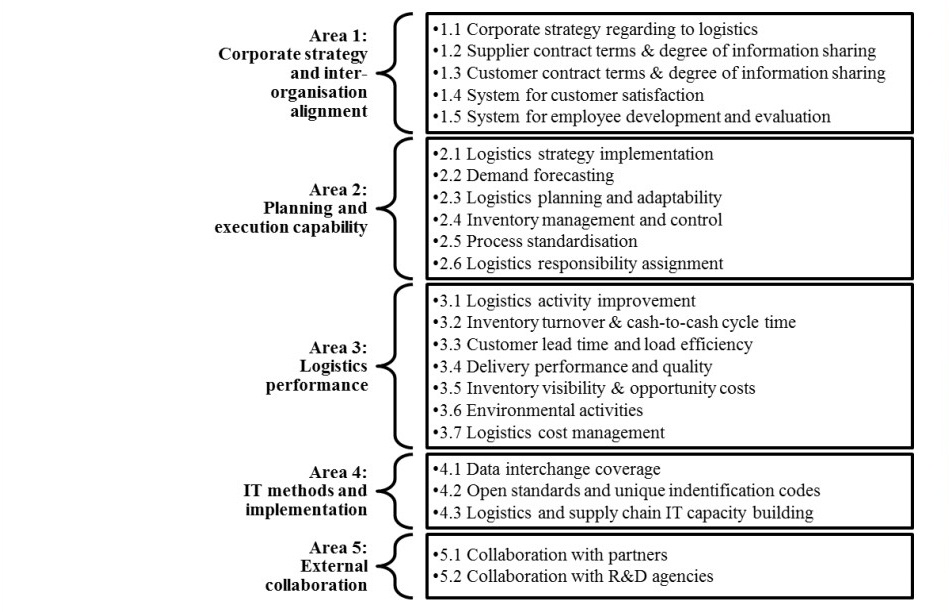
Figure 1. Logistics/ Supply Chain Scorecard: five Areas, 23 Items.
Tables 1-3 summa rise descriptions and score definitions of three assessment items in Area 4.
Table 1. Item 4.1 Data interchange coverage.

Table 2. Item 4.2 Open standards and unique identification codes.
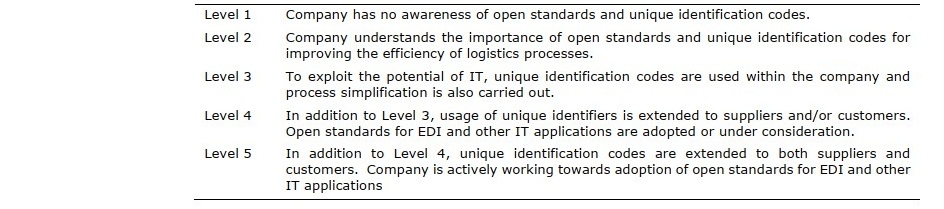
Table 3. Item 4.3 Logistics and supply chain IT capacity building.
Database of LSC
In 2017, 100 companies in Thailand participated in the logistics potential survey project. This paper focuses on nine key product categories according to the International Standard Industrial Classification (ISICs) (United Nations, 2008). The nine ISIC are:
- ISIC 10 Manufacture of food products
- ISIC 15 Manufacture of leather and related products
- ISIC 20 Manufacture of chemicals and chemical products
- ISIC 21 Manufacture of pharmaceuticals, medicinal chemical and botanical products
- ISIC 22 Manufacture of rubber and plastics products
- ISIC 25 Manufacture of fabricated metal products, except machinery and equipment
- ISIC 27 Manufacture of electrical equipment
- ISIC 28 Manufacture of machinery and equipment e.c.
- ISIC 29 Manufacture of motor vehicles, trailers and semi-trailer
Due to the limitation of data amount, it will be highlighted here that the database is small. Therefore, the discussion in this paper is statistically inconclusive. The study is only preliminary investigation.
RESULTS
Logistics Potential of Thai Industry
Based on 23 items of assessment, Thai industry as a whole gets an average score at 2.93 out of 5. This is suggestive that Thai industry logistics is moderately managed. However, there must be room for improvement.
Figure 2 illustrates average LSC score of Thai industry in five areas of assessment. It can be seen that Thai industry is mostly progressive in Area 1: Corporate strategy and inter-organisation alignment. This is indicative that Thai industry pays attention in logistics and supply chain management in terms of strategies and collaborations with their supply chain.
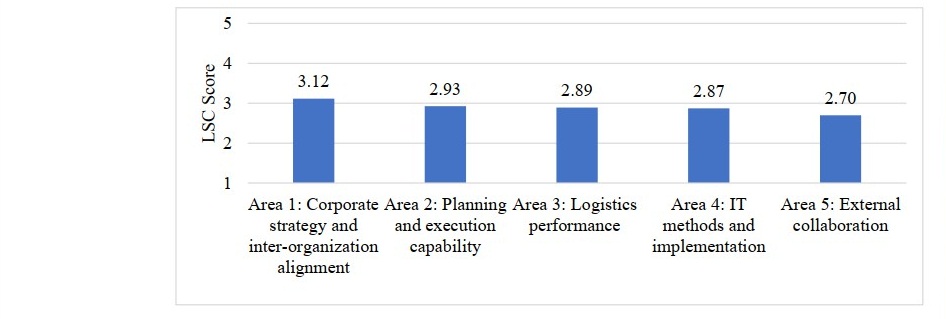
Figure 2. Average LSC Score of Thai Industry – five Areas of Assessment.
Thai industry is also good in Area 2: Planning and execution capability, Area 3: Logistics performance and Area 4: IT methods and implementation, with the average scores of 2.93, 2.89 and 2.87, respectively. However, the score in Area 5: External collaboration is slightly low in comparison to other areas.
Logistics Potential of Thai Industry – Investigation by ISIC
Before jumping into the IT area, Figure 3 illustrates the overview logistics potential of the nine ISIC. The score represents the average score of 23 items to reflect the potential of each industry group. Here, it can be seen that ISIC 29 (Manufacture of motor vehicles, trailers and semi-trailer) is outstanding at the average score of 3.81. ISIC 22 (Manufacture of rubber and plastics products) and 25 (Manufacture of fabricated metal products, except machinery and equipment) are also competitive at the average scores of 3.13 and 3.19, respectively. ISIC 28 (Manufacture of machinery and equipment n.e.c.) is also above the average at the score of 2.99. On the other hand, ISIC 10 (Manufacture of food products) and 21 (Manufacture of pharmaceuticals, medicinal chemical and botanical products) scores are as low as 2.57 and 2.56, respectively.
This first investigation will then be used for mapping the industry group into what is the expectation. If the average score is high, the IT score should be high accordingly. Otherwise, it will be noted.

Figure 3. Average LSC Score of 9 ISIC.
IT Usage in Managing Logistics and Supply Chain of Thai Industry
– Investigation by ISIC
Focusing on Information Technology (IT) usage in managing logistics and supply chain of Thai industry, three items are to be investigated. There are three items in Area 4: IT methods and implementation, i.e., (1) data interchange coverage, (2) open standards and unique identification codes and (3) logistics and supply chain IT capacity building. Figures 4-6 illustrate the investigation, where scores of each item, on y-axis, are mapped against the LSC Score. The dotted line represents the average trendline as the average line for all industry sectors. If any industry lies above the trendline, they are considered better than the average and can be called “beyond expectation”. Thus, potential of each ISIC can be discussed as follows.
Item 4.1 Data Interchange coverage. Firstly, we focus on the score on Data interchange coverage only. From Figure 4, it is clear that ISIC 25 (Manufacture of fabricated metal products, except machinery and equipment) is the most advanced ISIC, scoring at 3.80. ISIC 22 (Manufacture of rubber and plastics products), 27 (Manufacture of electrical equipment), 28 (Manufacture of machinery and equipment n.e.c.) and 29 (Manufacture of motor vehicles, trailers and semi-trailer) are also good with the score above the item’s average mark (at 2.93), which means they use EDI and have integrated the EDI within the company’s internal systems. On the other hand, ISIC 10 (Manufacture of food products), 15 (Manufacture of leather and related products) and 20 (Manufacture of chemicals and chemical products) score among the lowest. This means that EDI are implemented, yet, limitedly. ISIC 21 (Manufacture of pharmaceuticals, medicinal chemical and botanical products) is also lying slightly lower than the average.
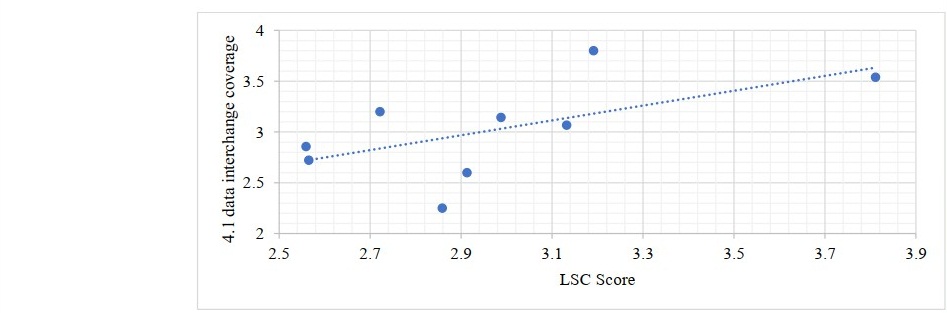
Figure 4. Item 4.1 Data Interchange coverage vs. average LSC.
Secondly, we compare the score of Data interchange coverage with the expectation (trendline). The case can be further discussed. For example, ISIC 22 (Manufacture of rubber and plastics product) and 29 (Manufacture of motor vehicles, trailers and semi-trailer) with high scores in Data interchange coverage perform slightly below expectation when considering their average LSC scores. This can be suggestive for further improvement. Oppositely, ISIC 21 (Manufacture of pharmaceuticals, medicinal chemical and botanical products), which score lower than the average, is, in fact, better than the expectation.
On the extreme sides, ISIC 20 (Manufacture of chemicals and chemical products) is much lower than expectation. They must improve.
ISIC 25 (Manufacture of fabricated metal products, except machinery and equipment), 27 (Manufacture of electrical equipment) and 28 (Manufacture of machinery and equipment n.e.c.) also perform better than expectation.
Item 4.2 Open standards and unique identification codes. Focusing on the score of 4.2 Open standards and unique identification codes (Figure 5), ISIC 29 (Manufacture of motor vehicles, trailers and semi-trailer) is the most advanced with the score of 3.77. They also perform slightly over expectation. This means they use a unique identification code within the company and this is partially extended to its supply chains. ISIC 22 (Manufacture of rubber and plastics products) also positions well, scoring at 3.33. On the other hand, ISIC 10 (Manufacture of food products), 15 (Manufacture of leather and related products), 20 (Manufacture of chemicals and chemical products), 21 (Manufacture of pharmaceuticals, medicinal chemical and botanical products), 25 (Manufacture of fabricated metal products, except machinery and equipment) and 27 (Manufacture of electrical equipment) lie below the item’s average. The average score of the item is 2.95.

Figure 5. Item 4.2 Open standards and unique identification codes vs. average LSC.
When comparing to the LSC score, it is suggestive that ISIC 21 (Manufacture of pharmaceuticals, medicinal chemical and botanical products) in fact performs well over expectation on this topic. Among ISIC 10 (Manufacture of food products), 15 (Manufacture of leather and related products), 25 (Manufacture of fabricated metal products, except machinery and equipment) and 27 (Manufacture of electrical equipment), which are below expectation, ISIC 25 (Manufacture of fabricated metal products, except machinery and equipment) is the weakest, far out of the trend line.
Item 4.3 Logistics and supply chain IT capacity building. Figure 6 illustrates the scores of Item 4.3 Logistics and supply chain IT capacity building against average LSC score. The item has the lowest average score of 2.73 among the IT issues. Again, ISIC 29 (Manufacture of motor vehicles, trailers and semi-trailer) is the most advanced, scoring at 3.57. ISIC 21 (Manufacture of motor vehicles, trailers and semi-trailer) and 22 (Manufacture of rubber and plastics products) are also among the top performers. ISIC 10 (Manufacture of food products), 25 (Manufacture of fabricated metal products, except machinery and equipment) and 27 (Manufacture of electrical equipment) are otherwise.

Figure 6. Item 4.3 Logistics and supply chain IT capacity building vs. average LSC.
When comparing with the average LSC Score, it can be seen that the IT capacity building of ISIC 21 (Manufacture of pharmaceuticals, medicinal chemical and botanical products) is preferable. Their potential is beyond expectation despite low average LSC score. ISIC 22 (Manufacture of rubber and plastics products) and 29 (Manufacture of motor vehicles, trailers and semi-trailer) are also doing well on the issue. Oppositely, ISIC 25 (Manufacture of fabricated metal products, except machinery and equipment) and 27 (Manufacture of electrical equipment) are in the least preferable positions, far out from the trend line. It suggests that they should improve on the logistics and supply chain IT capacity building.
DISCUSSION
The result is suggestive that ISIC 29 (Manufacture of motor vehicles, trailers and semi-trailer), which is generally the most advanced ISIC in terms of logistics potential (Tippayawong et al., 2016), is somehow questionable in terms of data interchange coverage. ISIC 21 (Manufacture of pharmaceuticals, medicinal chemical and botanical products), which is among the lowest potential industry in LSC, is somehow not as bad. They, in fact, perform better than expectation in all IT areas.
During results presentation, many interesting points were made, for example, ISIC 20 (Manufacture of chemicals and chemical products) and 22 (Manufacture of rubber and plastics products) as well as ISIC 29 need improvement for Data interchange coverage issue. ISIC 25 (Manufacture of fabricated metal products) also needs improvement for Open standards and unique identification codes issue. ISIC 25 and 27 (Manufacture of electrical equipment) need improvement in Logistics and supply chain IT capacity building issue. It will be interesting to see if these findings are aligned with other logistics performance in other perspectives (jangkrajarng et al., 2018).
CONCLUSION
The paper focuses on the potential of Thai industry based on three Information Technology perspectives of logistics and supply chain, i.e., (1) Data interchange coverage, (2) Open standards and unique identification codes and (3) Logistics and supply chain IT capacity building. The paper investigates the issue based on an industry self-assessment tool, i.e., Logistics/ Supply Chain Scorecard (LSC). With the database of 100 Thai industries, nine industry sectors (by ISIC) are used as the case study.
In addition to direct benchmarking on each ISIC, the investigation and discussion use the assessment score against the average LSC score. This is to reflect the real potential if they are above or below what is the expectation.
The information here is suggestive for the policy makers as well as the industries themselves as to whether any measurement must be delivered to improve the logistics potential of Thai industry as a whole or to any industry in specific. In addition to direct benchmarking on each ISIC, the implications for practitioners or managers is to reflect the real potential if they are above or below what is the expectation. Needs for a better logistics improvement vary from industries to organisations, which challenges companies’ managers accordingly.
ACKNOWLEDGEMENTS
This research is part of the project “Industry 4.0 for SMEs” from the European Union’s Horizon 2020 research and innovation program under the Marie Skłodowska-Curie grant agreement No 734713.
This research work was partially supported by Excellence Center in Logistics and Supply Chain Management, Chiang Mai University – Thailand.
REFERENCES
Arvis, J.F., Ojala, L., Wiederer, C., Shepherd, B., Raj, A., Dairabayeva, K., Kiiski, T. 2018. Connecting to Compete 2018: Trade Logistics in the Global Economy. World Bank.
Baller, S., Dutta, S., Lanvin, B. 2016. The Global Information Technology Report 2016 Innovating in the Digital Economy. World Economic Forum.
Baxter, W. 2017. Thailand 4.0 and the Future of Work in the Kingdom.
Bellinger, G., Castro, D., Mills, A. 2004. Data, information, knowledge, and wisdom.
Broderick, R., Boudreau, J.W. 1992. Human resource management, information technology, and the competitive edge. Academy of Management Perspectives. 6: 7-17.
Christopher, M. 2000. The agile supply chain: competing in volatile markets. Industrial marketing management. 29: 37-44.
Gilchrist, A. 2016. Introducing Industry 4.0. In Industry 4.0 (pp. 195-215). Apress.
Berkeley, CA. International Telecommunication Union, 2017, Measuring the Information Society Report 2017 Volume 2. ICT country profiles.
Jangkrajarng, V., Sopadang, A., Tippayawong, K.Y., Manopiniwes, W., Santiteerakul, S., Ramingwong, S. 2018. Industrial Logistics Performance of Thai Industry. International Journal of Engineering & Technology. 7: 394-398.
Jazdi, N. 2014. Cyber physical systems in the context of Industry 4.0. In Automation, Quality and Testing, Robotics, 2014 IEEE International Conference on (pp. 1-4). IEEE.
Jones, C., Pimdee, P. 2017. Innovative ideas: Thailand 4.0 and the fourth industrial revolution. Asian International Journal of Social Sciences. 17: 4-35.
Lasi, H., Fettke, P., Kemper, H. G., Feld, T., Hoffmann, M. 2014. Industry 4.0. Business & Information Systems Engineering. 6: 239-242.
Lee, J., Kao, H. A., Yang, S. 2014. Service innovation and smart analytics for industry 4.0 and big data environment. Procedia Cirp. 16: 3-8.
Li, G., Yang, H., Sun, L., Sohal, A.S. 2009. The impact of IT implementation on supply chain integration and performance. International Journal of Production Economics. 120: 125-138.
Limcharoen, A., Jangkrajarng, V., Wisittipanich, W., Ramingwong, S., 2017. Thailand Logistics Trend: Logistics Performance Index. International Journal of Applied Engineering Research. 12: 4882-4885.
Lucke, D., Constantinescu, C., Westkämper, E. 2008. Smart factory-a step towards the next generation of manufacturing. In Manufacturing systems and technologies for the new frontier (pp. 115-118). Springer, London.
Machuca, J.A., Barajas, R.P. 2004. The impact of electronic data interchange on reducing bullwhip effect and supply chain inventory costs. Transportation Research Part E: Logistics and Transportation Review. 40: 209-228.
Manopiniwes, W., Tippayawong, K.Y., Numkid, J., Santiteerakul, S., Ramingwong, S., Dallasega, P. 2019. On Logistics Potential of Thai Industry in Identifying Gap to Logistics 4.0. Journal of Engineering and Applied Sciences, 14: 1608-1613.
Martin, C., Samans, R., Leurent, H., Betti, F., Drzeniek-Hanouz, M., Geiger, T., 2018. Readiness for the Future of Production Report 2018. Geneva.
Ministry of Industry of Thailand. 2017. Industrial Logistics Performance Indicator Manual (in Thai).
Musa, A., Gunasekaran, A., Yusuf, Y. 2014. Supply chain product visibility: Methods, systems and impacts. Expert Systems with Applications. 41: 176-194.
Powell, T.C., Dent‐Micallef, A. 1997. Information technology as competitive advantage: The role of human, business, and technology resources. Strategic management journal. 18: 375-405.
Puncreobutr, V. 2017. The policy drive of Thailand 4.0. St. Theresa Journal of Humanities and Social Sciences. 3.
Pungchompoo, S., Sopadang, A. 2015. Confirmation and evaluation of performance measurement model for the Thai frozen shrimp chain. Business Process Management Journal. 21: 837-856.
Ross, J.W., Beath, C.M., Goodhue, D.L. 1995. Developing long-term competitiveness through information technology assets.
Ramingwong, S., Manopiniwes, W. 2019. Supportment for organization and management competences of ASEAN community and European Union toward Industry 4.0. International Journal of Advanced and Applied Sciences, 6: 96- 101.
Ramingwong, S., Santiteerakul, S., Tippayawong, K.Y., Sopadang, A., Limcharoen, A., Manopiniwes, W. 2019. Logistics performance of the Thai food industry. International Journal of Advanced and Applied Sciences, 6: 32-37
Ramingwong, S., Manopiniwes, W., Jangkrajarng, V. 2019. Human Factors of Thailand Toward Industry 4.0. Management Research and Practice, 11: 15-25.
Tippayawong, K.Y., Niyomyat, N., Sopadang, A., Ramingwong, S. 2016. Factors affecting green supply chain operational performance of the Thai auto parts industry. Sustainability. 8: 1161.
Thailand Board of Investment. 2017. Thailand 4.0 means Opportunity Thailand. Thailand Investment Review vol.27 no.1.
United Nations. 2008. International Standard Industrial Classification of All Economic Activities Revision 4. New York.
World Bank Group, 2017, Thailand Economic Monitor 2017 - Digital Transformation. Yaibuathet, K., Enkawa, T., Suzuki, S. 2007. Supply Chain Operational Performance and Its Influential Factors: Cross National Analysis (< Special English Issue> Global Supply Chain Management). Journal of Japan Industrial Management Association. 57: 473-482.
Yaibuathet, K., Enkawa, T., Suzuki, S. 2008. Effect of industry type and ownership status on supply chain operational performance in a developing country. International Journal of Integrated Supply Management. 4: 322-354.
Yu, Z., Yan, H., Cheng, T.C.E. 2001. Benefits of information sharing with supply chain partnerships. Industrial management & Data systems. 101: 114-121.
OPEN access freely available online
Chiang Mai University Journal of Natural Sciences [ISSN 16851994]
Chiang Mai University, Thailand https://cmuj.cmu.ac.th
Sakgasem Ramingwong, Korrakot Yaibuathet Tippayawong, Apichat Sopadang, Salinee Santiteerakul, Alonggot Limcharoen, and Wapee Manopiniwes*
Center of Excellence in Logistics and Supply Chain Management, Chiang Mai University, Thailand
Corresponding author: Wapee Manopiniwes, E-mail: wapee.m@gmail.com
Total Article Views
Editor: Wasu Pathom-aree,
Chiang Mai University, Thailand
Article history:
Received: February 6, 2020;
Revised: May 12, 2020;
Accepted: May 27, 2020