 ISSN: 2822-0838 Online

Analysis of Optical Emission Spectra during Nitrogen-Plasma Treatment to Control the Wettability of Polystyrene Surface
Masruroh*, Dionysius J. D. H. Santjojo, and Ahmad TaufiqPublished Date : 2021-04-01
DOI : https://doi.org/10.12982/CMUJNS.2021.054
Journal Issues : Number 3, July-September 2021
Abstract In this work, we apply optical emission spectroscopy to investigate active plasma species to study that plasma nitrogen treatment affects polystyrene surfaces. Data concerning these active plasma species are crucial for exploring the polystyrene layer's functionality deposited on quartz crystal microbalance (QCM) surface. Wettability function in biosensors development is essential aspects for biomolecule immobilization. The surface of the polystyrene layer was modified by plasma nitrogen treatment. The process parameters affecting plasma species and characteristic, and hence the treatment results studied in this work were chamber pressure, flow rate, and DC bias. The plasma analysis was conducted by optical emission spectroscopy. The spectroscopy was utilized to predict the active species of plasma, the electron temperature Te and the electron density Ne. The dominant reactive species was N2+ which go through different plasma interactions and on the polystyrene surface depending on the DC bias voltage, the nitrogen- gas flow rate, and the chamber pressure. The plasma treatment results suggest that the ion bombardment was the dominant mechanism that changes the polystyrene's surface. The plasma behavior and surface interactions were found complex with the variation of the process parameter.
Keywords: Electron density, Electron temperature, OES, Nitrogen-plasma treatment, Wettability
Citation: Masruroh, Santjojo, D.J.D.H., and Taufiq, A. 2021. Analysis of optical emission spectra during nitrogen-plasma treatment to control the wettability of polystyrene surface. CMUJ. Nat. Sci. 20(3): e2021054.
INTRODUCTION
Plasma treatment is widely used to modify polymers' surface properties and improve their performance in various applications. Plasma treatment creates complex blends (atoms, molecules, ions, and radicals) that interact with the specimen’s surface and affect the surface's physical and chemical properties to produce dramatic changes in surface wetting. Generally, a polymer surface exposed to plasma becomes more hydrophilic because of the formation of high-energy surface groups in the original polymer surface group's reaction with the reactive plasma species (Ionita et al., 2013; Šourková, Primc and Špatenka, 2018). In addition to surface chemistry, plasma treatment often influences surface topography, which further enhances the effect of surface chemistry on the contact angle. The plasma parameters determine the function and application of plasma and its role in material modification. The most common plasma diagnostic method is the Langmuir Probe, which is widely used to estimate plasma parameters (Kolpaková, Kudrna and Tichý, 2013). This method is relatively expensive but is technically easy to execute. Optical emission spectroscopy (OES) can serve as a complementary diagnostic method; it is non-invasive, easy to implement, and enables swift measurements. It records the light emitted by the plasma from the electronic transitions of atoms and molecules. The resulted spectrum can be used to identify and monitor chemical species in the plasma. Information related to plasma intensity and species can be utilized to investigate correlations between plasma processing properties and surface characteristics (Zhang and Yadavalli, 2011). The plasma state can be predicted from the plasma characteristics given by the electron temperature (Te) and density (Ne). The electron temperature and electron density are determined by the plasma's control parameters, such as RF voltage, gas pressure, gas flow rate, and DC bias.
Polystyrene(s) is a polymeric material commonly used to develop biosensors, and surface properties are crucial for biosensors. The surface properties of sensors or their coatings act as a matrix for biomolecule immobilization. Wettability plays a critical role in biomolecule immobilizations. It can be improved by modifying the surface morphology. Previous studies show that exposing polystyrene to ultraviolet irradiation produces more hydrophilic surfaces that can be observed by contact-angle measurements (Sakti et al., 2017). Our work also observed the effect of various solvents on the surface roughness of polystyrene (Masruroh et al., 2014). The research concludes that a rough polystyrene’s surface increases the biomolecules immobilization by physical adsorption. Another technique for modifying the polymer surface is plasma treatment (Siow et al., 2006; Choudhury et al., 2010). The plasma treatment can change the polymer's microstructure and surface character, which results in functionalization of the surface of the material.
In the present study, OES is used to diagnose and determine the state of plasma nitrogen, which includes plasma species, electron temperature, and electron density, during the plasma-treatment process. This characterization is essential to control the treatment of plasma nitrogen on the polystyrene surface. This research thus investigates how external parameters, including variations of the DC bias voltage, chamber pressure, and flow rate, modify the characteristics of plasma nitrogen and thereby affect polystyrene's surface wettability properties. We also discuss the relationship between plasma species, Te, and Ne and surface wettability and functional groups.
MATERIALS AND METHODS
The polystyrene solution used to coat the quartz crystal resonator has a molecular weight of 192,000 g/mol (Sigma Aldrich) was dissolved in toluene at a concentration of 6%. The Quartz resonator was produced by PT Great Microtama, Surabaya, Indonesia. A 50 μL of polystyrene solution was spin-coated with t1 = 5 s, ω1 = 500 rpm, t2 = 60 s, ω2 = 3000 rpm. The resulting film on the quartz crystal resonator was annealed for 60 minutes at 100 °C to vaporize the remaining solvent. The sample was then subjected to plasma treatment with plasma nitrogen in a vacuum reactor for two minutes. The schematic of the design plasma treatment is shown in Figure 1, and the OES measurement system is depicted in Figure 2.
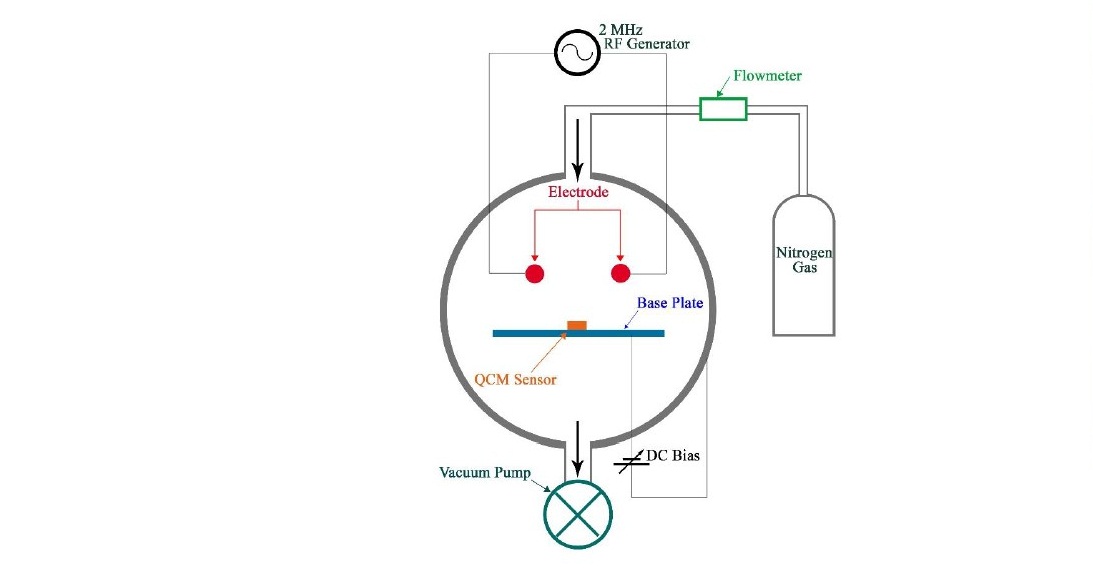
Figure 1. The schematic of the design plasma system used in the treatment.
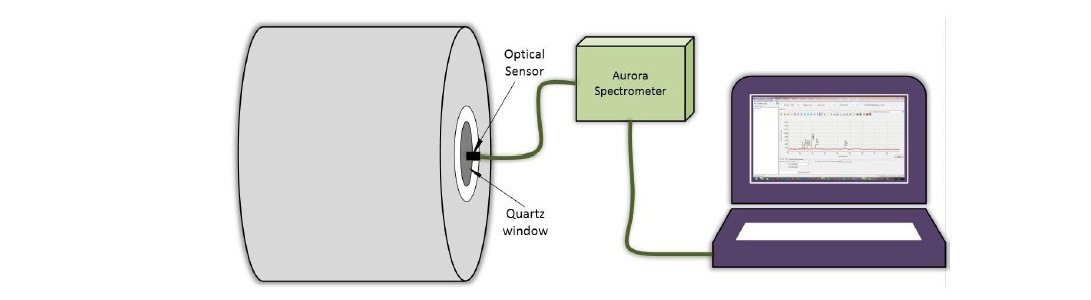
Figure 2. The arrangement of the OES measurement.
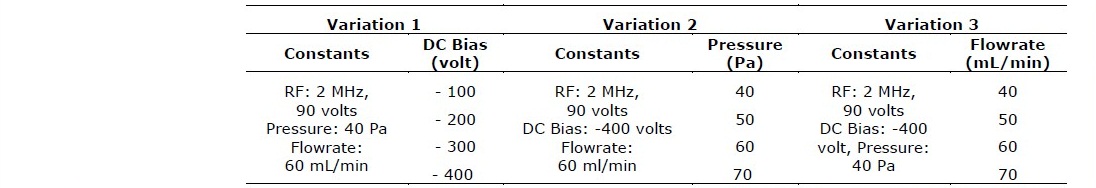
Investigation on the effect of process parameter during the treatment was carried out by varying three parameters, i.e. DC bias voltage, chamber pressure and gas flowrate. The complete sets of parameters used in this experiment are listed in Table 1.
Table 1. Experimental parameters.
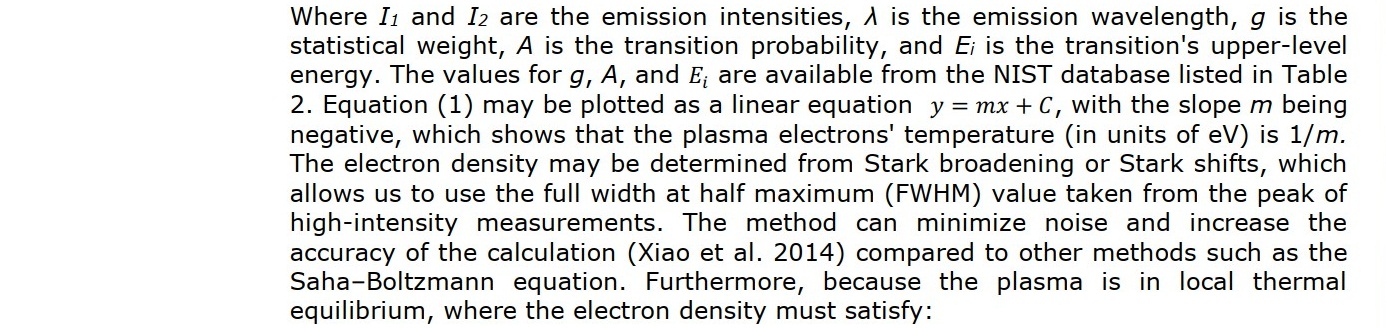
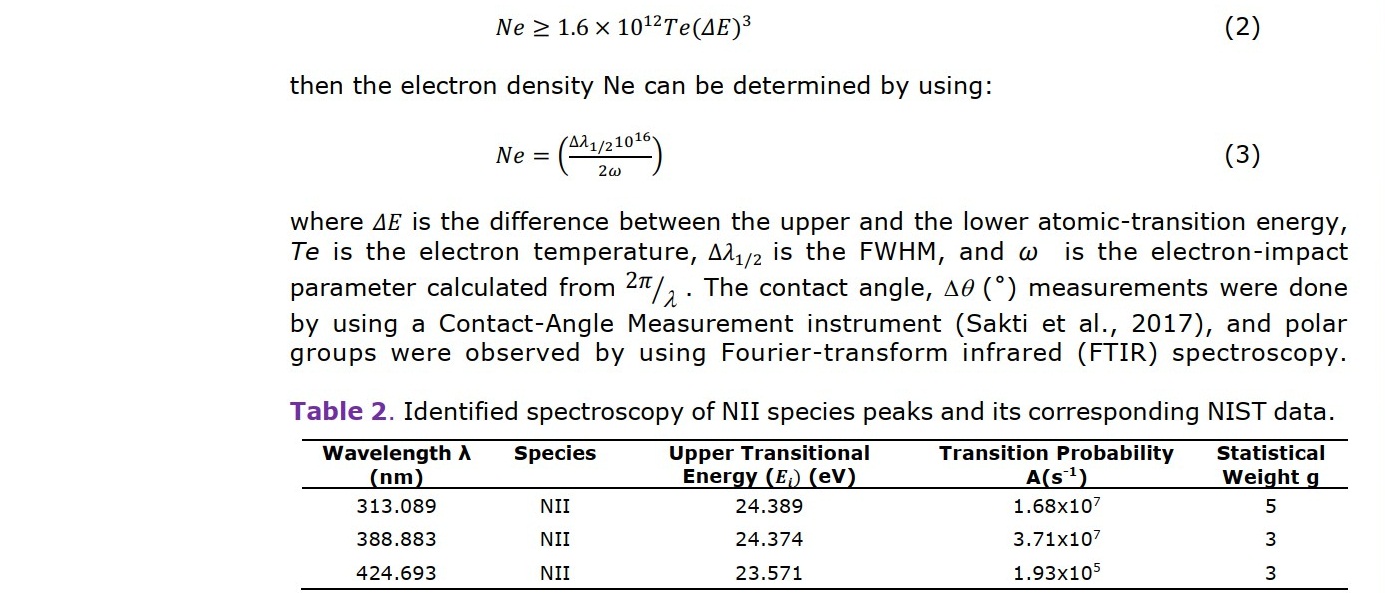
During the plasma-treatment process, the nitrogen-gas plasma spectrum was monitored using Optical Emission Spectrometer (Aurora 4,000) with the count integral time of 50 ms (Figure 2). The spectrum was presented in a graph of the optical emission intensity with the wavelength from 200 to 900 nm. The nitrogen-plasma species were identified by using the NIST atomic-transition database. The identified nitrogen-plasma species were used to determine plasma parameters; namely, temperature and electron density. Assuming that the plasma is in thermodynamic equilibrium, the electron temperature can be determined using the Boltzmann plot (Hamed, 2005; Musadiq et al., 2012; Naeem et al., 2013). The electron temperature was determined by using:

RESULTS
The relationship between the process parameters, which are the DC bias voltage, gas flow rate, chamber pressure, plasma species, electron temperature Te, and electron density Ne, was studied by analyzing the plasma's emission spectra under different conditions. Figure 3 shows a typical spectrum of the nitrogen plasma measured in our system. The spectrum reveals the presence of atomic nitrogen by the peaks from 700 to 900 nm and of molecular nitrogen by the peaks from 200 to 700 nm. The emission of molecular nitrogen originates from the first, second positive system, and the fourth positive system of the transition. The identification of the peaks in the spectrum related to the band system is detailed in Table 3. The molecular species dominate the spectrum, which indicates reactions occur at a relatively low temperature. Strong intensities are found in the second positive band system of the N2+ transitions, especially the peaks at 388.883 and 424.693 nm (Shah et al., 2014). We use the peaks to calculate the electron density and the electron temperature.
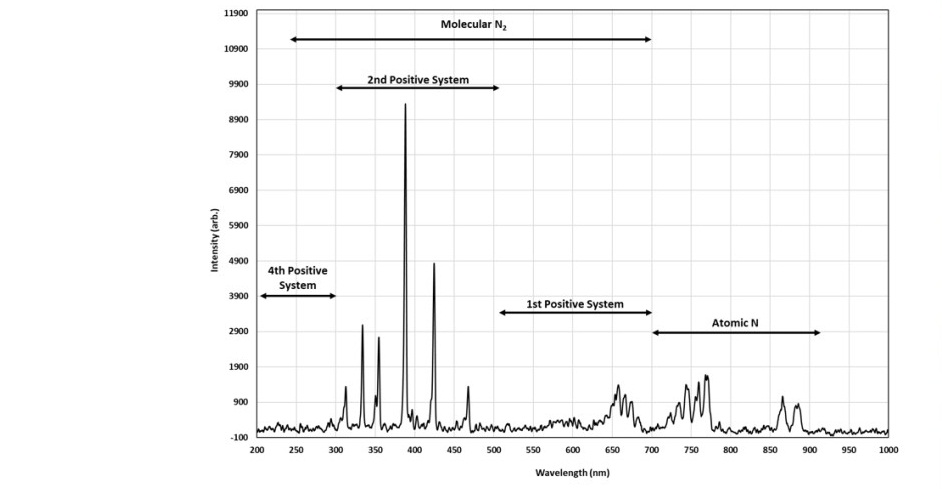
Figure 3. OES spectrum of nitrogen plasma for a chamber pressure of 40 Pa, DC bias of 200 volts, and gas flow rate of 20 mL/min.
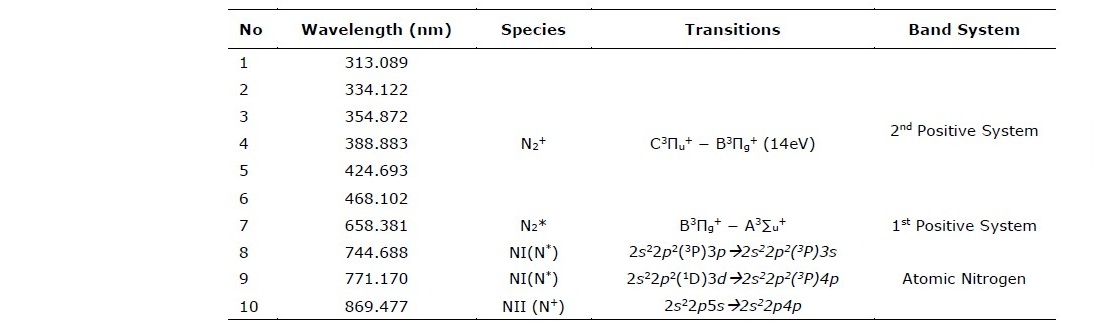
Table 3. Peak Identification from spectral data shown in Figure 1 (Sharma and Saikia, 2008).
This work investigated the emission spectra under three essential parameters in plasma processing, i.e., DC-bias voltage, gas flow rate and chamber pressure. First, the optical emission spectra at various DC bias voltages were acquired at the fixed flow rate and pressure of 60 ml/min and 70 Pa, respectively. The prominent peak observed due to the voltage variation is the N2+ peak at 388.88 nm, as shown in Figure 4.
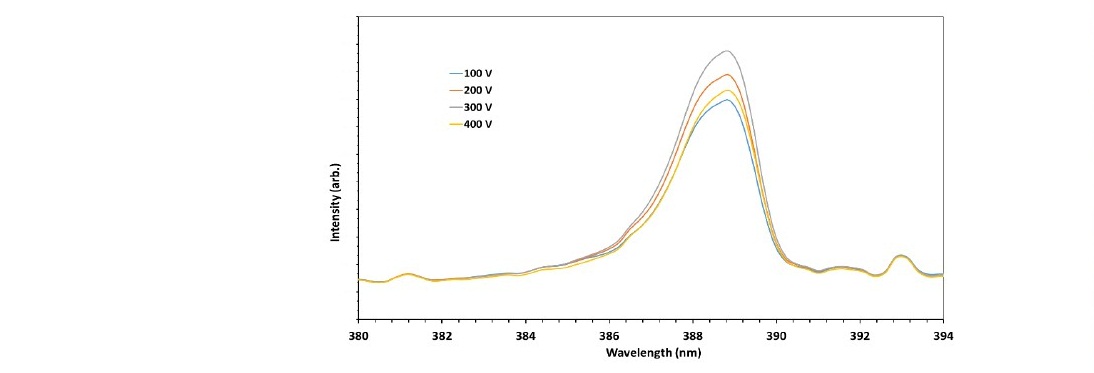
Figure 4. Molecular nitrogen-plasma spectra at a pressure of 70 Pa and a flow rate of 60 ml/min for several DC bias voltages.
The second parameter was the gas flow rate is also one of the critical parameters in vacuum plasma processing. In general, at a given pressure, a lower flow rate means that the gas remains in the system for a longer time, and vice versa. If the gas remains longer in the vacuum chamber, it undergoes more complex reactions. Figure 5 shows the OES for various flow rates.
The last parameter investigated was the chamber pressure. The emission spectrum of various pressure was measured at the gas flow rate of 40 ml/min. Figure 6 shows the OES of nitrogen plasma spectra detected the effect of the chamber pressure variation on the emission intensity.
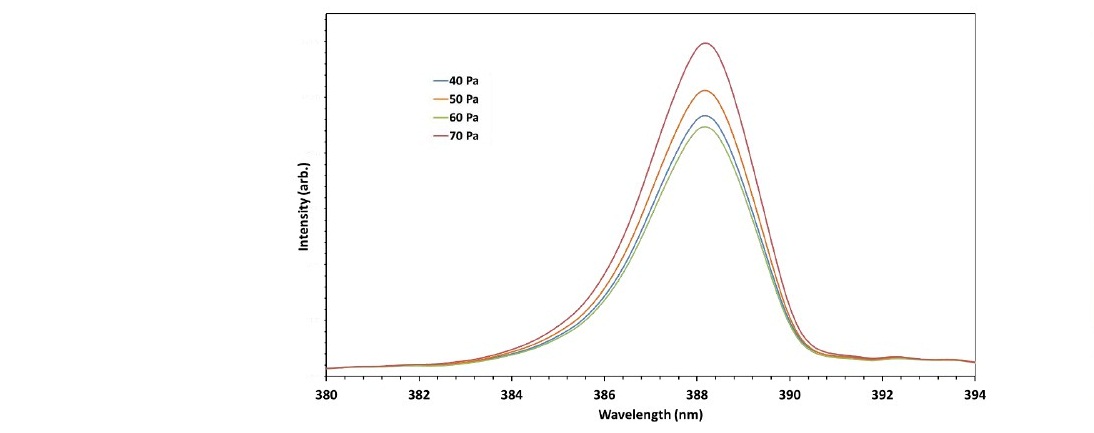
Figure 5. The optical emission spectrum of nitrogen plasma at 40 Pa, RF voltage of 90 V, and flow rates of 20, 40, 50, and 70 ml/min.
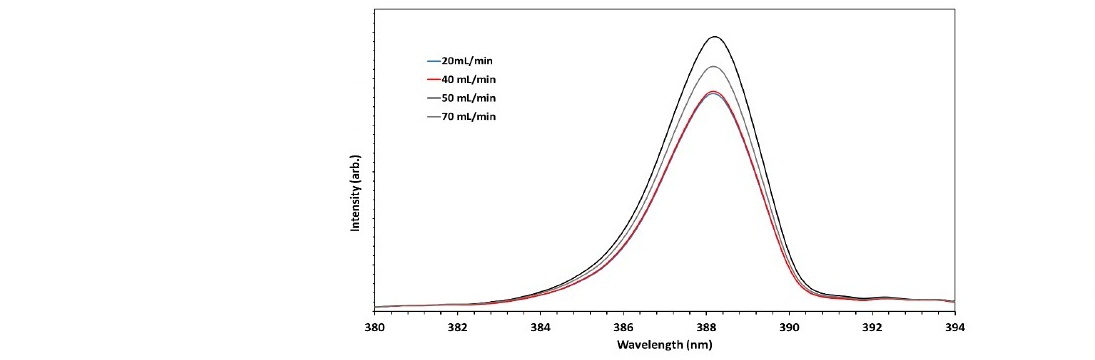
Figure 6. OES spectrum of nitrogen plasma at a flow rate of 40 ml/min and various pressures.
The plasma treatment effect at the various parameters on the wettability of the polystyrene was determined by surface contact angle measurements. In this study, a reduction contact angle, Δθ, was used. The Δθ is defined as the difference between the contact angle of the untreated sample and the nitrogen-plasma-treated sample, i.e. Δθ = Δθuntreated - Δθtreated. The contact angle for samples before plasma treatment average is 85.66°. Table 1 shows how the various parameters affect the Δθ. After the nitrogen plasma treatment, the contact angle decreases, which indicates a change in the wettability of the polystyrene layer from initially hydrophobic to more hydrophilic.
Table 4. The reduction contact angle (Δq) of samples treated at various process parameters.

Further investigations were carried out by infrared (FTIR) measurements on the untreated sample and the samples treated under the various DC-bias voltage. The infrared absorption measurement by the polystyrene samples was focused in the range of 2,200 cm-1 to 2,400 cm-1. The treated samples show new absorbance peaks in the wavenumber range 2,300–2,400 cm-1, as shown in Figure 7.
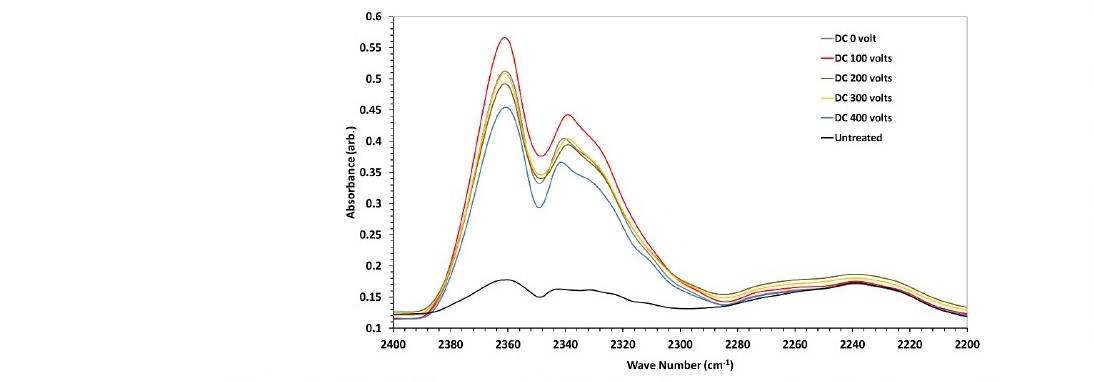
Figure 7. The difference in FTIR absorbance spectra for nitrogen-plasma- treated samples for untreated samples and various DC bias voltages.
The peaks at 2,360 cm-1 and 2,340 cm-1 are assigned to the C≡N functional group (Masruroh et al., 2018). The application of the various DC bias voltages changes the relative absorption of the C≡N group. However, the change of the absorbance was randomly oscillating with the increase of the voltage.
DISCUSSION
To analyze the character of plasma nitrogen from spectral data, it is essential to consider the kinetic reactions described below. First, the reaction between nitrogen molecules and energetic electrons which can ionize nitrogen molecules. The reaction is caused mainly by collisions between electrons and nitrogen molecules:
N2 + e → N2+ + 2e. (4)
The energy of electrons during the collisions affect the products of reactions. The higher energy of electrons triggers dissociations process producing atomic ions rather than the molecular ion. The nitrogen ion is not stable and usually recombines, generating a neutral atom (Ziaur Rahman, 2018). The reaction is:
N2+ + e → N2. (5)
The N2+ species produced by the ionization process in equation 4 was detected by the emission at 388.465 and 424.729 nm. The emissions were utilized to predict the electron temperature Te and the electron density Ne based on the formula in equation 1. The electron density Ne was in the range of 1018 cm-3, comparable to the Langmuir measurement on the similar system (Aizawa, 2018).
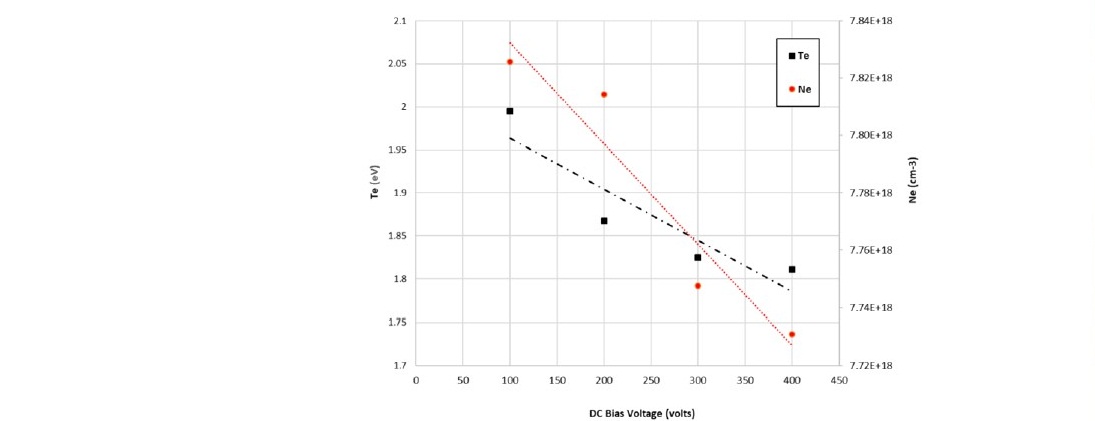
Figure 8. Electron temperature and electron density in nitrogen plasma as a function of DC bias voltage.
During the experiment, the gas was turned into plasma by the application of 2 MHz RF voltage. The negatively biased DC voltage was then applied to accelerate ions toward the polystyrene surface (ion bombardment). It can be seen from Figure 8, that the DC bias voltage controls the electron energy and the electron density. The electron temperature in the plasma depends on the DC bias voltage: increasing the magnitude of the negative DC bias voltage decreases the electron temperature and the electron density. The negative DC bias voltage thickens the plasma sheath at the anode area, creating a counter electric field that decelerates the electrons. A lower electron temperature increases the possibility of recombination, which equates to an increase in electron capture by ions, forming neutral atoms or molecules. The recombination leads to lower electron density, as indicated by equation (5).
Another critical parameter in plasma processing is the gas flowrate. It can be seen in Figure 5 that the intensity of emission at 388 nm in the spectrum initially increased with increasing flow rate. However, the spectrum intensity at the flow rate of 70 ml/min is lower than the one at 50 ml/min.
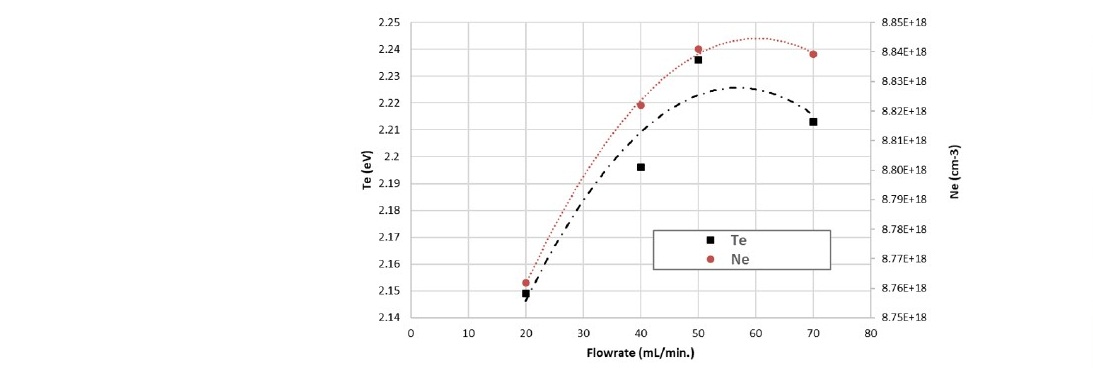
Figure 9. Electron temperature (Te) and density (Ne) of nitrogen plasma as a function of gas flow rate.
Calculations of the electron temperature and the electron density from the spectra measured with the flow rate variation are shown in Figure 9. One of the possible mechanisms to describe the change is the dissociation reaction. At a certain chamber pressure, the higher gas flow rate supplies more “fresh” gas into the chamber replacing the processed gas. The first reaction experienced by the gas in the chamber is the dissociation. The higher concentration of fresh gas injected into the chamber leads to more nitrogen molecules undergoing dissociation reactions. However, it can be seen from Figure 9, the measurement at 70 mL/min resulted in a lower Te and Ne. The explanation of this condition is related to the recombination. At the higher flow rate, the abundance of N2+ ions resulted in more interactions between the ions and electrons producing neutral N2. In our case, this happens between the flow rates of 50 and 70 ml/min.
The last parameter investigated in this work is the chamber pressure. The spectral data in Figure 6 shows that the electron temperature and electron density were calculated and plotted in Figure 10.
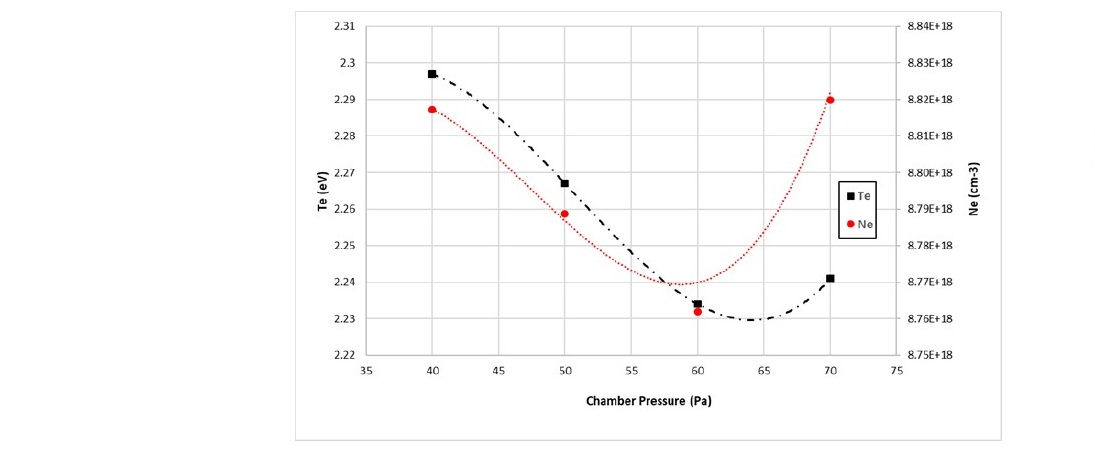
Figure 10. Electron temperature and electron density in nitrogen plasma as a function of chamber pressure.
The electron temperature tent to decrease with increase chamber pressure. However, at higher chamber pressures, the electron temperature increased. The decrease can be caused by the increasing number of particles or species in the chamber. According to the kinetic theory of gas, the greater number of particles or species in a container leads to a higher probability of collisions. The exchange of energy and momentum in the ideal gas resulted in a constant temperature. On the other hand, the collisions in the plasma decrease the electron energy through molecular ionization, dissociation and molecular excitation.
The interaction between the electrons and the nitrogen atoms sets free more electrons at the higher pressure, thereby increasing the number of electrons in the chamber. This interaction can be seen in the dramatic increase of the electron density at 70 Pa in Figure 10. These abundant electrons create momentum transfer to generate stochastic heating at the sheath edge near the electrode or the wall of space at the sheath edge near the electrode, consequently increasing the electron energy (Kawamura, Lieberman and Lichtenberg, 2006, 2014). This energy transfer phenomenon is called the “hard wall model,” which envisions electron interactions with a potential barrier sheath, whereby electrons collide elastically with the sheath of the electric field and are reflected from a moving sheath that changes their energy (Godyak, B.nd Alexandrovich, 1992). The result is energy transfer to the electrons, which increases the electron temperature slightly as the chamber pressure increases from 60 to 70 Pa.
Further discussion is related to the role of the N2+ ion on surface reactions during treatment. This insight is vital because the ion is dominant and is reactive. In our work, the plasma treatment was utilized to modify the surface of polystyrene from hydrophobic into hydrophilic. A smaller contact angle indicates a higher surface wettability. Our work describes the plasma treatment effect by determining the reduction of the angle, Δθ. The Δθ measurements on the samples treated with various conditions of plasma can be seen in Table 3 and are plotted in Figure 11.
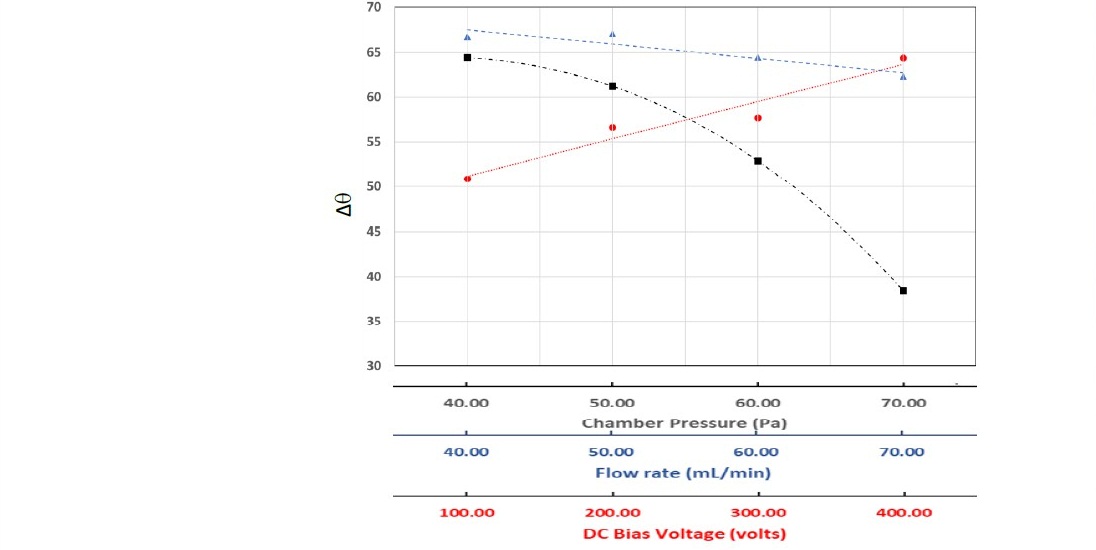
Figure 11. The difference in contact angle due to nitrogen-plasma treatment as a function of the various process parameters: DC bias voltage, gas flow rate, and chamber pressure. The contact angle of the untreated sample was 85.66°.
In general, the treatment increased the wettability (decrease of the Δθ) of the sample. It can be seen in figure 11 that the DC bias voltage and the chamber pressure have dramatic effects on the results of the treatment. The increase of the DC bias voltage increased the reduction contact angle linearly. The energetic N2+ ion can change the polystyrene's surface by ion bombardment or surface chemical reaction mechanism. As discussed earlier, both the electron density and the electron temperature decreased with the DC bias increase. The decrease reduces collisional interactions in the plasma, especially near the surface of the electrode where the sample was fixed. Although the ion's density also decreased with the DC bias increase, there can be more ion reach the surface resulted in greater surface change. Observations on the effect of the DC bias voltage on the C≡N functional group, as shown in Figure 7, suggest that the chemical reaction due to the N2+ ion on the surface is likely. The process indicates that the microstructure or morphology increases the polystyrene surface's wettability (Masruroh et al., 2018).
On the contrary, the decrease of the Te and Ne with the chamber pressure increase greatly reduced the reduction contact angle. The chamber pressure effect on the Te and Ne controlled by the ion bombardment was due to the stochastic heating process. During the energy transfer process, the energy of the N2+ species was significantly reduced. This energy reduction resulted in less surface change in the sample. At the pressure of 70 Pa, the reduction contact angle continued to decrease although the Te and Ne were increased. The increase of the Te and Ne in the plasma increase the potential barrier sheaths. It can be seen from Figure 9 that generally, the Te and Ne were increased with the increase of the flowrate of nitrogen gas. In higher flowrate, the high concentration of the N2+ species was due to the dissociation of more fresh gas. This species spent less time in the chamber, which kept in constant pressure. That is why there was only a small effect of the variation of flowrate on the plasma treatment process.
CONCLUSION
The analysis of the optical emission spectra of nitrogen plasma as a function of various process parameters reveals that the plasma character can be controlled to obtain a certain degree of wettability of a plasma-treated polystyrene surface. The reactive species N2+ are dominant in this work and undergo different interactions at the polystyrene surface depending on the DC bias voltage, the nitrogen-gas flow rate, and the chamber pressure. We also detect the formation of the polar functional C≡N group, indicating chemical surface reaction during the treatment. However, the ion physical ion bombardment was the dominant mechanism that changes the surface of the polystyrene. This study also concludes that the process parameter variation resulted in complex plasma behavior and surface interactions.
REFERENCES
Aizawa, T. 2018. Low temperature plasma nitriding of austenitic stainless steels in stainless steels and alloys. InTech Open. p. 32–50.
Choudhury, A. et al. 2010. Progress in organic coatings studies of physical and chemical properties of styrene-based plasma polymer films deposited by radiofrequency Ar/styrene glow discharge. Progress in Organic Coatings. 70: 75–82.
Godyak, V.A., B., P.R. and Alexandrovich, B.M. 1992. Measurements of electron energy distribution in low-pressure. Plasma Sources Science and Technology. 1: 36–58. Hamed, S. 2005. Spectroscopic Determination of Excitation Temperature and Electron Density in Premixed Laminar Flame. Egypt. J. Solids. 28: 349–357. Available at: http://egmrs.powweb.com/EJS/PDF/vo282/349.pdf.
Ionita, M.D. et al. 2013. Surface modification of polystyrene beads using RF atmospheric pressure plasma jet. 21st International Symposium on Plasma Chemistry.
Kawamura, E., Lieberman, M. A. and Lichtenberg, A.J. 2006. Stochastic heating in single and dual frequency capacitive discharges. Physics of Plasmas. 13.
Kawamura, E., Lieberman, M.A. and Lichtenberg, A.J. 2014. Electron heating in low pressure capacitive discharges revisited. Physics of Plasmas. 21.
Kolpaková, A., Kudrna, P. and Tichý, M. 2013. Langmuir Probe Diagnostics of DC Cylindrical Magnetron in WDS’13 Proceedings of Contributed Papers. pp. 127– 133.
Masruroh et al. 2014. Solvent effect on morphology of polystyrene coating and their role to improvement for biomolecule immobilization in application of QCM based biosensor. Applied Mechanics and Materials. 530–531: 54–57.
Masruroh et al. 2018. The effect of molecular weight on the surface wettability of polystyrene treated with nitrogen plasma. IOP Conference Series: Materials Science and Engineering 2018, pp. 1–5.
Musadiq, M. et al. 2012. Measurement of electron number density and temperature of laser-induced Silver plasma’, International Journal of Engineering & Technology. 2: 32.
Naeem, M. A. et al. 2013. Measurement of electron density and temperature of laser- induced copper plasma. Asian Journal of Chemistry. 25: 2192–2198.
Sakti, S.P. et al. 2017. Effect of UV radiation duration and molecular weight to hydrophobicity and surface roughness of polystyrene coating on QCM sensor. Jurnal Teknologi. 79: 61–67.
Shah, M. et al. 2014. Characterization of pulsed dc nitrogen plasma using optical emission and langmuir probe. Journal of Natural Sciences and Mathmatics. 53: 1–12.
Sharma, M.K. and Saikia, B.K. 2008. Discharge conditions and emission spectroscopy of N2 and N2+ active species in a variable power dc pulsed plasma used for steel nitriding. 46: 463–470.
Siow, K.S. et al. 2006. Plasma methods for the generation of chemically reactive surfaces for biomolecule immobilization and cell colonization - A review. Plasma Processes and Polymers. 3: 392–418.
Šourková, H., Primc, G. and Špatenka, P. 2018. Surface functionalization of polyethylene granules by treatment with low-pressure air plasma. Materials. 11.
Xiao D, Cheng C, Shen J, Lan Y, Xie H, Shu X, Meng Y, Li J and Chu P K. 2014. Electron density measurements of atmospheric-pressure non-thermal N2 plasma jet by Stark broadening and irradiance intensity methods. Physics of Plasmas. 21: 053510
Zhang, X. and Yadavalli, V.K. 2011. Surface immobilization of DNA aptamers for biosensing and protein interaction analysis. Biosensors & bioelectronics. 26: 3142–7.
Ziaur Rahman, M. 2018. Kinetic modelling of atmospheric pressure nitrogen plasma. American Journal of Modern Physics 7: 185.
OPEN access freely available online
Chiang Mai University Journal of Natural Sciences [ISSN 16851994]
Chiang Mai University, Thailand https://cmuj.cmu.ac.th
Masruroh1,*, Dionysius J. D. H. Santjojo1, and Ahmad Taufiq2
1 Department of Physics, Faculty of Mathematics and Natural Sciences, Brawijaya University, Malang 65145, Indonesia
2 Department of Physics, Faculty of Mathematics and Natural Sciences, Malang State University, Malang 65145, Indonesia
Corresponding author: Masruroh, E-mail: ruroh@ub.ac.id
Total Article Views
Editor: Wasu Pathom-aree,
Chiang Mai University, Thailand
Article history:
Received: August 2, 2020;
Revised: January 6, 2021;
Accepted: January 19, 2021;
Published online: March 12, 2021