 ISSN: 2822-0838 Online

Geochemical Modeling of Scale Formation due to Cooling and CO2-degassing in San Kamphaeng Geothermal Field, Northern Thailand
Sutthipong Taweelarp, Supanut Suntikoon, Thaned Rojsiraphisal, Nattapol Ploymaklam, and Schradh Saenton*Published Date : 2021-04-01
DOI : https://doi.org/10.12982/CMUJNS.2021.049
Journal Issues : Number 3, July-September 2021
Abstract Scaling in a geothermal piping system can cause serious problems by reducing flow rates and energy efficiency. In this work, scaling potential of San Kamphaeng (SK) geothermal energy, Northern Thailand was assessed based on geochemical model simulation using physical and chemical properties of hot spring water. Water samples from surface seepage and groundwater wells, analyzed by ICP-OES and ion chromatograph methods for chemical constituents, were dominated by Ca-HCO3 facies having partial pressure of carbon dioxide of 10–2.67 to 10–1.75 atm which is higher than ambient atmospheric CO2 content. Surface seepage samples have lower temperature (60.9°C) than deep groundwater (83.1°C) and reservoir (127.1°C, based on silica geothermometry). Geochemical characteristics of the hot spring water indicated significant difference in chemical properties between surface seepage and deep, hot groundwater as a result of mineral precipitation along the flow paths and inside well casing. Scales were mainly composed of carbonates, silica, Fe-Mn oxides. Geochemical simulations based on multiple chemical reaction equilibria in PHREEQC were performed to confirm scale formation from cooling and CO2-degassing processes. Simulation results showed total cumulative scaling potential (maximum possible precipitation) from 267-m deep well was estimated as 582.2 mg/L, but only 50.4% of scaling potential actually took place at SK hot springs. In addition, maximum possible carbon dioxide outflux to atmosphere from degassing process in SK geothermal field, estimated from the degassing process, was 6,960 ton/year indicating a continuous source of greenhouse gas that may contribute to climate change.
Keywords: Degassing, Geochemical modeling, PHREEQC, San Kamphaeng Hot Springs, Scaling
Funding: This research was partially supported by Chiang Mai University; the Centre of Excellence in Mathematics; the Commission on Higher Education, Thailand, and Science Achievement Scholarship of Thailand (SAST); Thailand Science Research and Innovation (TSRI, formerly the Thailand Research Fund, TRF) (Grant number RDG6230005).
Citation: Taweelarp, S., Suntikoon, S., Thaned Rojsiraphisal,T., Ploymaklam,N., and Saenton, S. 2021. Geochemical modeling of scale formation due to cooling and CO2-degassing in San Kamphaeng geothermal field, Northern Thailand. CMUJ. Nat. Sci. 20(3): e2021049.
INTRODUCTION
Thailand’s hot springs, have long been studied in detail more than 60 years for their potential use as alternative energy resources. Some hot springs have been utilized for a number of purposes such as agricultural product drying, cold storage industry, recreation and tourism (Raksaskulwong, 2008). The choices of geothermal application, either directly or through electricity generation, depend on a number of factors such as geochemical characteristics of fluids, surface temperature, seepage rate, reservoir size and geologic structures etc. Most geothermal studies in Thailand have focused on the classification of hot spring potential based on their chemical characteristics, enthalpies and flow rates (Ramingwong et al., 1979; Ratanasthien et al., 1988; Raksaskulwong, 2003; Singharajwarapan et al., 2012; Wood et al., 2018). Although most geothermal sites in Thailand have relatively low potential due to either low temperature or flow rate or both, some high potential sites, such as Fang hot springs, have been developed for electricity generation (e.g., Wood et al., 2018). San Kamphaeng (SK) hot springs, on the other hand, have relatively low surface temperature (~40-50 °C) but, due to its high seepage rate (~70-80 L/s), it has been famously used for recreational purposes. However, one major setback of geothermal utilization including San Kamphaeng and Fang hot springs is scaling problem of the piping system that imposes high operational and maintenance cost. Yet, the scaling problem of SK and Fang sites has not been fully investigated in detail, especially in terms of geochemical modeling based on water quality.
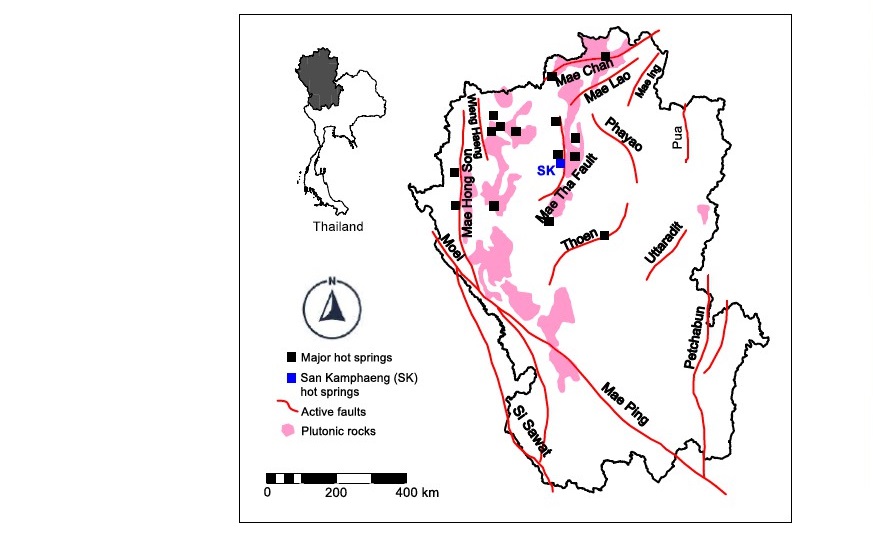
Figure 1. Locations of San Kamphaeng (SK) and other major hot springs in association with approximate active faults and plutonic rocks in Northern Thailand (modified from Singharajwarapan et al., 2012; Department of Mineral Resources, 2019).
Scaling is a result of mineral precipitation from geothermal fluids that can cause a reduction in production capacity (Wanakasem and Takabut, 1986). This problem is commonly encountered at geothermal fields around the world. Scaling occurs when physical and chemical characteristics of the fluids, which is initially in equilibrium with reservoir rocks, change as flowing upward the fractures or through well and some minerals precipitate within the wellbore and surface equipment. Carbonates (such as calcite) and quartz minerals are common in scales (Boch et al., 2017). The understanding of scale formation could provide some pre-treatment solution to modify geothermal extraction system or chemistry of the fluids in order to extend equipment longevity. Several modeling studies have been conducted to investigate the causes and extent of scaling problem in geothermal field sites (Arnórsson, 1989; García et al., 2006; Bozau et al., 2015). However, different sites have dissimilar causes of scale formation due to the large variation in temperature, pressure and, especially, fluid chemistry. Some sites encountered more silica than carbonates whereas the others encounter iron oxides mixed with carbonates, etc. Scale formation is commonly caused by CO2 degassing and cooling of hot spring water.
San Kamphaeng geothermal site covers an area of approximately 0.15 km2, is one of the most famous hot springs in Northern Thailand (see Figure 1). It is located in the San Kamphaeng district in Chiang Mai province and has long been utilized in various activities such as in agriculture and especially tourism business. Its geothermal system is associated with plutonic rocks and Mae Tha fault systems (Raksaskulwong, 2008). Average surface temperature was reported as 42°C with maximum surface temperature of 98°C (JICA, 1984). Deep well exploration found fractures at depth of 300-900 m below ground surface yielding a flowrate of approximately 40 m3/h and temperature of 125°C (Ramingwong et al., 2000). The scaling problems in SK hot springs have been persistently and repeatedly encountered in wellbores and pipelines (Figure 2). However, there has not been a fundamental study on how scales are formed and to what extent they can precipitate in a quantitative manner using and geochemical modeling approach. It is therefore the main purpose of this work to conduct a geochemical characterization and geochemical modeling scale formation due to CO2 degassing and cooling of spring water in order to asses scaling potential of this site and suggest the mitigation measures.
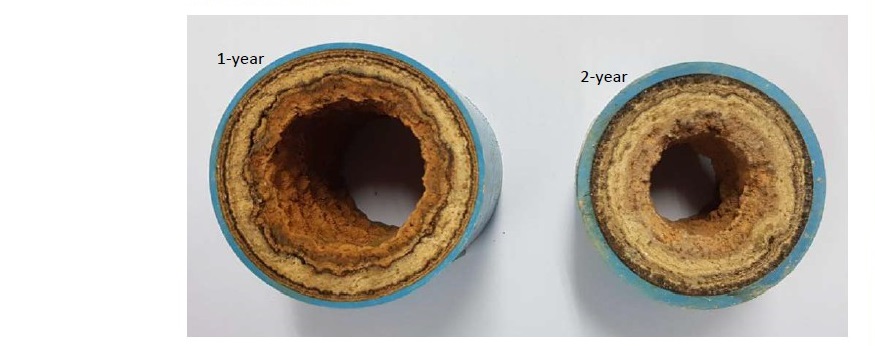
Figure 2. Examples of scale developed inside a 2-in diameter pipe from SK hot springs after 1 and 2 years of operation.
MATERIALS AND METHODS
Water sampling and chemical analyses
Water samples from 7 natural seepages and 3 available geothermal wells (at depths of 55, 98 and 267 m below ground surface) were collected during Mar-Apr, 2019). Temperature, electrical conductivity, pH, oxidation-reduction potential (ORP or Eh), and alkalinity were measured on site. For cations, 500-mL polyethylene bottles were used to collect water sample with an addition of 1.0 mL concentrated HNO3 acid. For anions, 250 mL of water was collected using polyethylene bottle without acid fixation. The samples were immediately refrigerated and shipped to Environmental Research and Training Center (ERTC) analytical laboratory in Pathum Thani, Thailand for determination of cations (Ca, Mg, Na, K, Li, Si (as SiO2), Fe and Mn) using ICP-OES technique and anions (SO4, HCO3 and Cl) using ion chromatography technique. Internal consistency of aqueous solution (i.e., electroneutrality of the solution) can be assessed by calculating percent error (Δ%) as shown in Eq. (1),

where Σ Anion and Σ Cation were total cationic and anionic concentrations in milliequivalent per liter (meq/L).
X-ray diffraction analyses of scales
Scale samples were obtained from several abandoned 2-in dia. inner casing pipes (i.e., from a 260s-m deep wells) after 6, 12, 18 and 24 months of operation as shown in Figure 2. The crushed scales were semi-quantitatively analyzed for their mineralogical compositions using X-ray Diffraction (XRD) technique. Types of precipitated minerals from hot spring water were subsequently used to confirm the geochemical model simulation results.
Geochemical model simulation of scale formation using PHREEQC
Scale formation are typically caused by either cooling and/or CO2-degassing of hot spring water. Both processes significantly affect thermodynamic equilibrium of mineral precipitation reaction in aqueous solution and will be simulated using PHREEQC computer program (Parkhurst and Appelo, 2013). PHREEQC is a public-domain geochemical modeling software developed by the United States Geological Survey (USGS). It has been used for simulating a wide range of geochemical reactions and processes in natural waters under several geochemical scenarios such as chemical speciation, saturation indices of minerals (precipitation or dissolution), mixing of solutions, reaction path modelling, inverse modeling, etc. Calculations are based on thermodynamic databases which include a wide range of data for mineral phases and compounds. The program utilized modified Newton-Raphson method to solve system of non-linear equations derived from hundreds to thousands of chemical equilibrium equations.
Specifically, PHREEQC program will calculate saturation indices (SI) of possible solid phases (i.e., precipitated minerals) and assess scaling potential based on chemical composition and physicochemical properties of hot spring water. If SI > 0, the aqueous solution is said to be supersaturated and the mineral will likely precipitate. PHREEQC will iteratively adjust the saturation index to zero (i.e., equilibrium) by triggering mineral precipitation reaction. The saturation index is defined as
![]()
where K is equilibrium constant or solubility product which is dependent of temperature and pressure as shown in Eqs. (3.1) - (3.2).

where T1 refers to temperature at standard state (25°C), T2 is a temperature of concern, ΔH° and ΔV° are enthalpy of the reaction and molar volume of aqueous solution at standard state, and R is gas constant (8.314 J mol-1 K-1). It should be noted that PHREEQC, if available, may adopt a verified empirical equation (typically in the form of polynomial and logarithmic functions) to estimate equilibrium constant at other conditions. The ion-activity product of mineral “i” or IAPi can be calculated from law of mass action

where cm,i is a stoichiometric coefficient of master (aqueous or gas) species m in mineral species i, Maq is the total number of master species. The term ai or am refers to activity of species which is related to chemical concentration [i] or gaseous pressure (Pi) as
ai = γi [i] or ai = γi [Pi]. The parameter γi is activity coefficient (or, more precisely, fugacity coefficient for gaseous species). For aqueous solution, activity coefficient can be calculated from Davies equation (most suitable for geochemical system) as shown in Eq. (5).

where A and zi are constant and an ionic charge of species i, and μ is ionic strength of the aqueous solution which is defined as

The chemical composition and physicochemical properties of water sample from 267-m deep well will used as initial fluid composition. Mineral precipitation (or scale formation) will then be simulated based on cooling and CO2-degassing processes since these two processes will alter physical and chemical properties of the solution along the flow path.
RESULTS
Chemical properties of hot spring water
Table 1 shows field measurement data of SK hot spring water samples. The hot spring seepage has surface temperature in the range of 45.1-79.5°C which is considered as medium to high potential geothermal system. All water samples appear colorless, clear and slightly basic with pH range of 7.51-8.49. All of surface seepage samples have higher (positive) oxidation-reduction potential (ORP or Eh) in the range of 5 to 72 mV whereas all sample from groundwater wells have negative ORP implying low oxygen content in deep water. Surface seepage samples have lower electrical conductivity (511-792 μS/cm) than deeper hot groundwater (1,328-1,411 μS/cm) (Table 2). The alkalinity of all samples is in the same order of magnitude with the range of 182-346 mg/L as CaCO3.
Table 1. Physicochemical properties of hot springs water.
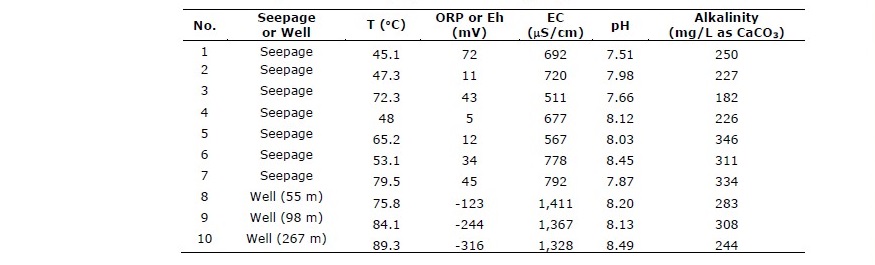
Table 2 shows the results of chemical analyses for major cations (Ca, Mg, Na, K), major anions (HCO3, SO4, Cl) and some minor elements (Li, SiO2, Fe, Mn). The total dissolved solids (TDS) for surface seepage waters (No. 1-7; 493-877 mg/L) are all lower than the deep, hot groundwater samples (No. 8-10; 1,342-1,668 mg/L) because some minerals may have already precipitated along the flow paths before discharging at the ground surface. All other cationic species in surface seepage are of lower concentration than those of deeper groundwater samples confirming mineral precipitation process taking place while ascending the surface. Iron and manganese contents are higher than Thailand’s regulated standards and should be treated prior to consumption.
Table 2. Chemical compositions of hot springs water.
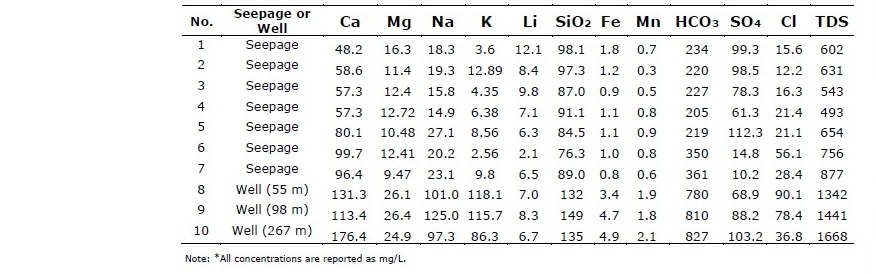
Based on chemical compositions shown in Table 2, percent error (Δ%) of chemical analysis for each of the samples was calculated using Eq. (1). In, Table 3, the errors of chemical analyses are all in acceptable range (~5% or less) which ensures validity for further geochemical modeling and interpretation. Hydrochemical facies for all samples are Ca-HCO3 indicating carbonate-type hot spring water and, as a result, precipitation of carbonate minerals are expected to dominate in scales. Figure 3 illustrates piper diagram for all samples showing the chemical evolution of surface seepage from deep, hot groundwater as a result of mineral precipitation along the flow path to surface and inside well casing.
Table 3. Percent error (Δ%) of chemical analyses, hydrochemical facies and reservoir temperature.
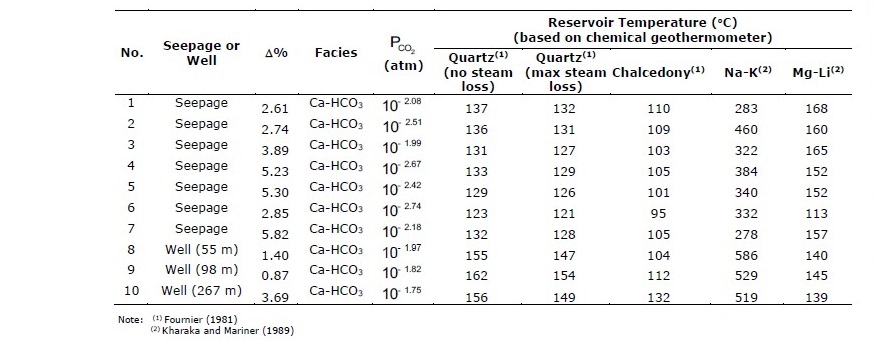
Table 3 shows equilibrated partial pressure of carbon dioxide ( PCO2 ) in hot spring water samples, calculated from carbonate equilibria and thermodynamic equations (Drever, 1997). All samples show much higher dissolved CO2(g) content than atmospheric carbon dioxide. Reservoir temperatures were calculated using chemical geothermometers, based on equations derived by Fournier (1981) and Kharaka and Mariner (1989) as shown in Table 3. Silica geothermometers show the range of 95-162°C with an average reservoir temperature of 127.1°C whereas Na-K geothermometer gives significantly larger average reservoir temperature of 403.3°C
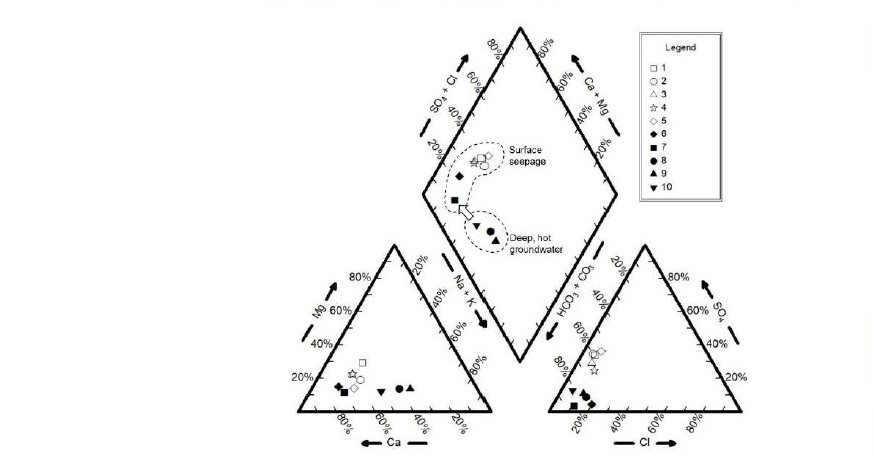
Figure 3. Piper diagram showing slight change in geochemical facies from deep, hot groundwater to surface seepage.
Mineralogical contents of scales
Scale samples were crushed and analyzed using X-ray Diffraction (XRD) technique and their mineralogical contents were mainly consisted of calcite (CaCO3), silica (SiO2), dolomite (CaMg(CO3)2), goethite (FeOOH), hematite (Fe2O3) and some trace amount of pyrolusite (MnO2). These minerals will subsequently be used to verify geochemical modeling of scale formation using PHREEQC. The scale-containing core was examined more in detail and it was found that carbonates will precipitate first forming the outer rings of well casing scales while oxides of iron and manganese precipitate later (inner rings). Silica precipitates simultaneously with both carbonates and Fe-Mn oxides.
Geochemical modeling of scale formation due to cooling and CO2- degassing
The modeling steps for scale formation simulation using PHREEQC is summarized in Figure 4. The simulation began with (1) computing all possible chemical equilibria based on aqueous species, (2) calculating carbonate equilibria and determining equilibrated CO2 partial pressure, (3) evaluating potential scaling minerals having positive saturation indices (i.e., supersaturated with respect to aqueous solution), and (4) re-calculating chemical equilibria by allowing for possible solid phases to precipitate according to degassing and cooling processes. Processes that were not included in the simulations are kinetics of precipitation, corrosion reactions in piping systems, organic carbon and thermophilic microbial reactions in hot spring water, and the effect other gases such as CH4, N2 and H2S are also assumed negligible.
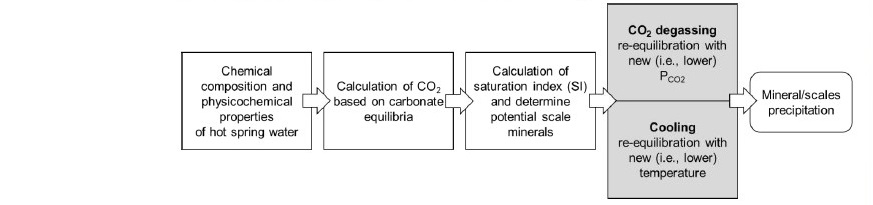
Figure 4. Steps in PHREEQC simulation of scale formation based on simultaneous CO2-degassing and cooling processes.
An aqueous sample #10 from deep well, at a depth of 267 m and a total of well head or fluid pressure of ~29 barg, was used as an initial fluid. It should be noted that some minerals might have already precipitated prior to reaching this depth. PHREEQC simulation showed that possible scaling minerals (SI > 0) were consisted of calcite, aragonite, dolomite, goethite, ferrihydrite, pyrolusite, siderite, rhodochrosite, chalcedony and quartz. However, as the simulation proceeded, only calcite, dolomite, quartz, goethite and pyrolusite were predicted to precipitate. The major precipitated minerals were calcite, dolomite and quartz whereas goethite and pyrolusite precipitated at smaller quantity as shown in Figure 5. Quartz did not significantly precipitate until the temperature dropped below 65°C whereas other minerals precipitated immediately as pressure and temperature dropped. Maximum possible precipitation (or maximum cumulative scaling potential) for each of these minerals are listed in Table 4. Total cumulative scaling potential of 267-m deep hot spring water was estimated to be at maximum possible of 582.2 mg/L.
Scale thickness (d) inside a 2-in diameter casing of a 267-m deep production well was calculated and compared with field observations. Such calculation assumed an average extraction rate of ~1 m3/h being operated for 6 hours a day. Figure 6 showed scale thickness data as a function of time compared to model calculation at various actual precipitation rates (i.e., 30, 40, 50.4 and 58% of maximum scaling potential). Non-linear least-square regression analysis indicated the best match occurred when 50.4% precipitation rate was used. This indicates only ~50% of scaling potential actually precipitates. This could be attributed to inequilbrium or rate-limited precipitation and/or complete degassing CO2 did not actually take place.
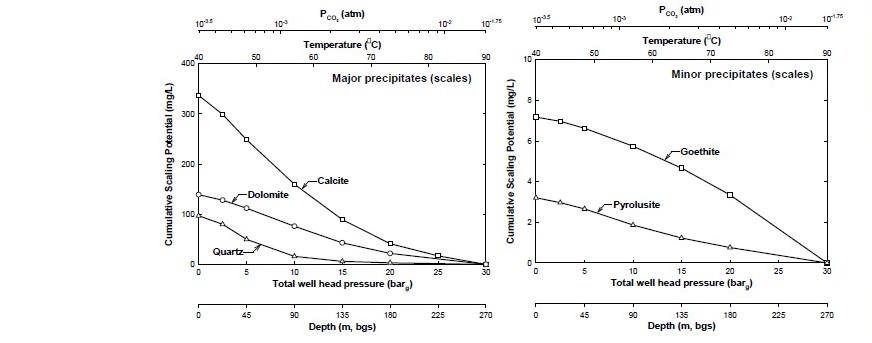
Figure 5. Geochemical simulation results showing cumulative scaling potential of major and minor minerals as a result of cooling and CO2-degassing processes based on hot spring water from 267-m deep well.
Table 4. Maximum scaling potential from cooling and CO2-degassing processes as hot spring water ascends the surface from 267-m deep well.
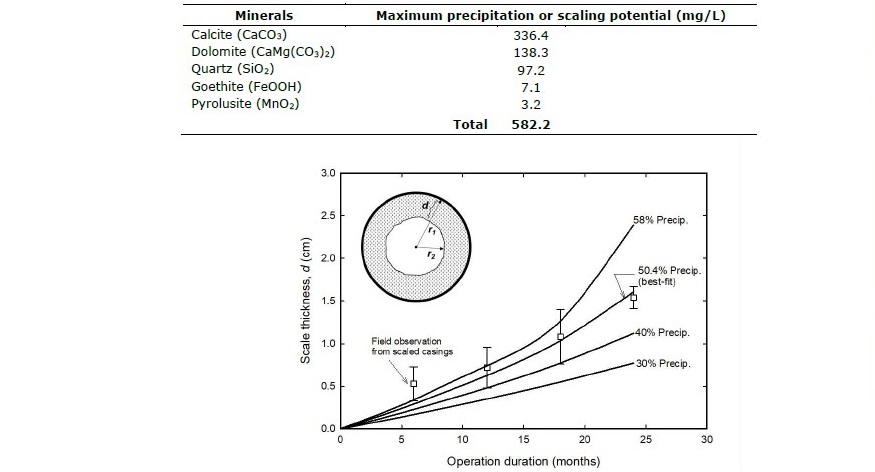
Figure 6. Scale thickness (d) increased with time of operation: Field observation data vs. simulation results by assuming 30, 40, 50.4 (best-fit) and 58% precipitation of (maximum) scaling potential.
DISCUSSION
San Kamphaeng hot spring water was characterized by Ca-HCO3 hydrochemical facies with a slightly basic pH range of 7.51-8.45 and moderate alkalinity of 182-346 mg/L as CaCO3. Such calcium-dominated conditions resulted in a potential precipitation of carbonate minerals. Deep groundwater samples showed higher EC and TDS which indicated tendency to precipitate as they flow upward to ground surface. This observation was confirmed by the lower ranges of EC and TDS observed in surface seepage samples compared to deep groundwater because the loss of ions in aqueous solution was only due to precipitation.
Surface seepage samples had positive ORP whereas all deep groundwater samples were more reduced with negative values of ORP which implied the influence of atmospheric oxygen dissolution as hot spring ascended ground surface. This could result in a precipitation of Fe-Mn oxides along the flow path or well casing as groundwater due to the oxidation of Fe(II) and Mn(II) ions. The precipitation of Fe-Mn oxide minerals was confirmed by in XRD analysis scales and the decrease in Fe and Mn concentration in surface seepage water. Drever (1997) suggested that, at higher ORP, most of the mobile Fe2+ and Mn2+ ions in groundwater can be oxidized forming solid precipitates such as Mn(IV) and Fe(III) solids such as MnO2, FeOOH, Fe(OH)3 and Fe2O3.
With high CO2 content in both surface seepage and deep groundwater, degassing of CO2 to atmosphere was expected. All hot springs samples had 1-2 orders of magnitude higher CO2 content (10-2.74- 10-1.75 atm) than ambient atmospheric CO2 (PCO » 10- 3.5 atm) indicating that CO2-degassing could spontaneously take place causing a higher pH of the solution and, as a result, carbonate minerals would likely precipitate. This observation was confirmed by a decrease in calcium, magnesium and bicarbonate ion contents in surface seepage compared to deep groundwater.
Reservoir temperature were calculated from chemical geothermometers suggested by Fournier (1981) and Kharaka and Mariner (1989). Silica and Mg-Li geothermometers gave similar ranges while Na-K geothermometer yielded significantly higher reservoir temperature. Ramingwong et al. (1979), Ratanastien et al. (1988) and Ramingwong et al. (2000) suggested that silica geothermometer was most suitable in predicting reservoir temperature because SK hot spring was closely related to the presence of plutonic (mainly, silicates) rocks. The surface seepage temperature was approximately 20°C lower than groundwater at 260 m deep. Therefore, the cooling of hot water while ascending upward was expected and, as a result, several minerals with exothermic precipitation (enthalpy of precipitation DH° < 0) could precipitate. The cooling of hot groundwater could be due to natural convection and mixing of recharge water. Taweelarp (2019) used calibrated, regional groundwater flow model to estimate natural groundwater recharge from precipitation of the San Kamphaeng area and found that 10-year average recharge was approximately 94.7 mm/y (approximately 5% of yearly precipitation of Chiang Mai basin). This amount of recharge did not only provide supply for geothermal circulation but, at the same time, it also cooled down shallow hot spring and caused more precipitation from aqueous solution to occur underground prior to ascending surface as a seepage.
Although the hydrochemical facies of surface seepage and deep groundwater were similar (Ca-HCO3 type; Table 3), the use of Piper diagram revealed that there was a slight shift in chemical characteristics as shown in Figure 3 as a result of mineral precipitation. Such scale formation from cooling and CO2-degassing processes was further investigated quantitatively using geochemical model, PHREEQC. The maximum possible precipitation or scaling potential was calculated to be 582.2 mg/L as shown in Figure 5 and Table 4. This calculation was based on the assumptions where complete CO2-degassing commenced and mineral-water equilibria were attained at all times. However, when scale thickness (d) calculation was simulated and compared with actual scales from well casing, only 50.4% of scaling potential actually took place. This finding implied that, as aqueous solution ascended to surface seepage, mineral precipitation reaction was rate-limited and CO2-degassing was not completed (i.e., inequilibrium condition) as can be seen from in surface seepage water samples No. 1-7 which was still greater than atmospheric CO2 content of 10–3.5 atm. This finding with regards to rate-limited or inequilibrium condition agreed with the studies by Arnórsson (1989) and Boch et al. (2017). Nevertheless, if complete CO2-degassing process took place, carbon dioxide outflux to atmosphere of San Kamphaeng geothermal site, calculated from degassing process, would be as high as 6,960 ton/year based on a total seepage rate of ~40 m3/h. The predicted SK hot spring’s CO2 emission rate was comparably small accounting for approximately 0.01% of the total CO2 emission in Thailand (Achiraya et al., 2019).
CONCLUSION
Surface seepages and hot groundwaters of San Kamphaeng geothermal site were collected and analyzed for their physical properties and chemical constituents. All samples showed Ca-HCO3 hydrochemical facies with high CO2 partial pressure and dissolve ions. Water chemistry from 267-m deep well was used to evaluate scaling potential where the maximum mineral precipitation was 582.2 mg/L due to cooling and CO2-degassing processes. Calcite, dolomite and quartz were among major precipitates while Fe-Mn oxides were minor. Time-dependent scale thickness was modeled and compared to field observation and it was found that only 50.4% of potential scaling minerals actually precipitated suggesting incomplete degassing process and rate-limited precipitation. The scaling formation typically results in frequent casing and piping replacement which is costly. It is recommended that preventive measures must be implemented to mitigate scale formation such as slowing down the depressurizing/degassing process, re-introducing CO2 or adding pH reducing agents. Reinjection of low temperature surface water into the geothermal system for increasing a recharge, is also not advisable without scaling prevention strategy.
ACKNOWLEDGEMENTS
The authors would also like to thank the Environmental Research and Training Center (ERTC), Department of Environmental Quality Promotion (DEQP) for a support of chemical analyses.
REFERENCES
Achiraya, C., Puttipong, C., and Bundit, L. 2019. Assessment of Thailand’s Energy Policy on CO2 Emissions: Implication of National Energy Plans to Achieve NDC Target, International Energy Journal. 19: 47-60.
Arnórsson, S. 1989. Deposition of calcium carbonate minerals from geothermal waters: Theoretical considerations. Geothermics, 18:33-39.
Boch, R., Leis, A., Haslinger, E., Goldbrunner, J.E., Mittermayr, F., Fröschl, H. and Dietzel, M. 2017. Scale-fragment formation impairing geothermal energy production: interacting H2S corrosion and CaCO3 crystal growth. Geothermal Energy. 5.
Bozau, E., Häußler, S., van Berk, W., 2015. Hydrogeochemical modelling of corrosion effects and barite scaling in deep geothermal wells of the North German Basin using PHREEQC and PHAST. Geothermics .53: 540-547.
Department of Mineral Resources. 2019. Active faults distribution map in Thailand. Drever, J.I., 19 97. The Geochemistry of Natural Water: Surface and Groundwater Environments. 3rd Edition, Prentice Hall, New Jersey.
Fournier, R.O., 1981, Application of water geochemistry to geothermal exploration and reservoir engineering. In L. Rybach and L.J.P. Muffler, eds., Geothermal Systems, Principles and Case Histories, Wiley, New York. p. 109-143.
García, A.V., Thomsen, K., and Stenby, E.H., 2006. Prediction of mineral scale formation in geothermal and oilfield operations using the Extended UNIQUAC model: Part II. Carbonate-scaling minerals. Geothermics, 35: 239-284.
JICA (Japan International Cooperation Agency), 1984. The pre-feasibility study: The San Kamphaeng Geothermal Development Project for the Kingdom of Thailand. Technical Report.
Kharaka, Y.K. and Mariner, R.H. 1989, Chemical geothermometers and their application to formation waters from sedimentary basins. In N.D Naeser and T.H. McCulloh, eds., Thermal History of Sedimentary Basins, Springer-Verlag, New York. p. 99- 117.
Parkhurst, D.L. and Appelo, C.A.J., 2013, Description of input and examples for PHREEQC version 3–A computer program for speciation, batch-reaction, one- dimensional transport, and inverse geochemical calculations, volume book 6 series Techniques and Methods.
Raksaskulwong, M. 2003. Geothermal distribution and development in southern Thailand, in Exploration and Exploitation of geothermal resources as dispersive type energy: The 5th Asia Geothermal Symposium, Kuala Lumpur, Malaysia, 25- 29 March 2003.
Raksaskulwong, M. 2008. Thailand geothermal energy: Development history and current status. In, Proceedings of the 8th Asian Geothermal Symposium, December 9-10. 2008.
Ramingwong, T., Lertsrimongkol, S., Asnachinda, P., and Praserdvigai, S., 2000. Update on Thailand geothermal research and development. In, Proceedings of the World Geothermal Congress 2000, Kyushu-Tohoku, Japan, May 28-June 10. 2000.
Ramingwong, T., Ratanasthien, B., Sertsrivanit, S., and Thienprasert, A., 1979, Geothermal energy resources in Northern Thailand: Chiang Mai University, Technical paper. 1: 74.
Ratanasthien, B., Ramingwong, T., Tunsakul, L., and Bhotirungsiyakorn, C., 1988, Origin of thermal fluids in Fang and San Kamphaeng geothermal systems, Thailand as indicated by isotopic hydrogeology, Journal of Geological Society of Thailand. 9: 97-107.
Singharajwarapan, F.S., Wood, S.H., Prommakorn, N., and Owens, L. 2012. Northern Thailand Geothermal Resources and Development: A Review and 2012 Update. Geothermal Resources Council, GRC Transactions. 36: 787-791.
Taweelarp, S. 2019, Assessment of groundwater resource potential of the unconsolidated aquifers in the Chiang Mai basin using groundwater flow model, PhD dissertation, Chiang Mai University.
Wanakasem, S. and Takabut K. 1986. Present status of Fang geothermal project, Thailand. Geothermics, 15: 583-587.
Wood, S.H., Kaewsomwang, P. and Singharajwarapan, F.S. 2018. Geologic framework of the Fang Hot Springs area with emphasis on structure, hydrology, and geothermal development, Chiang Mai Province, northern Thailand. Geothermal Energy. 6.
OPEN access freely available online
Chiang Mai University Journal of Natural Sciences [ISSN 16851994]
Chiang Mai University, Thailand https://cmuj.cmu.ac.th
Sutthipong Taweelarp1, Supanut Suntikoon2, Thaned Rojsiraphisal3,4,5, Nattapol Ploymaklam3,4,5, and Schradh Saenton1,*
1 Department of Geological Sciences, Faculty of Science, Chiang Mai University, Chiang Mai, Thailand, 50200
2 Department of Geosciences, University of Montana, Missoula, MT, United States, 59812
3 Department of Mathematics, Faculty of Science, Chiang Mai University, Chiang Mai, Thailand, 50200
4 Advanced Research Center for Computational Simulation, Chiang Mai University, Chiang Mai, Thailand, 50200
5 Centre of Excellence in Mathematics, CHE, Si Ayutthaya Rd., Bangkok, Thailand, 10400
Corresponding author: Schradh Saenton, E-mail: schradh.saenton@cmu.ac.th
Total Article Views
Editor: Wasu Pathom-aree,
Chiang Mai University, Thailand
Article history:
Received: May 25, 2020;
Revised: December 1, 2020;
Accepted: December 3, 2020;
Published online: March 5, 2021