 ISSN: 2822-0838 Online

Predictive Model for the Total Daily COVID-19 Cases with Herd Immunity Policy
Rapin Sunthornwat* and Yupaporn AreepongPublished Date : 2020-12-17
DOI : https://doi.org/10.12982/CMUJNS.2021.016
Journal Issues : Number 1, January-March 2021
Abstract The spread of coronavirus disease 2019 (COVID-19) has caused a pandemic, and policies for fighting COVID-19 have been enacted by the governments of most countries. The herd immunity policy is the policy that Sweden is using to fight COVID-19. The purpose of this research is to estimate the number of total COVID-19 cases in Sweden in which herd immunity is being encouraged. A logistic model was selected as the predictive model for estimating the number of COVID-19 cases in Sweden and the other Nordic countries in which the strict lockdown policy has been instigated, and a comparative study between them was conducted and validation of the predictive models was confirmed. The findings show that the herd immunity policy is applicable and acceptable but flattening the predictive curve by applying the herd immunity policy is slightly slower than when applying the strict lockdown policy.
Keywords: Coronavirus disease 2019, Herd Immunity, Logistic Model, Least-squares Method
Citation: Sunthornwat, R., and Areepong, Y. 2021. Predictive model for the total daily COVID-19 cases with herd immunity policy. CMUJ. Nat. Sci. 20(1): e2021016
INTRODUCTION
Coronavirus 2019 is an RNA virus with a strong envelope protein and its structure resembles a crown shape that comprises three proteins: spike, nucleocapsid, and membrane. The spike protein matches a receptor on the cell surface of human lung tissue (Cui et al., 2019; Wu et al., 2020), and coronavirus 2019 is incorporated via endocytosis (Marsh and McMahon, 1999). When a person contracts coronavirus disease 2019 (COVID-19), inspiration can fail due to pneumonitis, which is the main cause of death from COVID-19. The three main methods for fighting COVID-19 consist of vaccination, herd immunity, and natural protection from mutation.
Coronavirus 2019 has been spreading in the Nordic countries in northern Europe since around the end of January 2020. Moreover, the spread of coronavirus 2019 has been wide spread throughout the world, especially in Sweden with its epicenter in Stockholm.One of the important factors for different spreading rates in the Nordic countries is each government’s policy for administering and controlling the spread (Baniamin et al., 2020). While Sweden’s government has adopted the herd immunity policy, the other Nordic countries (Norway, Finland, and Denmark) have applied the strict lockdown policy consisting of prohibition of international transportation
(especially air transportation), social and physical distancing, working from home, avoiding assemblies of large numbers of people, washing hands with alcohol gel or soap, wearing a mask in the community, etc.
As mentioned, Sweden has adopted the herd immunity policy during the COVID-19 outbreak (Holly, 2020; Strang, 2020), which is different from the strict lockdown policy. For the herd immunity process to proceed, infected people are estimated at 60%, with 30% of them having recovered. Subsequently, as the number of people who have recovered increases, other people in the community become protected. The situation of herd immunity policy in Sweden is as follows. Swedish people regularly enjoy life but they have to be responsible for themselves and society. Schools and academic institutes are still open, as are clubs, bars, and businesses. Some rules have been enacted; for example, an assembly of more than 50 people is not allowed and social distancing is enforced among people at tables in restaurants.
The population size of Sweden is around 10 million people. New COVID-19 cases in Sweden are only slightly increasing like many countries in Europe, such as Italy, Spain, Great Britain, etc. Sweden’s government does not prevent people from becoming infected with COVID-19 widely, there by encouraging herd immunity.
The focus of this study is on the herd immunity policy adopted by the government of Sweden for protecting public health and preventing the spread of COVID-19 and comparing their outcomes with the other Nordic countries that have applied the strict lockdown policy.
Obviously, knowing the number of cumulative COVID-19 cases is key for developing policies to fight the COVID-19 outbreak. Remarkably, the number of cumulative COVID-19 cases forms an S-curve. Because a logistic model does the same, it can be used to represent the cumulative COVID-19 cases. Predictive models with logistic curves have been studied by many researchers in several fields. Ji (2013) applied a logistic model for forecasting the growth of durable consumer goods in China. Eberhardt and Breiwick (2012) used logistic curves for describing the population growth of sizable numbers of birds and mammals. Anastasia et al. (2017) analyzed the epidemiological dynamics of World Health Organization data with logistic functions. Valentina (2015) analyzed and forecasted greenhouse diffusion from Albanian agriculture based on logistic curves for decision-making on maximum profit and minimum loss. Tsoularis and Wallace (2002) developed a model based on a logistic function for population dynamics and biological growth; analysis of some properties and proof of the curve fitting of logistic growth was also presented.
The purpose of this research was to study the predictive model established via logistic modeling to estimate the daily number of total COVID-19 cases in Sweden, in which the herd immunity policy for fighting COVID-19 was adopted, and compare the results with the strict lockdown (flattening the curve) policy adopted by the other
Nordic countries (Norway, Finland, and Denmark). Validation of the predictive model is demonstrated via statistical measurements. The mathematical and statistical background as the material and methods for this research are also covered herein.
MATERIALS AND METHODS
Data collection
Data on the daily COVID-19 cases in the Nordic countries (Sweden, Norway, Finland, and Denmark) was gathered as secondary data from the Worldometer (2020) website. The time period of data is from February 15, 2020, (t = 0) to May 11, 2020 (t = 86) . The collected data was intact without any missing data. For the predictive model, the independent variable was time (days) and the dependent variable was the daily number of COVID-19 cases in the Nordic countries. In addition, the data analysis was carried out by using MATLAB programming (Kharab and Guenther, 2012).
The logistic model
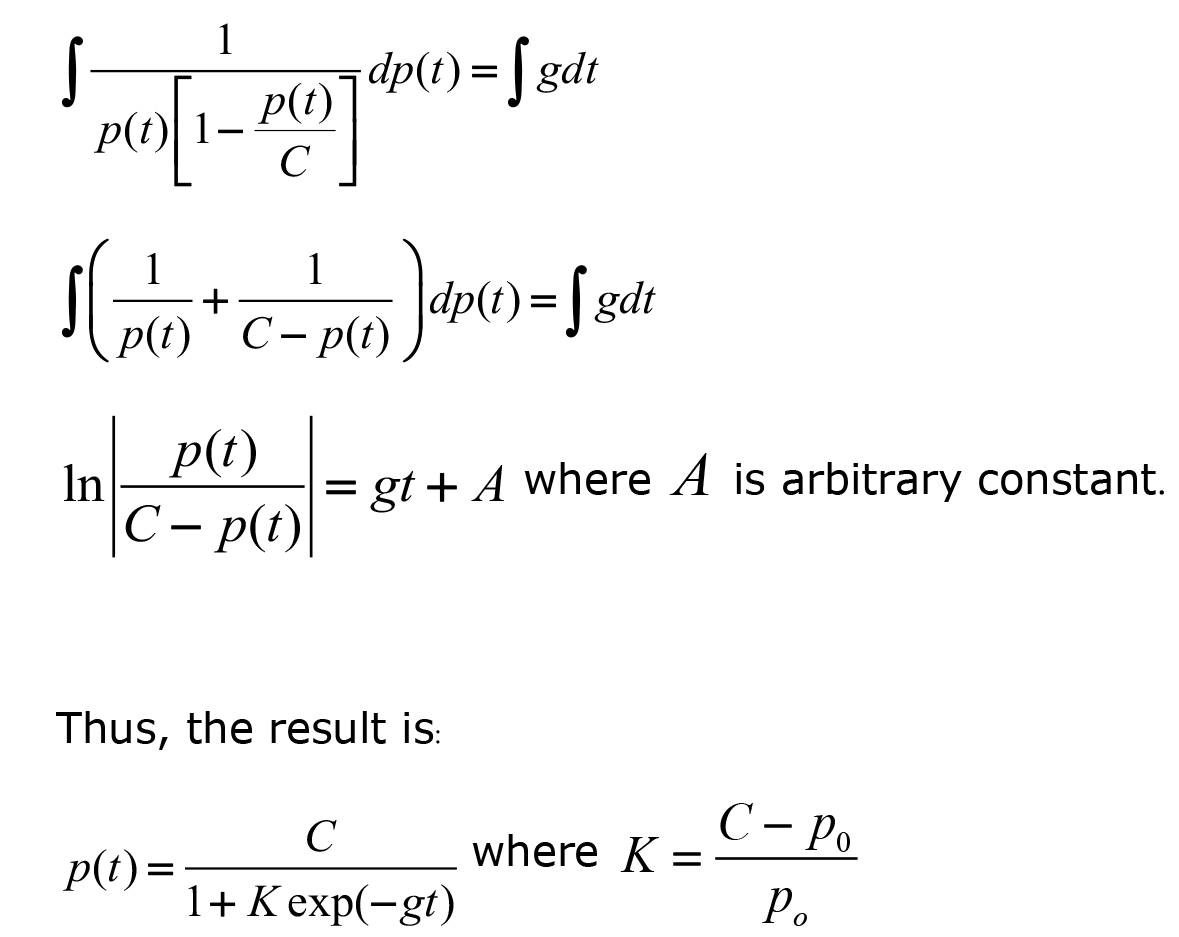
The assumption for this research is that a logistic model can be used as the predictive model for describing the daily COVID-19 cases in the Nordic countries. Thus, the population size of daily COVID-19 cases in the Nordic countries is estimated by the logistics differential equation, which is solved as follows:
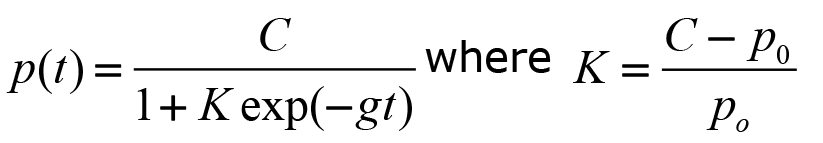
Let p(t) be the population size of daily COVID-19 cases in the Nordic countries at any time t ≥ 0. The logistic model for which the solution of the logistic differential equation was first presented by Verhulst (Verhulst, 1838) is
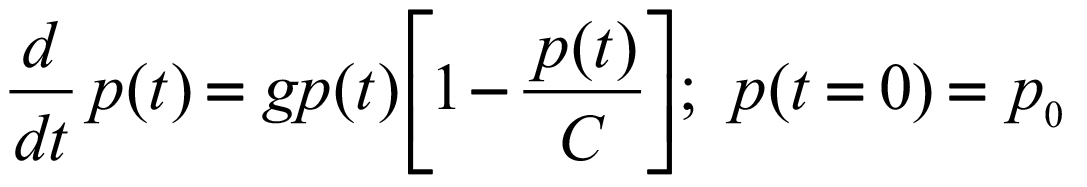
with the initial population size of daily COVID-19 cases p0 > 0, growth parameter g > 0, and carrying capacity parameter C.
The solution to Equation (1) is achieved via the separable and partial fraction methods (Martha and James, 2018).
The Least-squares Method for Estimating the Parameters
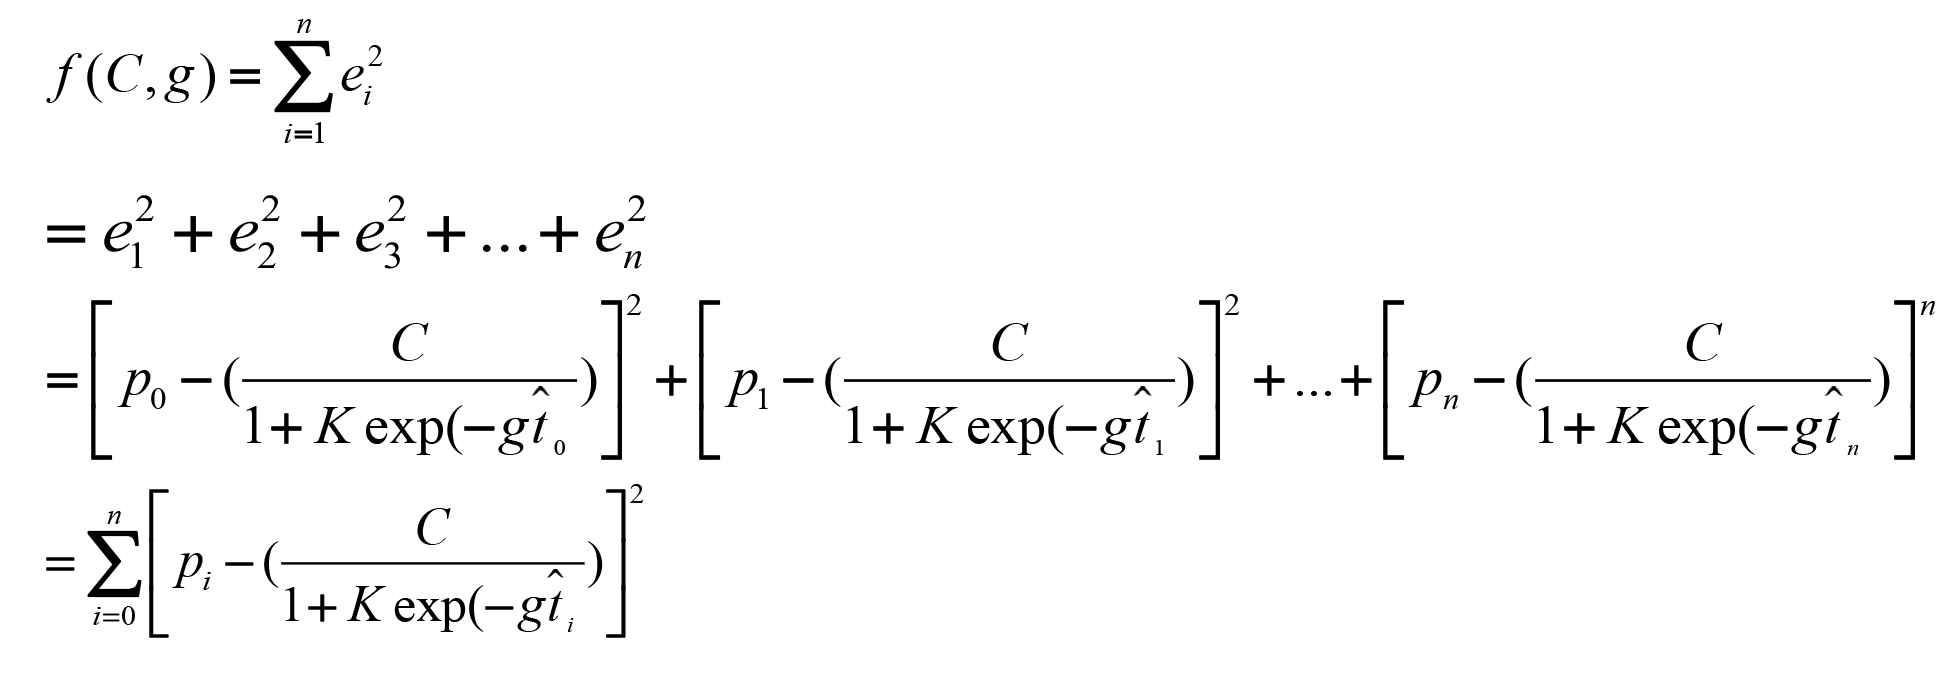
The least-squares method was applied to estimate the parameters of the prediction model for the daily number of COVID-19 cases in the Nordic countries. The main approach for the least-squares method is to fit the logistic function and the observations by estimating the appropriate parameters for the logistic function as the minimum error between the observations and the estimate values using the model. The logistic function is derived as
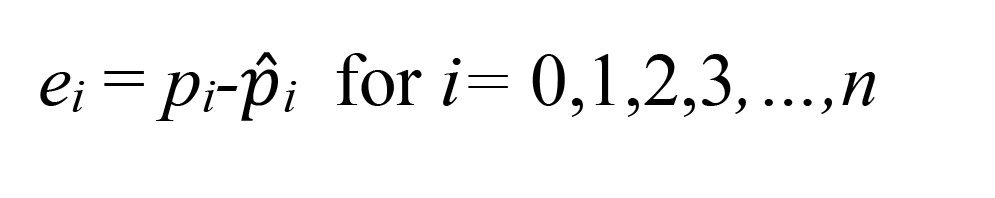
For the set of n observations at time ti and the daily number of COVID-19 in Nordic countries p(ti) = pi,
![]()
Let pi be the actual value for the ith observation, i be the ith estimated value from the predictive model, and ei be the error between the actual value and estimate value. Thus,
To summarize the squared-error (C, g) with two independent variables C and g,
To minimize the sum-of-squares error, the critical values (C*, g*) are calculated by applying ![]() , and must correspond to the minimum value of the sum-of-squares error function as follows:
, and must correspond to the minimum value of the sum-of-squares error function as follows:
Let H be a Hessian matrix of second partial derivatives.
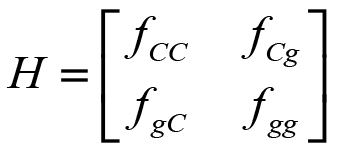
If det[H(C*, g*)] > 0 and fcc(C*, g*) > 0 then f has a minimum at (C*, g*).
Analysis of the predictive model
The analysis of the logistic model describing the daily COVID-19 cases in Nordic countries was conducted by studying the asymptotical behavior when the time approaches infinity.
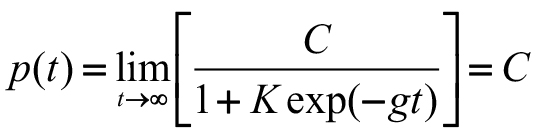
Thus, when the time tends toward infinity, the population size of the daily COVID-19 cases will approach the carrying capacity. The maximum daily COVID-19 cases is derived from the derivative of the logistic function as follows:
Let![]() denote the spreading rate of COVID-19. The maximum daily COVID-19 rate occurs at the inflection point of the logistic functionat which
denote the spreading rate of COVID-19. The maximum daily COVID-19 rate occurs at the inflection point of the logistic functionat which ![]() .
.
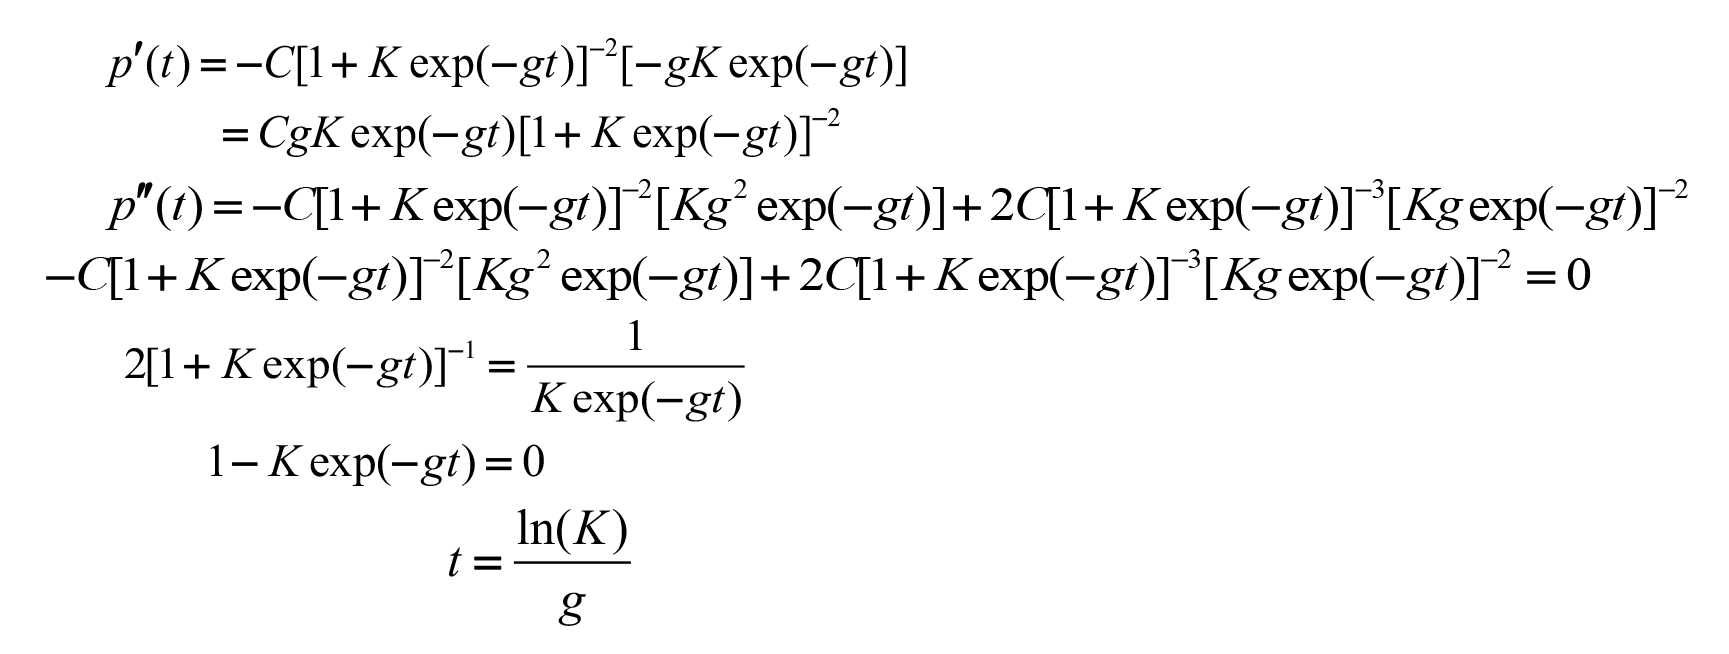
Therefore, the maximum daily COVID-19 rate occurs at ![]() , after which the curve slowly starts to flatten. On the other hand, the daily COVID-19 cases increase tothe maximum at half the carrying capacity before the slow start.
, after which the curve slowly starts to flatten. On the other hand, the daily COVID-19 cases increase tothe maximum at half the carrying capacity before the slow start.
To sum up, the time for the fastest daily spread of COVID-19 is at ![]() after the initial outbreak (t=0). At the peak of the outbreak,
after the initial outbreak (t=0). At the peak of the outbreak, ![]() new people become infected every day. The time at which the spread of the disease starts to slow down is after the peak at
new people become infected every day. The time at which the spread of the disease starts to slow down is after the peak at ![]() , and the number of daily COVID-19 cases then approaches the carrying capacity.
, and the number of daily COVID-19 cases then approaches the carrying capacity.
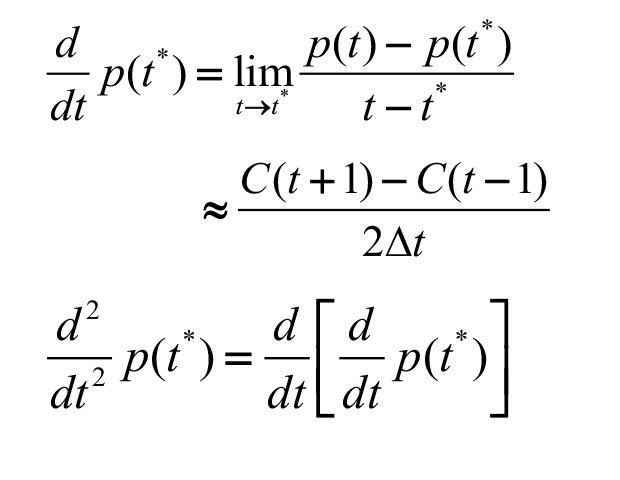
However, the first and the second derivatives of p(t) at point t* are originally defined and estimated as
Model Veracity
An efficient predictive model should be veracious, i.e. accurate, precise, and trustworthy. To ensure this, the confidence interval for measuring the trustworthiness of the predictive model, the mean absolute percentage error (MAPE) for measuring the accuracy of the predictive model, and the correlation index or the coefficient of determination (R2 ) for measuring the precision of the predictive model are applied as follows:
Confidence Interval (CI) 100(1- α)% of p(t)
upper confidence ![]() interval =
interval =
lower confidence ![]() interval =
interval =
where SE is the standard error of p(t) and df is the degree of freedom.
Mean Absolute Percentage Error (MAPE)
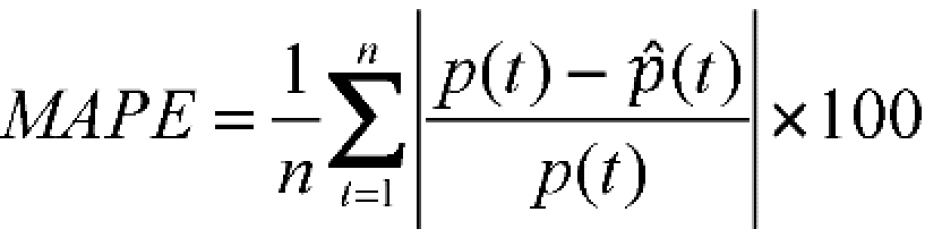
where p(t) is the actual value and (t) is the predictive value.
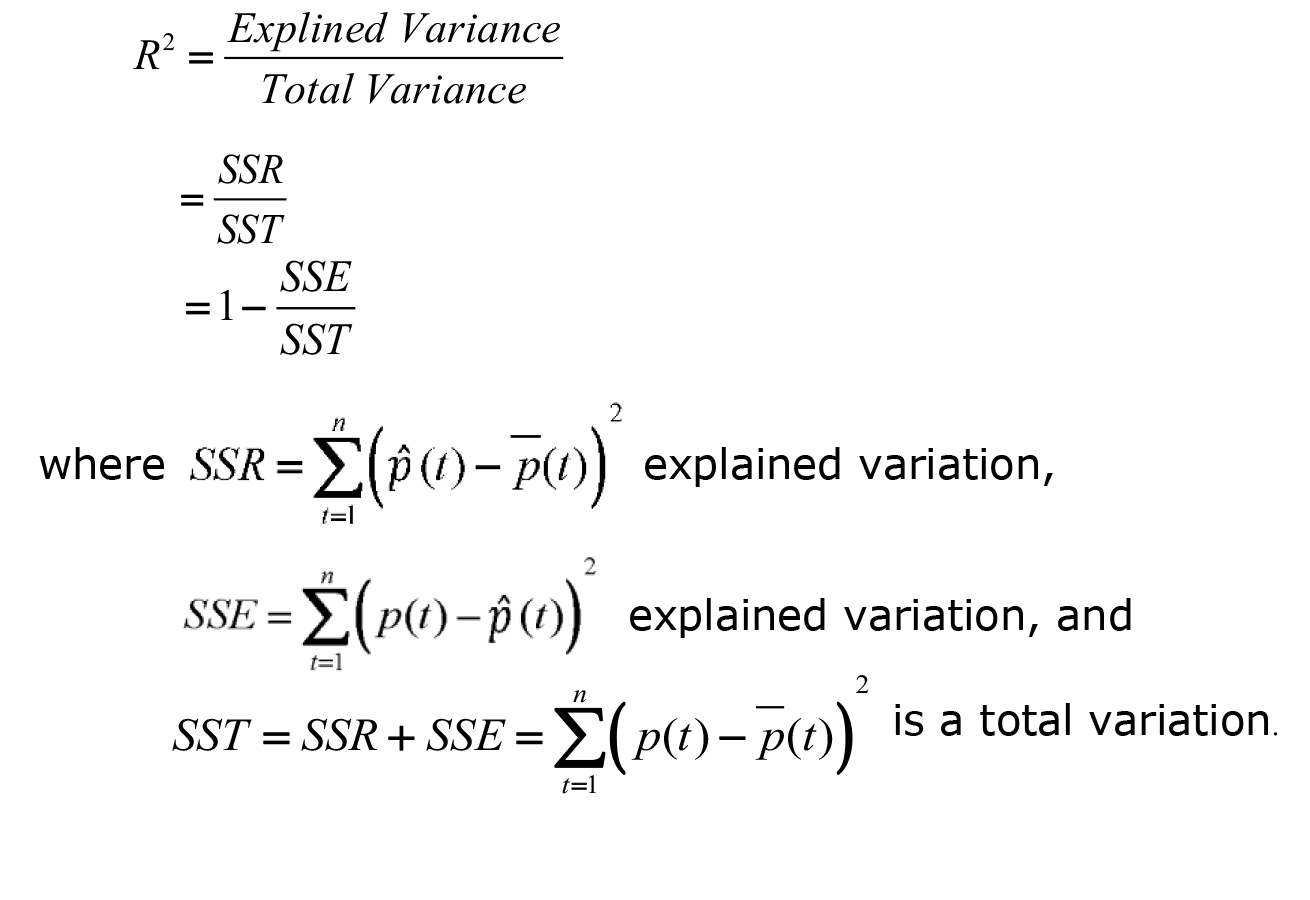
Coefficient of Determination (R2)
RESULTS
Here, we present the results from assessing the methodology and compare the output of applying the predictive model to Nordic countries’ response to COVID-19 based on either the herd immunity policy or the strict lockdown policy. The interpretation and analysis of the results are provided as follows.
Fundamental statistics
Table 1 reports the basic descriptive statistics for the number of daily COVID-19 cases in Sweden based on the herd immunity policy and the other Nordic countries (Norway, Finland, and Denmark) based on the strict lockdown policy. It was found that the average daily number of infected people in Sweden was approximately 7,895, which is higher than Norway (3,909), Denmark (3,882), and Finland (2,000). Skewness of [-0.5, 0.5] indicates that the data is symmetrical whereas [-1.0, -0.5] or
[0.5, 1.0] indicates that the data is negatively or positively skewed, respectively. Meanwhile, kurtosis equal to, greater than, or less than 3 indicates that the distribution of data is symmetric, heavy-tailed, or light-tailed, respectively. Thus, the distributions of the number of daily COVID-19 cases in Sweden and Finland are positively skewed and light-tailed whereas those for Norway and Denmark are symmetric and light-tailed.
Table 1. Fundamental statistics for the total COVID-19 cases in Nordic countries.
|
Descriptive statistics |
Sweden |
Norway |
Finland |
Denmark |
|
Mean |
7895.24 |
3908.88 |
1999.98 |
3881.95 |
|
Standard Error |
935.01 |
343.65 |
221.64 |
403.98 |
|
Median |
3700 |
4284 |
1240 |
2201 |
|
Mode |
1 |
0 |
1 |
0 |
|
Standard Deviation |
8721.25 |
3205.36 |
2067.37 |
3768.08 |
|
Sample Variance |
76060219.77 |
10274376.68 |
4274037.96 |
14198460.02 |
|
Kurtosis |
-0.80 |
-1.72 |
-1.18562214 |
-1.42 |
|
Skewness |
0.79 |
-0.03 |
0.58 |
0.43 |
|
Range |
26669 |
8132 |
5983 |
10513 |
|
Minimum |
1 |
0 |
1 |
0 |
|
Maximum |
26670 |
8132 |
5984 |
10513 |
|
Sum |
686886 |
340073 |
173999 |
337730 |
|
Count |
87 |
87 |
87 |
87 |
The estimated parameters for the spreading of COVID-19 in Sweden
This section provides the parameters estimated by logistic model under herd immunity policy of Sweden.Effects of perilla meal upon the modification of fatty acid profiles of broiler meat
Figure 1 shows the estimated daily COVID-19 cases in Sweden under the herd immunity policy. The estimated parameters for the logistic model are p0= 105.84689, g = 0.0869, and C = 30,063.9635, while the predictive model is
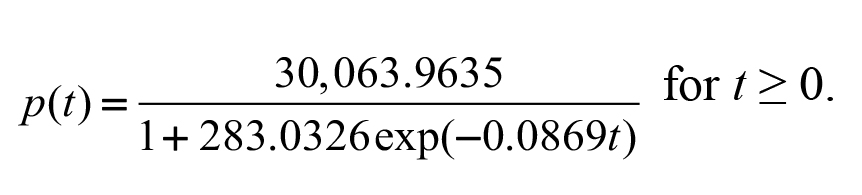
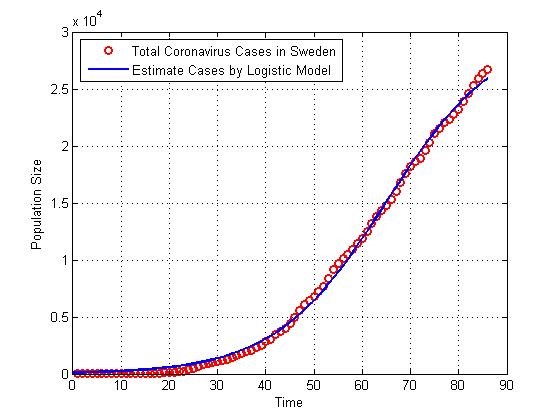
Figure 1. Estimate COVID-19 cases in Sweden under herd immunity policy.
The estimated parameters for the spread of COVID-19 in the other Nordic countries
This section provides the parameters estimated by logistic model under non herd immunity policy (strict lockdown policy or flattened curve policy) of the neighbor countries of Sweden.
Figure 2 shows the estimated daily COVID-19 cases in Norway under the strict lockdown policy. The estimated parameters for the logistic model are p0 = 34.4242, g = 0.1275, and C = 7,815.4299, while the predictive model is
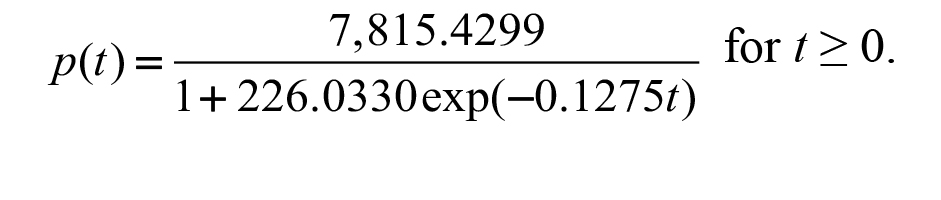
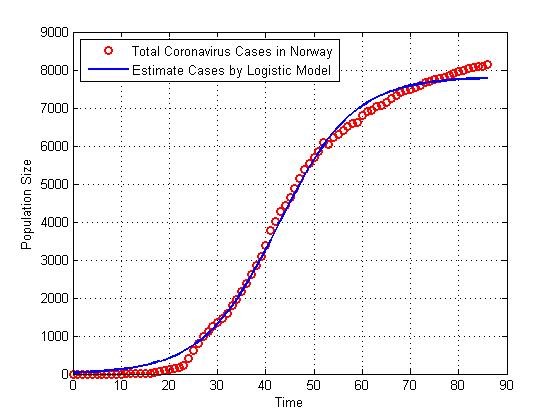
Figure 2. Estimate COVID-19 cases in Norway under strict lockdown policy.
Figure 3 shows the estimated daily COVID-19 cases in Finland under the strict lockdown policy. The estimated parameters for the logistic model are p0 = 25.9141, g = 0.0931, and C = 6,217.9654, while the predictive model is
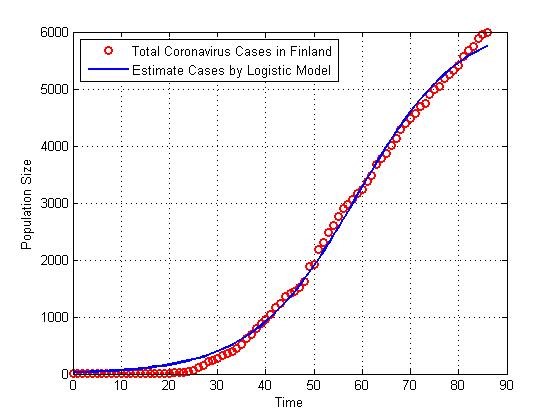
Figure 3. Estimate COVID-19 cases in Finland under strict lockdown policy.
Figure 4 shows the estimated daily COVID-19 cases in Denmark under the strict lockdown policy. The estimated parameters for the logistic model are p0 = 45.3325, g = 0.1002, and C = 10,480.2114, while the predictive model is
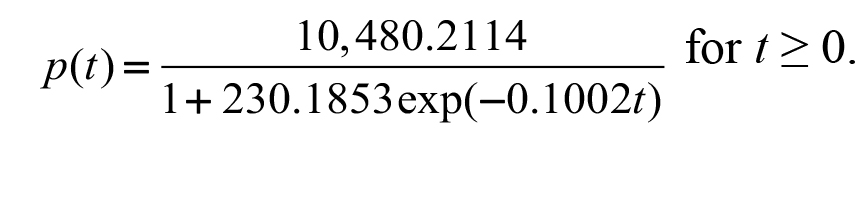
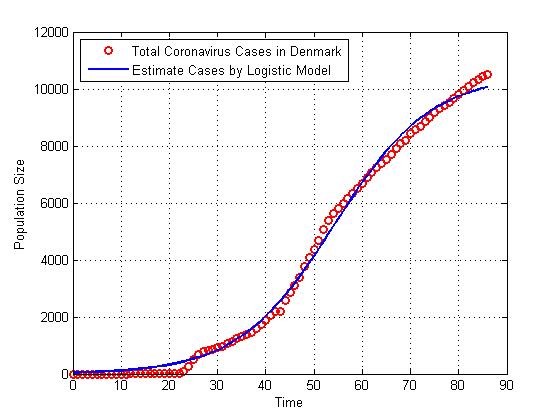
Figure 4. Estimate COVID-19 cases in Denmark under strict lockdown policy.
Results comparison and validation of the predictive models
The results of the behavior and estimated spread of COVID-19 cases in the Nordic countries are shown in Table 2 and Figure 5, respectively.
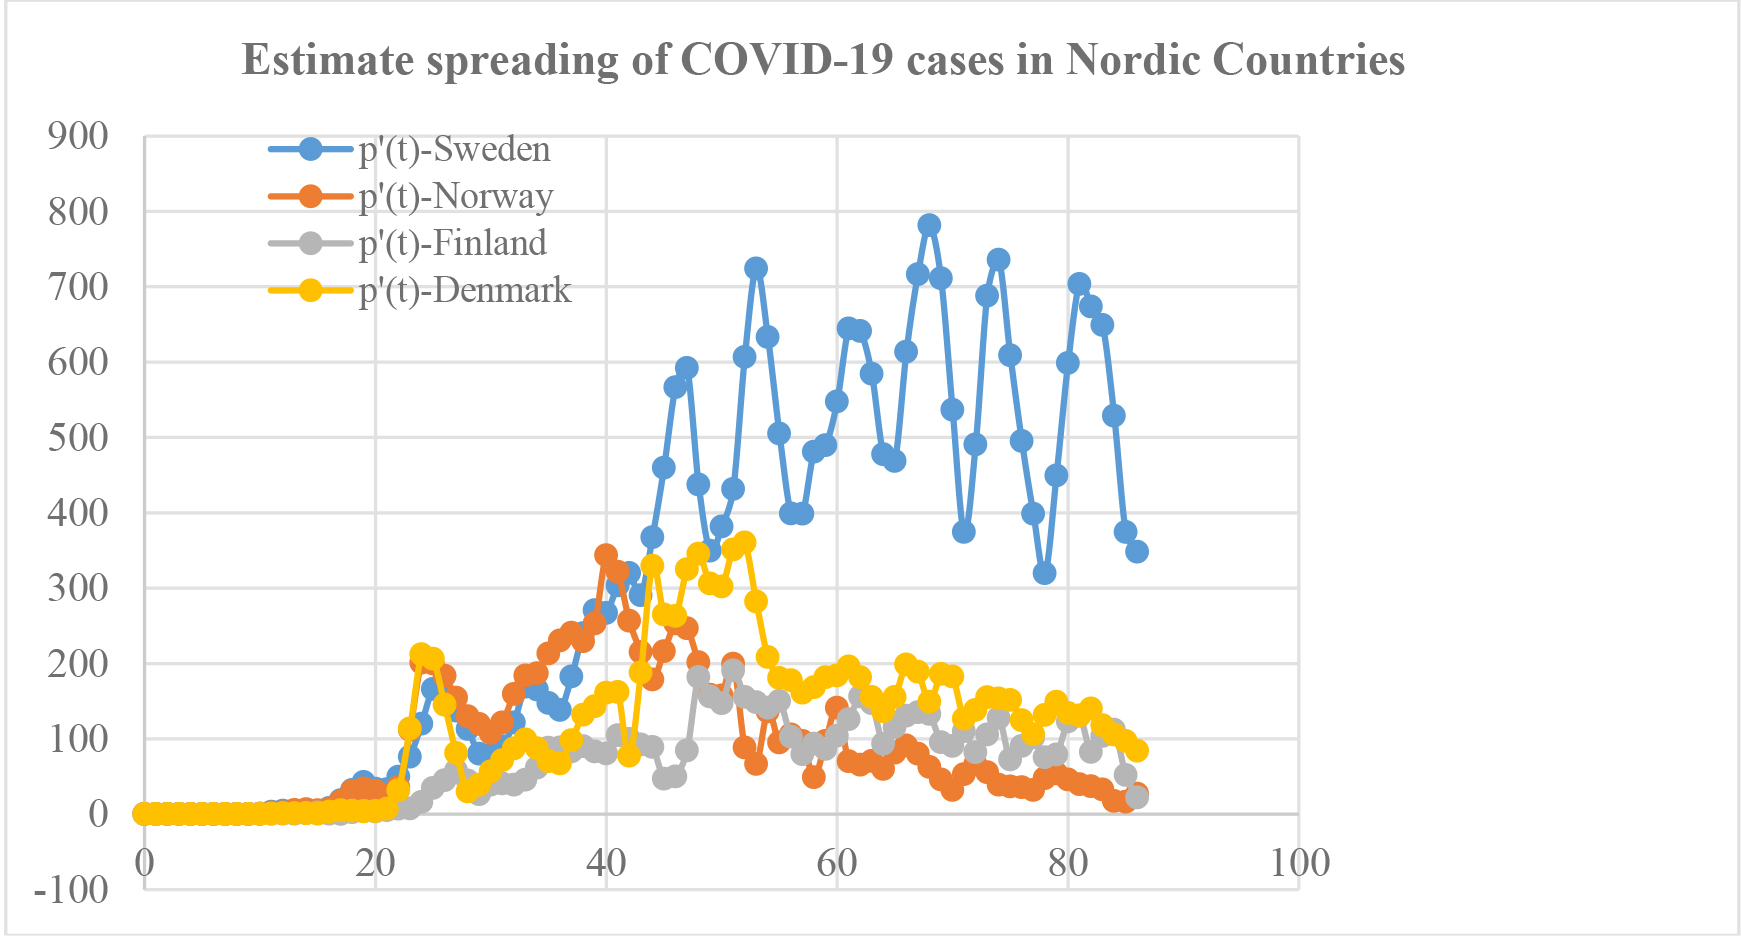
Figure 5. Estimate the derivative of COVID-19 cases in Nordic countries.
Table 2. Statistics for behavior of COVID-19 spreading in Nordic countries.
|
Countries |
Population |
Carrying Capacity (%) |
Peak time |
Maximum growth rate (cases/ day) |
|
Sweden |
10,090,653 |
30,063.96(0.29) |
64.94 |
653.34 |
|
Norway |
5,415,408 |
7,815.42(0.14) |
42.52 |
249.03 |
|
Finland |
5,539,565 |
6,217.96(0.11) |
58.82 |
144.71 |
|
Denmark |
5,789,442 |
10,480.21(0.18) |
54.27 |
262.57 |
Note: Population as of May 12, 2020.
Table 2 reports the population, carrying capacity, peak time, and maximum growth rate of the COVID-19 spread in the Nordic countries. At this time, all of the countries have already passed the peak time and maximum growth rate. However, the number of infected people in Sweden is the highest. That is to say, the carrying capacity is approximately cases (0.2979%), which is the predicted cumulative COVID-19 infected number in Sweden during the outbreak. However, the total number of COVID-19 cases in Sweden as of 11 May, 2020, is 26,670 (Worldometer, 2020). This means that the number of infected people in Sweden will gradually decline after passing the peak time, as illustrated by the speed of COVID-19 spread in the Nordic countries in Figure 5. It can be seen that the speed of COVID-19 spread in Sweden is the fastest while that in Norway is the slowest after reaching the peak time despite the fact that the speed of COVID-19 spread in Norway was the fastest in the period before reaching the peak time. Moreover, Table 3 demonstrates the validation of the predictive model based on MAPE, R2, and confidence intervals for the total cases.
Table 3. Validation of the predictive model.
|
Time |
Countries |
Total cases |
Confidence Interval |
|
|
Actual |
Estimate |
Lower CI – Upper CI |
||
|
87 |
Sweden |
27,272 |
2,6210 |
25,482 - 26,938 |
|
|
Norway |
8,157 |
7,789 |
7,425 - 8,152 |
|
|
Finland |
6,003 |
5,797 |
5,571 - 6,023 |
|
|
Denmark |
10,591 |
10,100 |
9,669 - 10,532 |
|
88 |
Sweden |
27,909 |
2,6493 |
25,765 - 27,221 |
|
|
Norway |
8,175 |
7,792 |
7,428 - 8,155 |
|
|
Finland |
6,054 |
5,832 |
5,607 - 6,058 |
|
|
Denmark |
10,667 |
10,135 |
9,704 - 10,567 |
|
89 |
Sweden |
28,582 |
2,6758 |
26,030 - 27,486 |
|
|
Norway |
8,196 |
7,795 |
7,431 - 8,158 |
|
|
Finland |
6,145 |
5,865 |
5,639 - 6,090 |
|
|
Denmark |
10,713 |
10,167 |
9,735 - 10,599 |
|
90 |
Sweden |
29,207 |
27,005 |
26,277 - 27,733 |
|
|
Norway |
8,219 |
7,797 |
7,434 - 8,160 |
|
|
Finland |
6,228 |
5,894 |
5,669 - 6,120 |
|
|
Denmark |
10,791 |
10,196 |
9,765 - 10,628 |
|
91 |
Sweden |
29,677 |
27,236 |
26,508 - 27,964 |
|
|
Norway |
8,237 |
7,799 |
7,436 - 8,163 |
|
|
Finland |
6,286 |
5,922 |
5,696 - 6,147 |
|
|
Denmark |
10,858 |
10,223 |
9,791 - 10,654 |
|
MAPE(%) R2 |
Sweden = 6.22 Sweden = 0.99 |
Norway =4.91 Norway =0.99 |
Finland = 4.56 Finland =0.99 |
Denmark = 5.21 Denmark = 0.99 |
DISCUSSIONS
The focus of this research is on forecasting the number of daily COVID-19 cases in Sweden, in which the herd immunity policy was implemented, and comparing the results with Norway, Finland, and Denmark, in which the strict lockdown policy was implemented. For the predictive model, the independent variable (time) could almost completely explain the dependent variable (daily COVID-19 cases) because R2 for all of the countries was approximately 0.99. However, MAPE was 6% for Sweden and 5% for the other countries. In Sweden, the daily number of cases gradually increased and the curve after the peak time was not flattened (Figure 1). However, in Norway, Finland, and Denmark, the daily number of cases gradually increased and the curve after the peak time was flattened (Figures 2 and 3). In Figure 5, the speed of the daily COVID-19 cases in Sweden fluctuated during the outbreak because the strict lockdown policy was not instigated by the government. When estimating the daily COVID-19 cases, the herd immunity policy applied in Sweden did not result in smoothing of the predictive curve after the peak time whereas the strict lockdown policy in Norway, Finland, and Denmark did. However, the number of infections and deaths from COVID-19 in Sweden is still fewer than in other countries in Europe that applied the strict lockdown policy, such as Russia, Italy, and Spain. Therefore, herd immunity policy is an alternative for controlling COVID-19 and can be applied with other methods such as using the lockdown policy in specific high-risk areas for reducing and alleviating the number of deaths from COVID-19.
CONCLUSIONS
The predictive model suggested in this paper for estimating the daily COVID-19 cases in Nordic countries is the logistic growth curve. Sweden is the only country using the herd immunity policy for controlling the spread of COVID-19, while the other Nordic countries (Norway, Finland, and Denmark) are using the strict lockdown policy. The findings from this study indicate that after the peak time, the logistic growth curve for Sweden was not flattened whereas that for Norway had already flattened and those for Finland and Denmark started flattening due to implementing the strict lockdown policy; the number of infectious people in all of the countries started to slow after the peak time, but this was slower in Sweden than in the other countries. To sum up, the herd immunity policy is an alternative for controlling the disease because it does not affect the economy as harshly and could be efficient at flattening the predictive curve for COVID-19 if it is used together with strict lockdown in high-risk areas such as elderly care homes.
REFERENCES
Anastasia, I.L., Eugene, B.P., Olga, A.M., and Boris, I.V. 2017. Bi-logistic model for disease dynamics caused by Mycobacterium tuberculosis in Russia. Royal Society Open Science. 4: 1-8.
Baniamin, H., Rahman, M., and Hasan, M. 2020. The COVID-19 pandemic: why are some countries more successful than others? SSRN Electronic Journal. 10.2139/ssrn.3575251.
Cui, J., Li, F., and Shi, Z-L. 2019. Origin and evolution of pathogenic coronaviruses. Nature Reviews Microbiology. 17: 181–192.
Eberhardt, L.L., and Breiwick, J.M. 2012. Models for population growth curves. International Scholarly Research Notices. 2012: 1-7.
Holly, E. 2020. Sweden resisted a lockdown, and its capital Stockholm is expected to reach ‘herd immunity’ in weeks [Internet]. HEALTH AND SCIENCE [cited 2020 May 12]. Available from: https://www.cnbc.com/2020/04/22/no-lockdown-in-sweden-but-stockholm-could-see-herd-immunity-in-weeks.html
Ji, L. 2013. Analysis of a modified logistic model for describing the growth of durable customer goods in China. Mathematical and Computational Applications. 18: 30-37.
Kharab, A., and Guenther, R.B. 2012. An introduction to numerical methods a MATLAB approach, 3rd edition. USA: CRC Press.
Marsh, M., and McMahon, H.T. 1999. The structural era of endocytosis. Science. 285: 215–20.
Martha, L.A., and James, P.B. 2018. Introductory differential equations. London, United Kingdom: Academic Press.
Mukherjee, S., Ghosh, R., and Maxfield, F. 1997. Endocytosis. Physiological Reviews. 77: 759-803.
Strang J. 2020. Why do the Nordic countries react differently to the covid-19 crisis? [Internet]. Aarhus University [cited 2020 May 10]. Available from: https://nordics.info/show/artikel/the-nordic-countries-react-differently-to-the-covid-19-crisis/
Tsoularis, A.N., and Wallace, J. 2002. Analysis of logistic growth models. Mathematical Biosciences. 179: 21-55.
Valentina S. 2015. Simple logistic and Bi-logistic growth used as forecasting models of greenhouse areas in Albanian agriculture. Journal of Multidisciplinary Engineering Science and Technology. 2: 2648- 2653.
Verhulst, P.F. 1838. Notice sur la loi que la population suit dans son accroissement. Correspondence Mathematique et Physique. 1838: 113–121.
Worldometer. 2020. [cited 2020 May 12]. Available from: https://www.worldometers.info/coronavirus/country
Wu, C., Liu, Y., Yang, Y., Zhang, P., Zhong, W., Wang, Y., Wang, Q., Xu, Y., Li, M., Li, X., et al. 2020. Analysis of therapeutic targets for SARS-CoV-2 and discovery of potential drugs by computational methods. Acta Pharmaceutica Sinica B.
OPEN access freely available online
Chiang Mai University Journal of Natural Sciences [ISSN 16851994]
Chiang Mai University, Thailand
https://cmuj.cmu.ac.th
Rapin Sunthornwat1,* and Yupaporn Areepong2
1 Faculty of Science and Technology, Pathumwan Institute of Technology, Bangkok 10330, Thailand
2 Faculty of Applied Science, King Mongkut’s University of Technology North Bangkok, Bangkok 10800, Thailand
Corresponding author: Rapin Sunthornwat, E-mail: mathstatistica@gmail.com
Total Article Views
Editor: Wasu Pathom-aree,
Chiang Mai University, Thailand
Article history:
Received: May 18, 2020;
Revised: August 14, 2020;
Accepted: September 8, 2020