
QSAR-Based Design of The More Potent Betulinic Acid Derivatives as HIV Maturation Inhibitor
Ihsanul Arief*, Harno Dwi Pranowo, Mudasir Mudasir, and Karna WijayaPublished Date : 2020-12-17
DOI : https://doi.org/10.12982/CMUJNS.2021.010
Journal Issues : Number 1, January-March 2021
Abstract The maturation process on HIV life-cycles has become one of the targeted steps to inhibit these viruses. This process involves two kinds of proteins, namely HIV-protease and SP1-Gag. Betulinic acid (BA) and its derivatives had been known as potential inhibitors of HIV maturation. As their capability to modeling and also predict the activity of some analog compounds by using the descriptors, quantitative structure-activity relationship (QSAR) has been used to design more potent "new drugs" in recent years. Three-dimensional (3D) descriptors explained the topology of a compound and had proven to have relations to the compound's biological activity. In this study, QSAR models were designed from 29 BA derivatives with HIV maturation inhibition activities. The best model involves 5 descriptors as follows:
1/logEC50 = -473.8 + (71.03 × TDB6u) + (764.7 × FPSA-3) +
(-0.604 × RDF140u) + (0.882 × RDF80e) + (0.262 × PPSA-3)
r2 = 0.792 SEE = 2.0305 Fcal/Ftab = 7.5621 r2test = 0.9798 Q2 = 0.9644
r2m = 0.9445
The QSAR model was then used to design and predict some of the new BA derivatives’ HIV maturation activities. The best predicted compound had 1/logEC50 value of -0.838 and EC50 value of 0.064 nM with the chemical name of 4‐[(1R,3aR,5aR,5bR,7aS,11aR,11bS,13aS,13bS)‐5a,5b,8,8,11b‐penta methyl‐1‐(prop‐1‐en‐2‐yl)‐3a[({2‐[4‐(pyrimidin‐2‐yl)piperazin‐1‐yl]ethyl} amino)methyl]‐icosahydro‐1H-cyclo penta[a]chrysen‐9‐yl]benzoic acid. The synthetic route to the proposed compound also suggested in this report.
Keywords: Betulinic acid, Drug design, HIV maturation inhibitor, QSAR
Funding: The authors gratefully acknowledge the Austria-Indonesian Centre for Computational Chemistry (AIC) for the facilities and to Indonesian Endowment Fund for Education (LPDP) for its financial support for this research.
Citation: Arief, I., Pranowo, H.D., Mudasir, M., and Wijaya, K. 2021. QSAR-based design of potent betulinic acid derivatives as HIV maturation inhibitors. CMUJ. Nat. Sci. 20(1): e2021010
INTRODUCTION
Along the life cycle of the human immunodeficiency virus (HIV), there are several steps that could inhibit the viruses and prevent its spread. One of the steps is the maturation process. This process evolves two proteins, namely protease and SP1-Gag (Freed, 2015; Shi et al., 2018). The protease cleaves Gag and Gag-Pol polyprotein precursor encoded by the HIV-1 virus genome to produce mature active proteins (Lv et al., 2015). SP1-Gag plays a role in the formation of the viral envelope at the start of virus release from the host cell (Datta et al., 2016). The recent update mentioned that mutation on protease had caused decreasing effectiveness (in terms of Kd values) of darunavir, standard anti-retrovirus drug as protease inhibitors, up to 8,000 times (Louis et al., 2011). These facts necessitate research for the discovery of more potent HIV maturation inhibitors as presented in this work.
Betulinic acid (BA), as shown in Figure 1 is a very potent plant triterpenoid compound with a broad spectrum of activities and has been found in several plants (Bildziukevich et al., 2019). Its natural molecule and derivatives have anticancer, antiviral, antibacterial and antimalarial activities (Sousa et al., 2019). One of the most studied BA derivatives’ antiviral activities is its potential that inhibits HIV-protease (Aiken and Chen, 2005). Modification to enhance BA derivatives’ protease inhibition were conducted by some previous studies (Kashiwada et al., 1996; Zhao et al., 2012; Ortiz et al., 2017; Huang et al., 2018). The changes of the substituent on the C-28 position have been recognized to give different HIV-protease inhibition. Chen et al. have synthesized 29 BA derivative compounds that showed promising maturation inhibition activities (Chen et al., 2018).
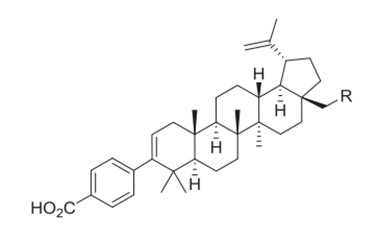
Figure 1. Structure of betulinic acid.
Computer-aided drug design (CADD), which has the capability to reduce trial-and-error steps on drug discovery, has become one of the essential techniques to design more active new compounds. One of the CADD techniques is a quantitative structure-activity relationship (QSAR), whose analysis can provide some mathematical models as a theoretical basis to design more potent compounds (Mercader et al., 2016). Three-dimensional (3D) descriptors, which describe topology properties of a compound, had been used to develop QSAR models from several biological activities (Mao et al., 2012; Han et al., 2016; Kang et al., 2016; Tong et al., 2017). In this work, the QSAR model was used to design theoretically more active BA derivatives as an HIV maturation inhibitor using 3D descriptors.
MATERIALS AND METHODS
Dataset
A series of BA derivatives (29 compounds) and their HIV maturation inhibitory activities (EC50) were obtained from the literature (Chen et al., 2018), and used as a dataset in this study, as shown in Table 1. The dataset was divided into the training set and the test set according to the rules mentioned by Jain et al. (2012). The training set was used to develop the QSAR model while the test-set was used to validate the model.
Table 1. Betulinic Acid Derivatives and Its HIV Maturation Inhibition Activities (Chen et al. 2018)
|
No |
R |
EC50 (nM) |
|
No |
R |
EC50 (nM) |
|
7a |
2,2 |
|
22 a |
2,0 |
||
|
8 a |
|
27 |
|
23 a |
6 |
|
|
9 a |
|
4,3 |
|
24 a |
4,7 |
|
|
10 a |
6,7 |
|
25 b |
|
2,7 |
|
|
11 a |
|
2,0 |
|
26 a |
3,3 |
|
|
12 a |
|
51 |
|
27 a |
2,7 |
|
|
13b |
1,4 |
|
28 b |
|
0,34 |
|
|
14 a |
|
5,0 |
|
29 a |
|
0,78 |
|
15 a |
7,7 |
|
30 a |
|
2,5 |
|
|
16 a |
0,7 |
|
31 a |
|
16 |
|
|
17 a |
|
1,5 |
|
32 a |
|
1,7 |
|
18 a |
|
2,8 |
|
33 a |
|
0,68 |
|
19 b |
|
0,7 |
|
34 a |
|
1,4 |
|
20 a |
1,0 |
|
35 b |
|
14 |
|
|
21 a |
|
2,0 |
|
|
|
|
|
a Training-set; b Test-set |
Geometry optimization and descriptors calculation
The geometry of chemical structures was optimized using the B3LYP functional theory and 6-31G basis set which was implemented in the Gaussian 09 package (Frisch et al., 2016) as this method has given the most accurate geometrical structure comparing to the natural occurrence in case of H1 chemical shifts. The 3D descriptors of optimized structures were calculated using PaDEL descriptor software (Yap, 2010). The 431 topological descriptors were statistically screened into 8 descriptors using the genetic algorithm method implemented in BuildQSAR software (Oliveira and Gaudio, 2000). These 8 descriptors were then used to develop QSAR models.
Model development and validation
On QSAR model development, we used 5-8 descriptors, and as internal evaluation, we analyze the statistic parameters to choose the best model, namely r2training value (> 0.6), Q2 value (> 0.5), and Fcalc/Ftab value (> 1). The best model was then externally validated using the value of r2test (> 0.5) and r2m (> 0.5) (Frimayanti et al., 2011).

Where n is the number of compounds involved in training-set, k is the number of descriptors, r2 and r02 are the squared correlation coefficients between the observed and (leave-one-out) predicted values of the compounds with and without intercept, respectively.
Design of new compound
The model which has validated statistical parameters showed its capability to predict HIV maturation inhibition activities of other compounds that not included in the model development process (test set). The best model upon validated was then used to design the new compounds by replacing the substituent R. The chosen of those substituents were based on their three-dimensional properties. In the example, with the higher value of RDF140u and at the same time, lowering the values of TDB6u, FPSA-3, RDF803, and PPSA-3.
The predicted EC50 value of designed compounds was calculated by using the validated QSAR model. To ensure the validity of the designed compounds, applicability domain analysis was conducted using rstandard and hatvalues functions in R package (R Core Team, 2000). The critical value of leverage (h*) was calculated using the following equations (Gramatica, 2007).
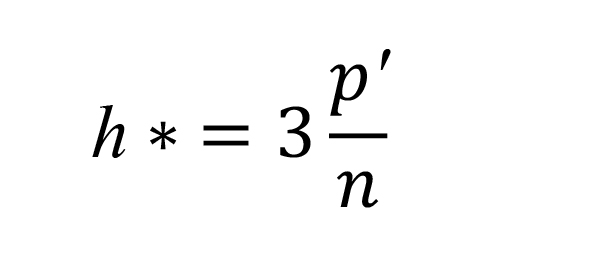
where p’ is the number of descriptors plus one, and n is the number of compounds in the training set. In this study, the number of h* was 0.75, since there are five descriptors and 24 compounds in the training set.
RESULTS
Descriptor calculation and selection
By using PaDEL software, we calculated 431 descriptors as listed in Table 2.
Table 2. Three-Dimensional Descriptors Calculated by PaDEL (Yap, 2010)
|
Descriptor Types |
Number of Descriptors |
|
3D autocorrelation |
80 |
|
Charged partial surface area |
29 |
|
Gravitational index |
9 |
|
Length over breadth |
2 |
|
Moment of inertia |
7 |
|
Petitjean shape index |
3 |
|
RDF |
210 |
|
WHIM |
91 |
Since the number of those descriptors exceeded the maximum number in developing the QSAR model (maximum at 28 descriptors), we did some screening using a genetic algorithm (GA) methods. The screening was given with 8 selected descriptors, as shown in Table 3, by which we assume that it represented one-to-three of compounds in the training set (24 compounds).
Table 3. Selected descriptors using GA.
|
Descriptor Code |
Description (Stanton et al., 1990) |
|
TDB6u |
3d topological distance based autocorrelation-lag 6 / unweighted |
|
TDB6e |
3d topological distance based autocorrelation-lag 6 / weighted by Sanderson electronegativities |
|
PPSA-3 |
Charge weighted partial positive surface area |
|
FPSA-3 |
PPSA-3 / total molecular surface area |
|
RDF80u |
Radial distribution function-080 / unweighted |
|
RDF140u |
Radial distribution function-140 / unweighted |
|
RDF80e |
Radial distribution function-080 / weighted by relative Sanderson electronegativities |
|
RDF140i |
Radial distribution function-140 / weighted by relative first ionization potential |
As an example, in Figure 2 we compare the selected descriptors from the weakest (compound 12) and the strongest (compound 28) HIV maturation inhibition activities of BA derivatives used in the dataset on this research.
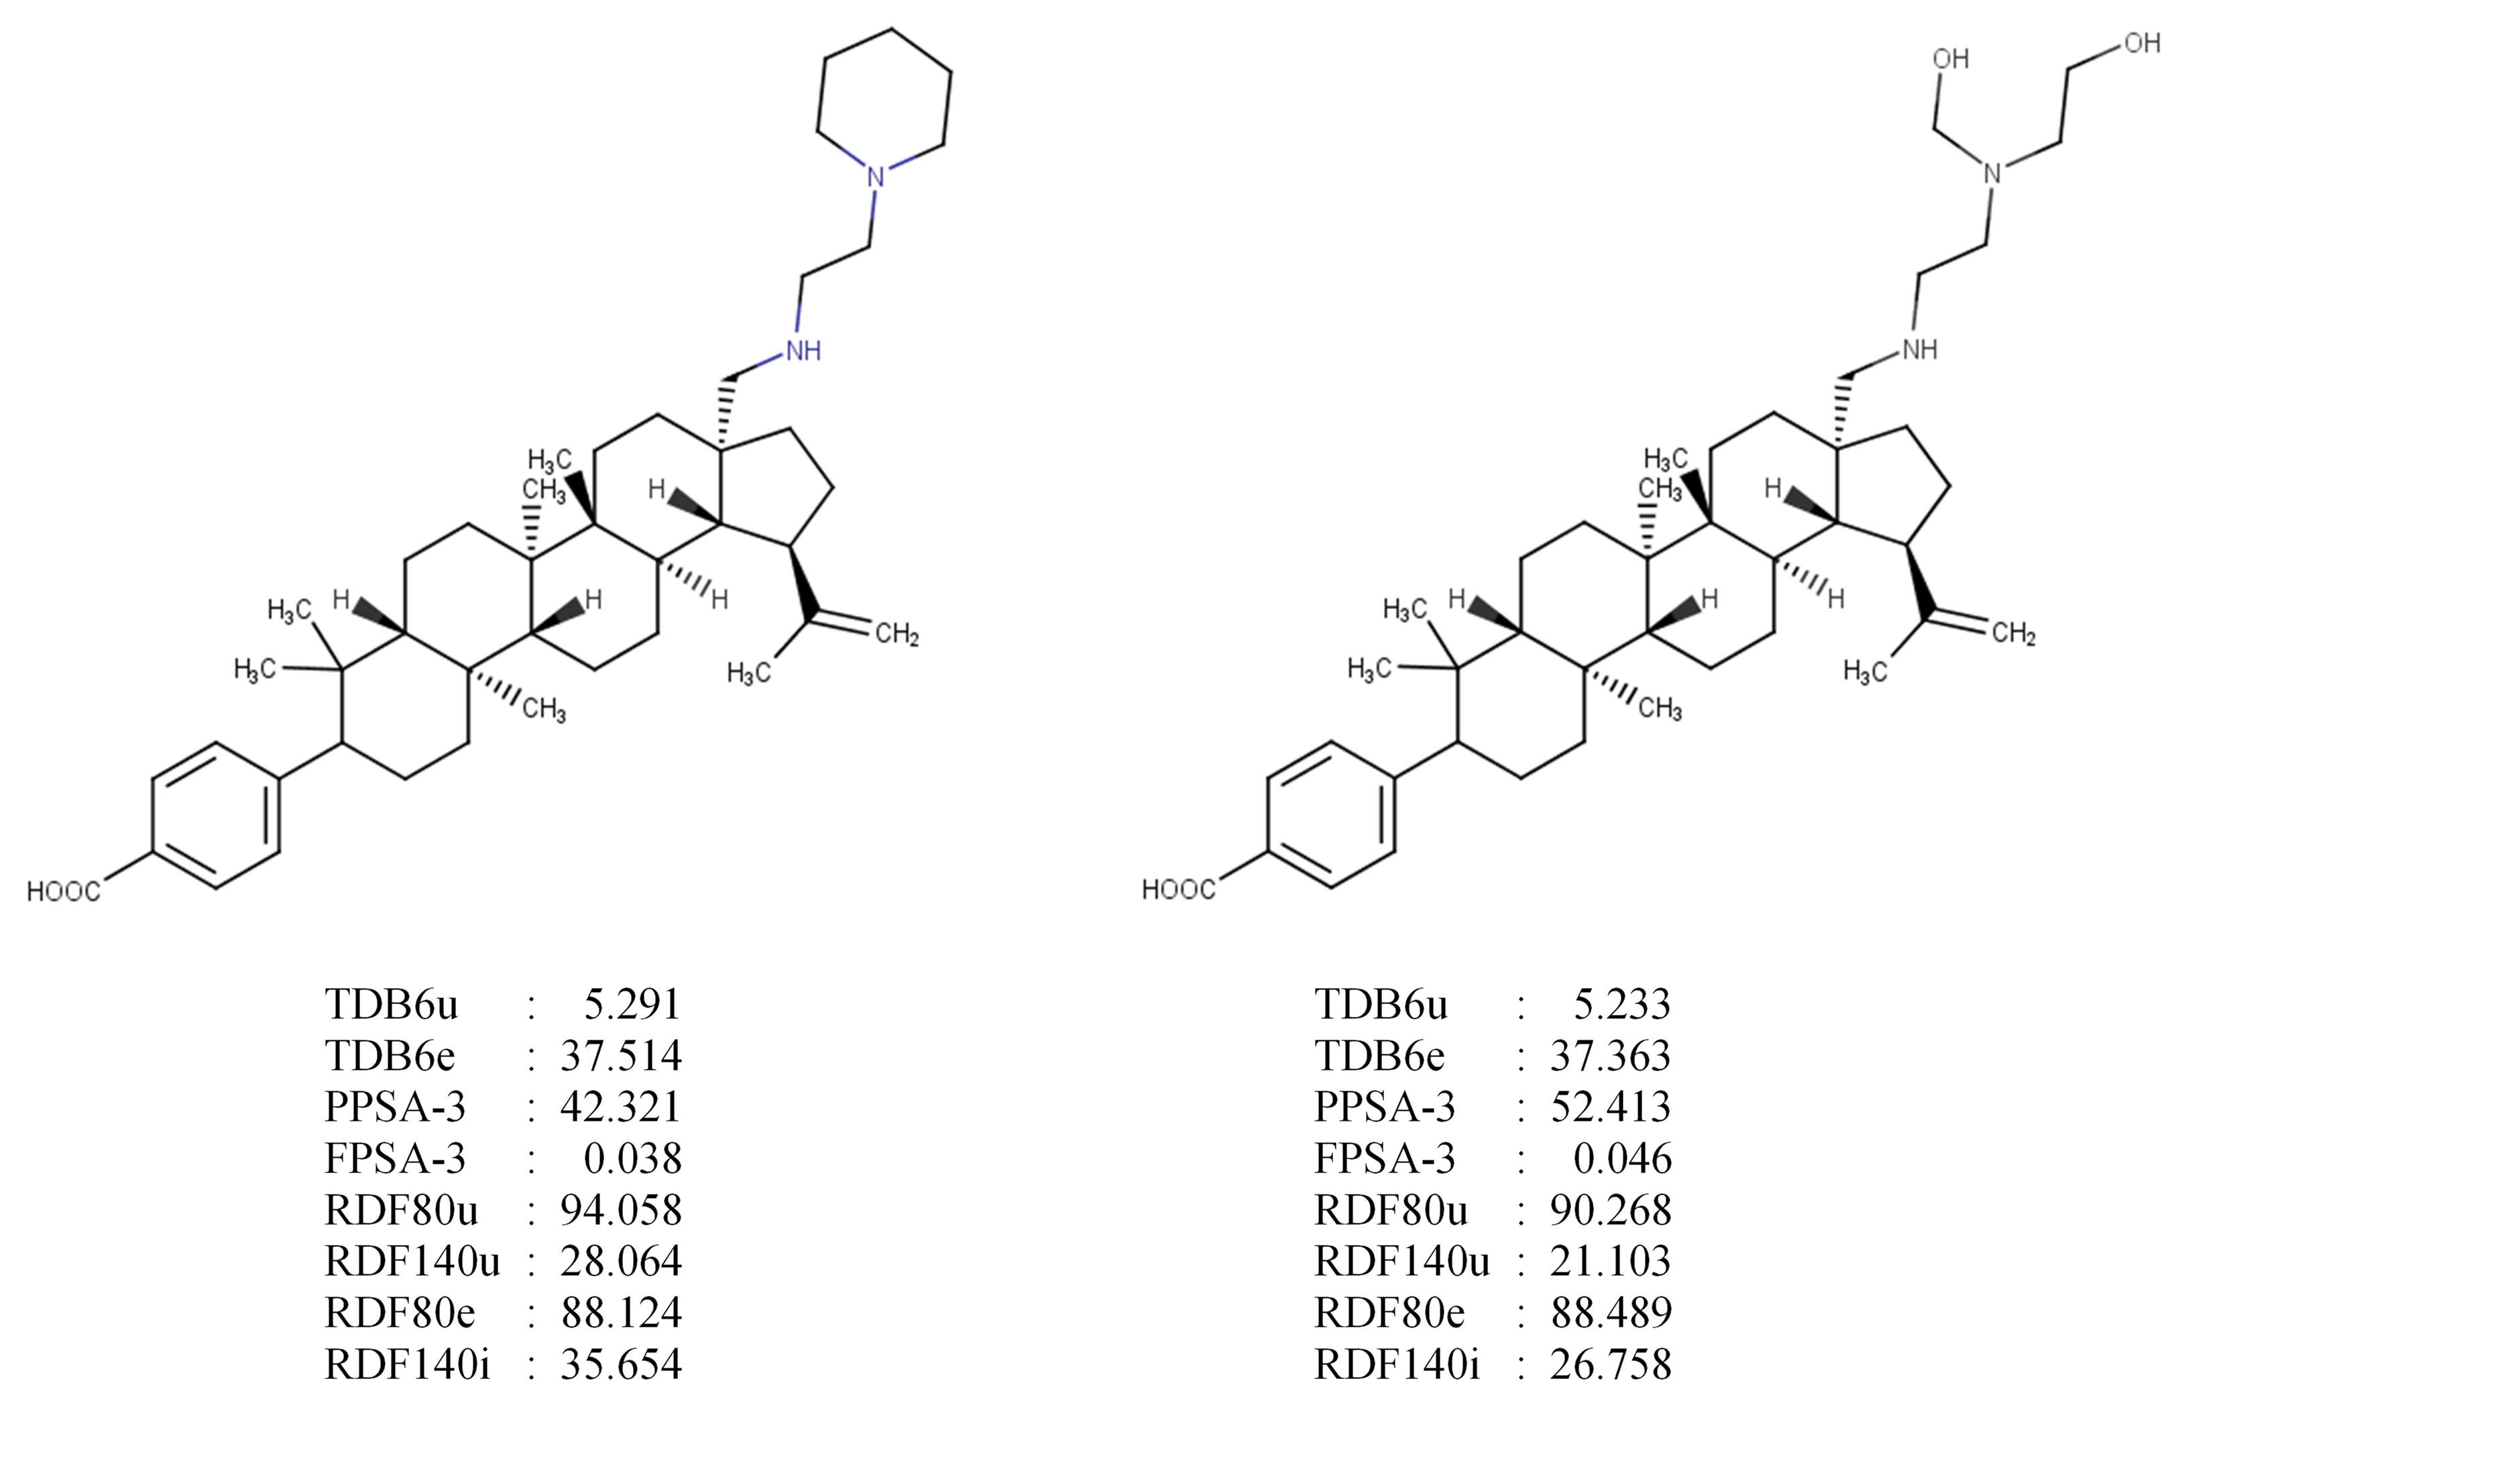
Figure 2. Compound 12 (left) and 28 (right) with their selected descriptors.
Model development and validation
As a general consensus, it is mentioned that a good QSAR model only includes maximum one-to-five descriptors as compared to a number of compounds in the training set; hence we developed four models with consecutively reduced descriptor numbers as listed follows.
Model 1
1/logEC50 = -471.6 + (71.89 × TDB6u) + (768.9 × FPSA-3) + (-0.588 × RDF140u) + (1.046 × RDF80e) + (-0.004 × RDF140i) +
(-0.155 × RDF80u) + (0.270 × PPSA-3) + (-0.202 × TDB6e)
r2 = 0.794 SEE = 2.2099 Fcal/Ftab = 3.8167 r2test = 0.9845 Q2 = 0.9782 r2m = 0.9601
Model 2
1/logEC50 = -473.0 + (70.69 × TDB6u) + (766.5 × FPSA-3) + (-0.587 × RDF140u) + (1.049 × RDF80e) + (-0.006 × RDF140i) +
(-0.156 × RDF80u) + (0.273 × PPSA-3)
r2 = 0.794 SEE = 2.1399 Fcal/Ftab = 4.7353 r2test = 0.9832 Q2 = 0.9741 r2m = 0.9529
Model 3
1/logEC50 = -472.2 + (70.57 × TDB6u) + (769.8 × FPSA-3) + (-0.594 × RDF140u) + (1.047 × RDF80e) + (-0.155 × RDF80u) +
(0.269 × PPSA-3)
r2 = 0.794 SEE = 2.0762 Fcal/Ftab = 5.9616 r2test = 0.9801 Q2 = 0.9705 r2m = 0.9513
Model 4
1/logEC50 = -473.8 + (71.03 × TDB6u) + (764.7 × FPSA-3) + (-0.604 × RDF140u) + (0.882 × RDF80e) + (0.262 × PPSA-3)
r2 = 0.792 SEE = 2.0305 Fcal/Ftab = 7.5621 r2test = 0.9798 Q2 = 0.9644 r2m = 0.9445
In Figure 3, we depicted the graphical plot between the observed and the calculated value of 1/log EC50 to all of the compounds in the dataset based on Model 4 as the simplest model.
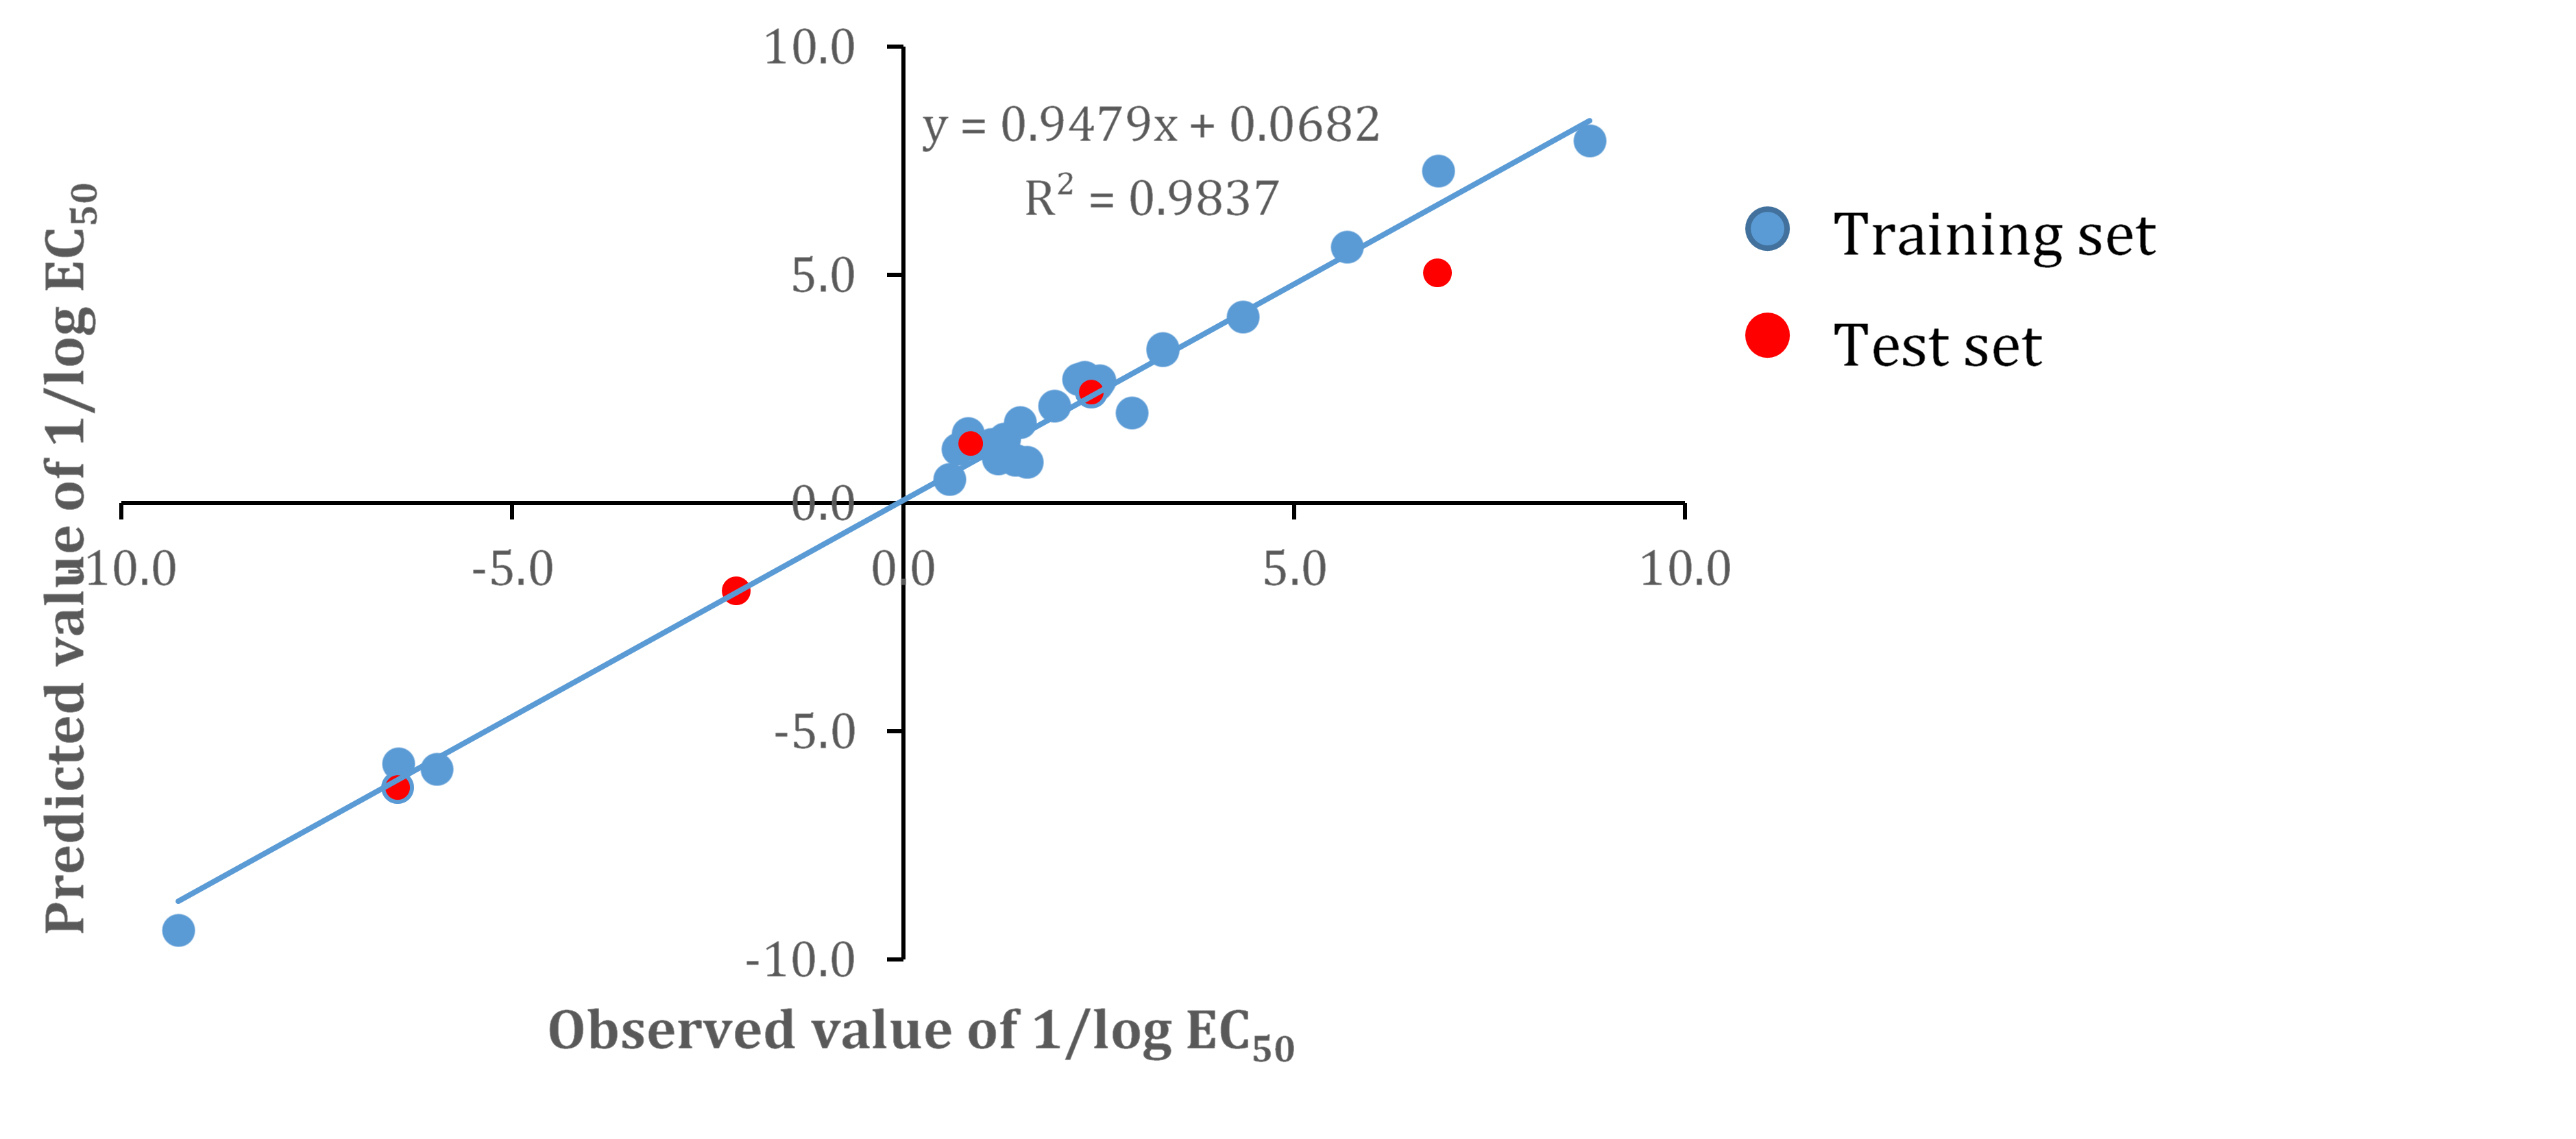
Figure 3. The plot of observed and predicted 1/log EC50 values of the whole set
Table 4 presents the residues between the observed and the calculated value of 1/log EC50 to all of the compounds in the dataset.
Table 4. Residues between observed and calculated 1/log EC50 values using model 4.
|
No |
1/log EC50 |
Residue |
No. |
1/log EC50 |
Residue |
||
|
Obs. |
Calc. |
Obs. |
Calc. |
||||
|
7 |
2.920 |
1.979 |
0.941 |
22 |
3.322 |
3.390 |
-0.068 |
|
8 |
0.700 |
1.188 |
-0.488 |
23 |
1.290 |
1.415 |
-0.125 |
|
9 |
1.580 |
0.899 |
0.681 |
24 |
1.490 |
1.776 |
-0.286 |
|
10 |
1.210 |
0.973 |
0.237 |
25 |
2.410 |
2.424 |
-0.014 |
|
11 |
3.320 |
3.348 |
-0.028 |
26 |
1.930 |
2.130 |
-0.200 |
|
12 |
0.590 |
0.535 |
0.055 |
27 |
2.480 |
2.596 |
-0.116 |
|
13 |
6.840 |
5.036 |
1.804 |
28 |
-2.130 |
-1.922 |
-0.208 |
|
14 |
1.431 |
0.957 |
0.474 |
29 |
-9.270 |
-9.360 |
0.090 |
|
15 |
1.130 |
1.303 |
-0.173 |
30 |
2.510 |
2.686 |
-0.176 |
|
16 |
-6.460 |
-5.705 |
-0.755 |
31 |
0.830 |
1.533 |
-0.702 |
|
17 |
5.680 |
5.617 |
0.063 |
32 |
4.339 |
4.083 |
0.256 |
|
18 |
2.240 |
2.719 |
-0.479 |
33 |
-5.970 |
-5.831 |
-0.139 |
|
19 |
-6.460 |
-6.242 |
-0.218 |
34 |
6.843 |
7.290 |
-0.446 |
|
20 |
8.780 |
7.950 |
0.830 |
35 |
0.870 |
1.302 |
-0.432 |
|
21 |
2.320 |
2.765 |
-0.445 |
|
|
|
|
Design, prediction of activity and synthesis route of new compounds
We have designed nine BA derivative compounds by replacing substituent R based on Model 4, to minimize topological and RDF properties, as well as to enhance the surface area of the compounds. The result was shown in Figure 5.
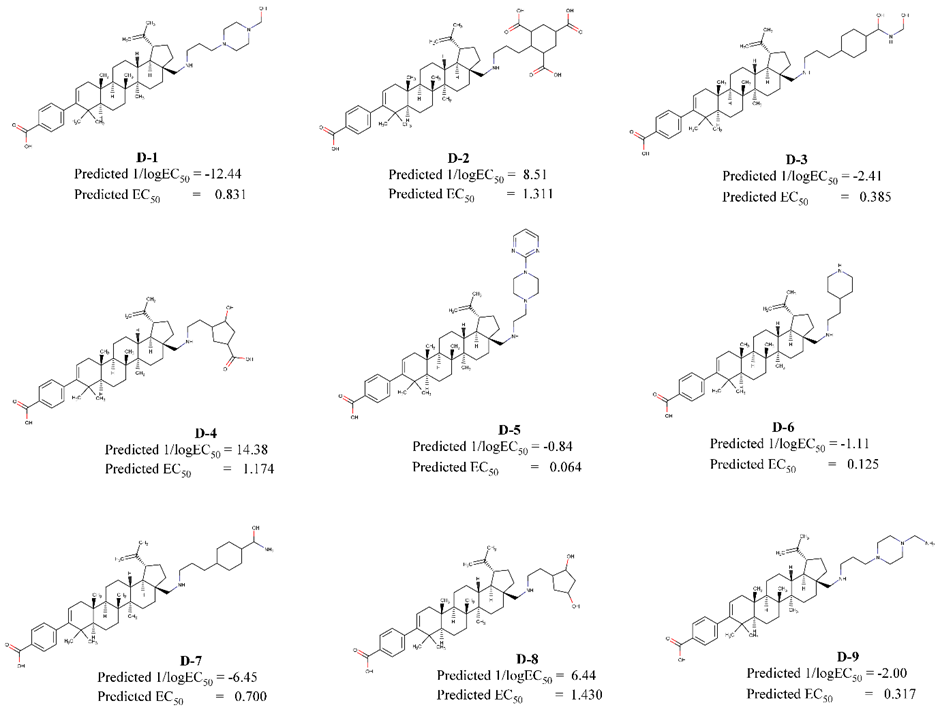
Figure 5. Designed compounds and their predicted activities.
William's plot between leverage and standardized residual values of the training set, test set, and the predicted compounds was shown in Figure 6. The critical value of leverage (h*) was 0.75, and the cut-off value of standardized residual was ± 3.
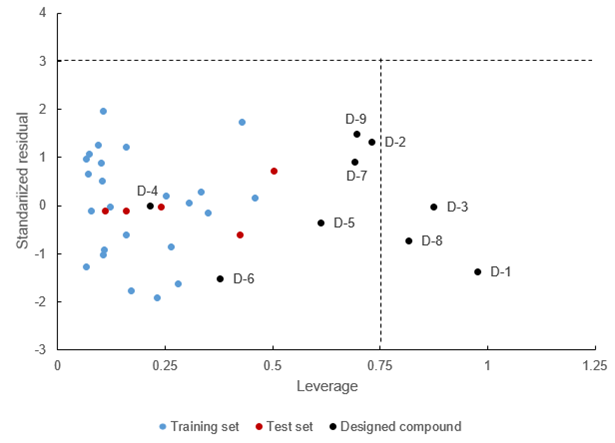
Figure 6. William’s plot between leverage and standardized residual values of the training set, test set and designed compounds.
The route to synthesize compound D-5 suggested based on literature (Chen et al., 2018) with the schematic synthetic route shown in Figure 7.
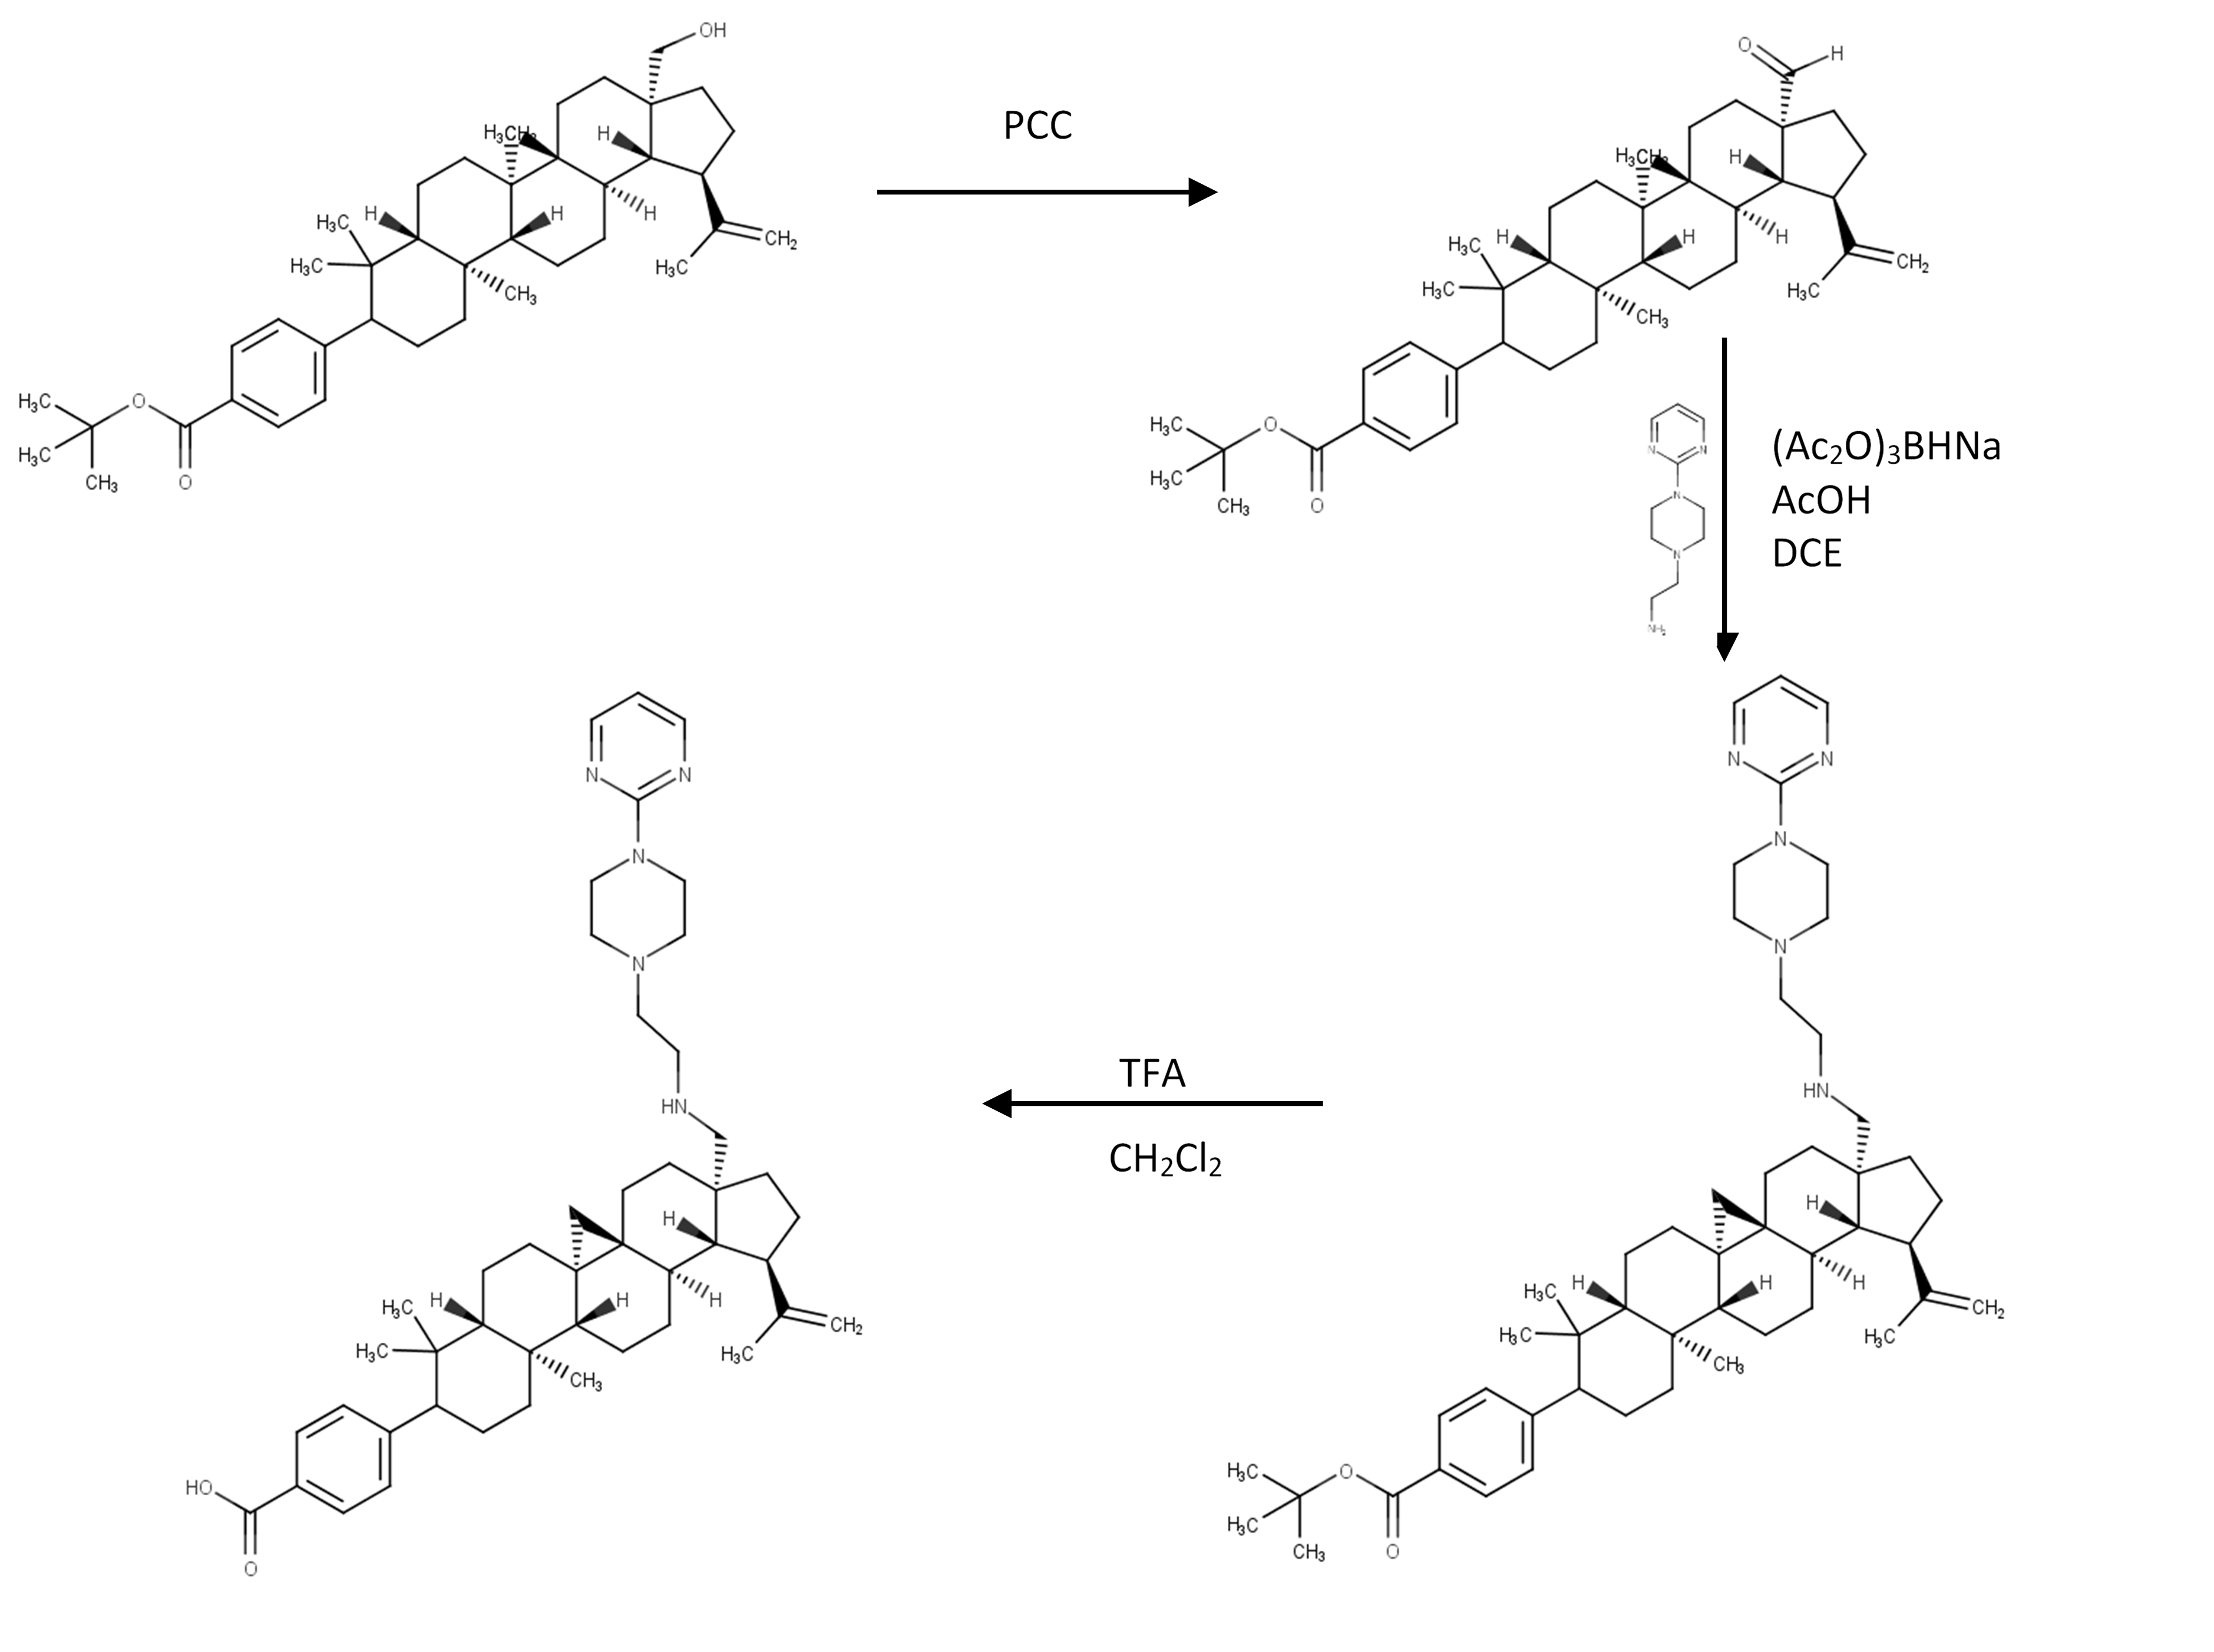
Figure 7. Suggested route of compound D-5 synthesis.
DISCUSSION
Descriptor calculation and selection
As listed in Table 3, the selected descriptors explained topological (2 descriptors), charged partial surface area, CPSA (2 descriptors) and radial distribution functions (4 descriptors). The TDB descriptors were achieved by summarizing the products of specific atom characteristics situated at certain topological distances. The topological distance Tij is the minimum number of bonds between two i and j atoms (Klein et al., 2004). On the other hand, CPSA descriptors encoding characteristics were responsible for polar molecular interactions. The molecular depiction used here considers that a molecule has a surface defined by the overlap of the hard-sphere, as defined by the atoms' van der Waals radii (Stanton et al., 1990). The RDF descriptors are based on the distribution of distances in a molecule's geometric representation and constitute a feature code for radial distribution. The radial distribution function of an ensemble of N atoms can formally be defined as the distribution of the probability of discovering an atom in a spherical volume of radius r (Todeschini and Consonni, 2000).
In general, the value of descriptors from compound 28 is lower than those in compound 12. As an exception, on surface area descriptors (PPSA-3 and FPSA-3), compound 28 has a higher value than 12. This indicates that surface area has an opposite effect on the HIV maturation activity. With higher surface area, a compound will more actively inhibit the HIV protease and SP1-Gag (has lower EC50 value).
Model development and validation
All of the models have a slightly similar r2 value as well as SEE value. However, on the F-value ratio, there is a significant difference between the four models. Due to that fact, Model 4 was chosen as it uses less number of a descriptor, making the model becomes simpler. Based on Model 4, we can mention that to have a more active compound (lower 1/logEC50 value), we have to bring down the value of TDB6u, RDF80e, FPSA-3, PPSA-3, but on the contrary, it brings up the RDF140u value. Since the coefficients on descriptors FPSA-3 and TDB6u were relatively much higher than the other descriptors, it indicated that the first two descriptors were the most contributing properties to the anti-HIV activity of BA derivative. Due to that fact, the more active BA derivatives must be had as lower as FPSA-3 and TDB6u values.
The number 0.9798 on r2test value of Model 4 can be interpreted as 97.98% accurate in the test set 1/log EC50 value prediction using the model. The other parameters to validate the model were the value of r2m and Q2 on test-set prediction. The calculation result shows that the value of r2m and Q2 for Model 4 was 0.9445 and 0.9644, respectively. Those values were higher than the required values (0.5) (Roy et al., 2015), so we concluded that Model 4 was valid statistically and can be used to design the new compounds.
As an addition, in Table 4 it can be seen that Model 4 can predict the 1/log EC50 values in good agreement with the observed values. Almost all of the predicted 1/log EC50 values have a similar number with the observed values, with the exception of compound 13, which has a more significant number of residues.
Design, prediction of activity and synthesis route of new compounds
We have designed BA derivative compounds by replacing substituent R based on model 4, to minimize topological and RDF properties, as well as to enhance the surface area of the compounds. The result was shown in Figure 5, where the 3 compounds have higher activities than compound 28 that was synthesized by Chen et al. (2018).
Among the 3 designed compounds, D-5 has the lowest EC50 value. In addition, it was 5-fold more active than compound 28. So, we concluded that compound D-5 was the best designed BA derivative compound with HIV-maturation inhibition activity. The standard name of D-5 is 4‐[(1R,3aR,5aR,5bR,7aS,11aR,11bS,13aS,13bS)‐5a,5b,8,8,11b‐pentamethyl‐1‐(prop‐1‐en‐2‐yl)‐3a-[({2‐[4‐(pyrimidin‐2‐yl)piperazin‐1‐yl]ethyl}amino) methyl]‐icosahydro‐1H‐cyclopenta[a] chrysen‐9‐yl]benzoic acid.
William's plot in Figure 6 shows that there are no outliers and essential data of the training and test set. However, there are three designed compounds (D-1, D-3, D-8) which assumed as the influential compounds due to they have higher leverage values than 0.75 but not as the outlier because values of standardized residual from those three compounds did not exceed the area between -3 and +3. Due to that facts, all of the designed compounds have reliable predicted 1/logEC value.
Figure 7 shows that the starting material to synthesize D-5 is compound S1, tert-butyl 4-((lR,3aS,5aR,5bR,7aR,l laS,l lbR,13aR,13bR)-3a-(hydroxymethyl)5a,5b,8,8,lla-pentamethyl-l-(prop-l-en-2-yl)-2,3,3a,4,5,5a,5b, 6,7,7a,8,ll,lla,llb, 12,13, 13a,13b-octadecahydro-lH-cyclopenta[a]chrysen-9-yl) benzoate) which can be added pyridinium chlorochromate (PCC) to oxidize the alcohol group into carboxylic acid. Those reaction resulting compound S2, tert-butyl 4-((1R,3aS,5aR,5bR,7aR,11aS,11bR,13aR,13bR)-3a-formyl-5a,5b,8,8,11a-pentamethyl-1-(prop-1-en-2-yl)-2,3,3a,4,5,5a,5b,6,7,7a,8,11,11a,11b,12,13, 13a,13b-octadecahydro-1H-cyclopenta[a]chrysen-9-yl)benzoate.
Then compound S2, the corresponding amine, and acetic acid should be mixed in 1,2-dichloroethane (DCE) and then added with sodium triacetoxyborohydride. The resulted mixture needs to be extracted with dichloromethane (DCM) and purified by flash chromatography. This procedure resulted in compound S3. The solution of C28 amine tert-butyl ester (S3) in DCM was added with trifluoroacetic acid (TFA). The crude product needs to purify by prep HPLC to give the desired benzoic acids (compound D-5).
CONCLUSION
A valid QSAR model based on HIV maturation inhibitory activity of 29 betulinic acid derivatives was developed using 3D descriptors (TDB6u, PPSA-3, FPSA-3, RDF140u, and RDF80e). The most contributing descriptors were FPSA-3 and TDB6u. The model has fulfilled the validation parameters such as r2training value of 0.7918; Q2test value of 0.9644; r2test value of 0.9798; and r2m-test value of 0.9445. Those models were used to design the new compounds and the best compound has IUPAC name of 4‐[(1R,3aR, 5aR,5bR,7aS, 11aR,11bS,13aS,13bS)‐5a,5b,8,8,11b‐pentamethyl‐1‐(prop ‐1‐en‐2‐yl)‐3a‐[({2‐[4(pyrimidine‐2‐yl)piperazin‐1-yl]ethyl}amino)methyl]‐icosahydro‐1H‐cyclopenta[a]chrysen‐9‐yl]benzoic acid. There are no outlier results has found based on applicability domain analysis.
REFERENCES
Aiken, C. and Chen, C., 2005. Betulinic acid derivatives as HIV-1 antivirals. Trends in Molecular Medicine. 11: 31-36.
Bildziukevich, U., Özdemir, Z., and Wimmer, Z. 2019. Recent achievements in medicinal and supramolecular chemistry of betulinic acid and its derivatives. Molecules. 24: 3546-3565.
Chen, Y., Sit, S., Chen, J., Swidorski, J.J., Liu, Z., Sin, N., Venables, B.L., Parker, D.D., Nowicka-Sans, B., Lin, Z., et al. 2018. The design, synthesis and structure-activity relationships associated with C28 amine-based betulinic acid derivatives as inhibitors of HIV-1 maturation. Bioorganic and Medicinal Chemistry Letters. 28: 1550-1557.
Datta, S.A.K., Clark, P.K., Fan, L., Harvin, D.P., Sowder, R.C., Nussinov, R., Wang, Y., and Rein, A. 2016. Dimerization of the SP1 region of HIV-1 Gag induces a helical conformation and association into helical bundles: Implications for particle assembly. Journal of Virology. 90: 1773-1787.
Freed, E.O., 2015. HIV-1 assembly, release and maturation. Nature Reviews Microbiology.13: 484-496.
Frimayanti, N., Yam, M.L., Lee, H.B., Othman, R., Zain, S.M., and Rahman, N.A. 2011. Validation of quantitative structure-activity relationship (QSAR) model for photosensitizer activity prediction. International Journal of Molecular Sciences. 12: 8626-8644.
Frisch, M.J., Trucks, G.W., Schlegel, H.B., Scuseria, G.E., Robb, M.A., Cheeseman, J.R., Scalmani, G., Barone, V., Petersson, G.A., Nakatsuji, H., et al. 2016. Gaussian 09. Revision A.02. Gaussian, Inc., Wallingford CT.
Gramatica, P., 2007. Principles of QSAR models validation: internal and external. QSAR & Combinatorial Science. 26: 694-701
Han, D., Su, M., Tan, J., Li, C., Zhang, X., and Wang, C., 2016. Structure-activity relationship and binding mode study for a series of diketo-acids as HIV integrase inhibitors by 3D-QSAR, molecular docking and molecular dynamics simulations. RSC Advances 6: 27594-27606.
Huang, Q., Chen, H., Luo, X., Zhang, Y., Yao, X., and Zheng, X. 2018. Structure and anti-HIV activity of betulinic acid analogues. Current Medical Science. 38: 387-397.
Jain, S.V., Ghate, M., Bhadoriya, K.S., Bari, S.B., Chaudhari, A., and Borse, J.S. 2012. 2D, 3D-QSAR and docking studies of 1,2,3-thiadiazole thioacetanilides analogues as potent HIV-1 non-nucleoside reverse transcriptase inhibitors. Organic and Medicinal Chemistry Letters. 2: 22-34.
Kang, C., Liu, D., Zhao, X., Dai, Y., Cheng J., and Lv, Y. 2016. QSAR and molecular docking studies on oxindole derivatives as VEGFR-2 tyrosine kinase inhibitors. Journal of Receptors and Signal Transduction. 36: 103-109.
Kashiwada, Y., Hashimoto, F., Cosentino, L.M., Chen, C., Garrett P.E., and Lee, K. 1996. Betulinic acid and dihydrobetulinic acid derivatives as potent anti-HIV agents. Journal of Medicinal Chemistry. 39: 1016-1017.
Klein, C.T., Kaiser, D., and Ecker, G. 2004. Topological distance-based 3D descriptors for use in QSAR and diversity analysis. Journal of Chemical Information and Computer Science. 44: 200-209.
Louis, J.M., Aniana, A., Weber, I.T., and Sayer, J.M. 2011. Inhibition of autoprocessing of natural variants and multidrug-resistant mutant precursors of HIV-1 protease by clinical inhibitors. Proceeding of National Academic Sciences. 108: 9072-9077.
Lv, Z., Chu, Y., and Wang, Y. 2015. HIV protease inhibitors: A review of molecular selectivity and toxicity. HIV/AIDS-Research and Palliative Care. 7: 95-104.
Mao, Y., Li, Y., Hao, M., and Zhang, S. 2012. Docking, molecular dynamics and quantitative structure-activity relationship studies for HEPTs and DABOs as HIV-1 reverse transcriptase inhibitors. Journal of Molecular Modeling. 18: 2185-2198.
Mercader, A.G., Duchowiz, P.R., and Sivakumar, P.M. 2016. Chemometrics applications and research: QSAR in medicinal chemistry. Apple Academic Press, Oakville.
Oliveira, D.B., and Gaudio A, C. 2000. BuildQSAR : a new computer program for QSAR analysis. Quantitative Structure-Activity Relationships: 599-601.
Ortiz, A., Soumeillant, M., Savage, S.A., Strotman, N.A., Haley, M., Benkovics, T., Nye, J., Xu, Z., Tan, Y., Ayers, S., Gao, S., and Kiau, S. 2017. Synthesis of HIV-maturation inhibitor BMS-955176 from betulin by an enabling oxidation strategy. Journal of Organic Chemistry. 82: 4958-4963.
R Core Team (2020). R: A language and environment for statistical computing. R Foundation for Statistical Computing, Vienna, Austria. URL: https://www.R-project.org/.
Roy, K., Kar, S., and Das, R.N., 2015. A Primer on QSAR/QSPR Modeling: Fundamental Concepts. Springer International Publishing, Heidelberg.
Shi, S., Zhang, S., and Zhang, Q. 2018. Insight into binding mechanisms of inhibitors MKP56, MKP73, MKP86, and MKP97 to HIV-1 protease by using molecular dynamics simulation. Journal of Biomolecular Structure and Dynamics. 36: 981-922.
Sousa, J.L.C., Freire, C.S.R., Silvestre, A.J.D., and Silva, A.M.S. 2019. Recent developments in the functionalization of betulinic acid and its natural analogues: A route to new bioactive compounds. Molecules. 24: 355-287.
Stanton, D.T., and Jurs, P.C., 1990. Development and use of charged partial surface area structural descriptors in computer-assisted quantitative structure-property relationship studies. Analytical Chemistry. 62: 2323-2329.
Todeschini, R., and Consonni, V., 2000. Handbook of Molecular Descriptors. Wiley-VCH, Weinheim.
Tong, J., Zhan, P., Wang, X.S., and Wu, Y. 2017. Quinolone carboxylic acid derivatives as HIV-1 integrase inhibitors: Docking-based HQSAR and topomer CoMFA analyses. Journal of Chemometrics. 31: e2934.
Yap, C.W., 2010. Software news and update PaDEL-Descriptor : An open-source software to calculate molecular descriptors and fingerprints. Journal of Computational Chemistry. 32: 1466-1474.
Zhao, H., Holmes, S.S., Baker, G.A., Challa, S., and Bose, H.S. 2012. Ionic derivatives of betulinic acid as novel HIV-1 protease inhibitors. Journal of Enzyme Inhibition and Medicinal Chemistry. 27: 715-721.
OPEN access freely available online
Chiang Mai University Journal of Natural Sciences [ISSN 16851994]
Chiang Mai University, Thailand
https://cmuj.cmu.ac.th
Ihsanul Arief1,2,3,*, Harno Dwi Pranowo1,2, Mudasir Mudasir1, and Karna Wijaya1
1 Department of Chemistry, Faculty of Mathematics and Natural Sciences, Universitas Gadjah Mada, Yogyakarta 55281, Indonesia
2 Austria-Indonesia Centre for Computational Chemistry (AIC), Department of Chemistry, Faculty of Mathematics and Natural Sciences, Universitas Gadjah Mada, Yogyakarta 55281, Indonesia
3 Akademi Farmasi Yarsi Pontianak, Pontianak 78232, Indonesia
Corresponding author: Insanul Arief, E-mail: ihsanul.arief@ugm.mail.ac.id
Total Article Views
Editor: Wasu Pathom-aree,
Chiang Mai University, Thailand
Article history:
Received: April 5, 2020;
Revised: June 17, 2020;
Accepted: August 31, 2020

