 ISSN: 2822-0838 Online

Increased Levels of De-oiled Perilla Seed Meal in Broiler Diets to Enhance n-3 Fatty Acid Proportions and Improve Efficiency Levels
Napatsorn Montha, Winai Yothinsirikul, Kanchit Chompupun, Michael Kreuzer, and Sanchai Jaturasitha*Published Date : 2020-12-17
DOI : https://doi.org/10.12982/CMUJNS.2021.015
Journal Issues : Number 1, January-March 2021
Abstract De-oiled perilla seed (Perilla frutescens L.), referred to as perilla meal, is rich in α-linolenic acid (C18:3 n-3). The purpose of this study was to investigate the efficiency of increasing levels of perilla meal in broiler diets to modify the fatty acid composition and other properties of meat quality. Two-hundred broilers were divided into five groups and fed diets with 0, 2, 4, 6, and 8% perilla meal. The breast and thigh meat of the broilers, slaughtered at 42 days of age, were subjected to in-depth physicochemical and sensory analyses. The results showed that perilla meal efficiently modified the fatty acid compositions of the lipids of both muscles. Saturated fatty acids declined, especially C14:0 and C16:0, whereas monounsaturated (MUFA) and polyunsaturated fatty acids (PUFA) increased significantly in both muscle groups. The C14:1, C16:1, and C18:3 n-3 levels were found to be significantly different between treatment groups, in which the highest values were noticed in the perilla meal groups. Small increases in n-6 fatty acids resulted in commensurate decreases in n-6:n-3 ratios. Increased C18:3 n-3 proportions, as well as extended oxidative stability, were observed particularly in the 2% perilla meal inclusion. Perilla meal also increased protein content and water holding capacity (WHC), and decreased fat content and shear force; whereas the sensory evaluations were unchanged in both portions of meat.
Keywords: Broiler meat, Meat quality, n-3 fatty acid, Perilla meal
Citation: Montha, N., Yothinsirikul, W., Chompupun, K., Michael Kreuzer, M., and Jaturasitha, S. 2021. Increased levels of de-oiled perilla seed meal in broiler diets to enhance n-3 fatty acid proportions and improve efficiency levels. CMUJ. Nat. Sci. 20(1): e2021015.
INTRODUCTION
Worldwide growth in the poultry meat sector has developed much faster than that of any other type of meat (Kanakri et al., 2017); especially in developing countries, and is expected to continue to rise (Speedy, 2003). Additionally, there are no religious restrictions on poultry consumption observed within any culture (Jaturasitha et al., 2016). Broiler meat represents an important source of protein, limited in saturated fatty acids (30 - 35%), and rich in polyunsaturated fatty acids (32%). While poultry has been determined to be healthier than red meat (Morales-Barrera et al., 2013), broilers fed standard diets produce lipid levels far from the values of that from marine sources, especially concerning n-3 polyunsaturated fatty acids (n-3 PUFA or omega-3 fatty acids) (Lee et al., 2019). These fatty acids are responsible for the mitigating prevalence of coronary heart disease, thrombosis, and Alzheimer’s disease (Kitajka et al., 2004). As a result, n-3 PUFA-enriched animal-source foods are regarded as functional foods. For this purpose, monogastric animals are more suitable than ruminants, as functional fatty acids can be directly accumulated in body fat, and easily modified by the strategic composition of the dietary fat (Boselli et al., 2008).
Attempts to enhance n-3 PUFA and to reduce n-6:n-3 fatty acid ratios have been made through the use of agroindustrial by-products and oilseeds, like linseed (Więcek et al., 2010; Tartrakoon et al., 2016), rapeseed (Kumar, 2018), perilla mint (Perilla frutescens L.), and perilla meal. As perilla seed by-product from oil extraction, perilla meal contains 54 to 64% C18:3 n-3 in its lipids (Asif, 2011), between 30 and 40% protein (Longvah and Deosthale, 1998), and various bioactive compounds (Gai et al., 2017). In Thailand, perilla oil extraction represents an emerging industry, with perilla seed production accounting for roughly 272 tons/year, with approximately 60% remaining as a residue after oil extraction (Joshi et al., 2017). Several studies have identified the effectiveness of enhanced n-3 PUFA in meat through the inclusion of perilla meal. In pigs, inclusions of 10 and 15% perilla meal increased n-3 PUFA proportions in pork lipids (Yamada et al., 2005); Saito et al., 2002; reported elevated n-3 PUFA proportions in egg yolks when the hens were fed diets containing 10% perilla oil (0.2 to 3.0 mg/100 mg egg yolk) and perilla meal (0.17 to 0.39 mg/100 mg egg yolk); and crossbred rabbits (Carmana grey x New Zealand) fed 10% perilla seed produced lower n-6:n-3 fatty acid ratios (Peiretti et al., 2011).
However, by-products from perilla oil production are quite limited in availability, are expensive, and its best usage has yet to be determined. The purpose of the present study was to quantify its efficiency in transferring C18:3 n-3 into broiler meat, as well as the supplementary effects on other fatty acids and various meat quality characteristics. Our tested hypotheses were: (i) perilla meal’s effect on meat quality (improvement); (ii) Perilla meal’s ability to modify the fatty acid profiles of broiler meat; and (iii) the enhancement of lipid stability of broiler meat in chickens fed perilla meal.
MATERIALS AND METHODS
Experiment design and procedure
The procedure in the present study was approved by the Ethics Committee on Animal Experimentation of Maejo University, Chiang Mai, Thailand
(no. MACUC016A/2559). A completely randomized design was adopted in this experiment. One-day old mixed-sex Cobb 500 broilers (n = 200) were divided into five dietary treatments, with four replications each. Each pen (2 × 1.5 × 2.5 m3) represented a single replication, ten broilers per replication, with average temperature and humidity of 30°C and 58%, respectively (summer). The experimental diets contained partially de-oiled perilla seed, further referred to as ‘perilla meal’, at levels of 0, 2, 4, 6, and 8 percent. The perilla meal used in this experiment contained 33.2% crude protein, 12.1% lipids (47.9% C18:3 n-3), and 36.0% crude fiber (through proximate analysis); and was obtained by cold press extraction, dried and ground to powder, and delivered in large sheets (Song et al., 2015). The ingredients and composition of each diet are given in Table 1. All diets were formulated to be isonitrogenous for the starter and finisher phases (23 and 20%, respectively), at levels recommended for broiler diets (Department of Livestock Development, 2004). The broilers were allowed ad libitum access to feed and water for the experiment period (42 days). The broilers fasted for four hours before the end of the experiment and were then slaughtered following the slaughtering process outlined by the Department of Livestock Development (2004). The left and right sides of the breast (M. pectoralis major) and thigh (M. iliotibialis) were collected from each broiler. Meat pH was measured at 45 minutes and 24 hours postmortem (pH 45 min and pH 24 hr. p.m.) in both muscles via a portable pH meter (SKF Technologies Inc., Cedar Rapids, IA, USA). Meat quality measurements included color, shear force, WHC, chemical composition, sensory evaluation, fatty acid profile, and lipid stability. Breast and thigh meat from the right side were dissected and stored at -20°C for chemical analyses, whereas the meat from the left side was analyzed for pH, color, and sensory evaluation.
Table 1. Ingredients, nutrient contents, and fatty acid compositions of the broiler diets.
|
Perilla (%) |
Starter diet (0-21 days of age) |
Finisher diet (22-42 days of age) |
||||||||
|
0 |
2 |
4 |
6 |
8 |
0 |
2 |
4 |
6 |
8 |
|
|
Ingredients (% as fed) |
|
|
|
|
|
|
|
|
|
|
|
De-oiled perilla seed (perilla meal) |
‒ |
2.00 |
4.00 |
6.00 |
8.00 |
‒ |
2.00 |
4.00 |
6.00 |
8.00 |
|
Soybean meal |
36.9 |
35.3 |
34.3 |
32.0 |
31.5 |
32.1 |
28.9 |
29.2 |
26.8 |
26.7 |
|
Maize |
39.4 |
39.1 |
38.2 |
38.4 |
36.3 |
46.8 |
46.0 |
44.9 |
43.6 |
43.1 |
|
Palm oil |
5.50 |
5.60 |
5.70 |
6.00 |
6.50 |
4.20 |
4.50 |
4.95 |
5.00 |
5.40 |
|
Rice bran |
15.0 |
15.0 |
15.0 |
15.0 |
15.0 |
15.0 |
15.0 |
15.0 |
15.0 |
15.0 |
|
Oyster shell meal |
1.25 |
1.20 |
1.20 |
1.20 |
1.20 |
0.30 |
0.30 |
0.30 |
0.30 |
0.30 |
|
Bone meal |
1.15 |
1.05 |
0.80 |
0.60 |
0.70 |
0.80 |
2.50 |
0.90 |
2.50 |
0.75 |
|
NaCl |
0.35 |
0.35 |
0.35 |
0.35 |
0.35 |
0.35 |
0.35 |
0.35 |
0.35 |
0.35 |
|
Mineral-vitamin premix1 |
0.25 |
0.25 |
0.25 |
0.25 |
0.25 |
0.25 |
0.25 |
0.25 |
0.25 |
0.25 |
|
L-Lysine HCl |
0.20 |
0.20 |
0.20 |
0.20 |
0.20 |
0.20 |
0.20 |
0.20 |
0.20 |
0.20 |
|
Composition (% of dry matter) |
|
|
|
|
|
|
|
|
|
|
|
Dry matter |
90.4 |
90.2 |
90.1 |
89.5 |
89.9 |
90.8 |
90.1 |
90.3 |
90.0 |
90.1 |
|
Organic matter |
89.8 |
89.5 |
89.0 |
88.3 |
88.0 |
87.9 |
87.8 |
87.0 |
87.2 |
87.4 |
|
Crude protein |
23.0 |
23.0 |
23.0 |
23.1 |
23.0 |
20.1 |
20.4 |
20.6 |
20.1 |
20.6 |
|
Ether extract |
9.24 |
9.02 |
10.4 |
10.6 |
11.3 |
7.09 |
8.00 |
8.45 |
9.87 |
10.6 |
|
Crude fiber |
3.13 |
3.50 |
3.92 |
4.00 |
4.20 |
3.01 |
3.51 |
3.69 |
4.02 |
4.19 |
|
Ca |
0.86 |
0.79 |
0.88 |
0.81 |
0.83 |
0.90 |
0.81 |
0.74 |
0.68 |
0.78 |
|
P |
0.57 |
0.58 |
0.60 |
0.55 |
0.54 |
0.71 |
0.71 |
0.86 |
0.76 |
0.72 |
|
Gross energy (MJ/kg) |
18.4 |
18.8 |
19.1 |
19.4 |
19.7 |
17.6 |
17.9 |
19.2 |
19.6 |
19.8 |
|
Fatty acid (FA) profile (% of total fatty acids) |
|
|
|
|
|
|
|
|
||
|
C14:0 |
12.1 |
14.7 |
16.4 |
12.7 |
12.3 |
13.1 |
14.5 |
15.6 |
14.3 |
13.6 |
|
C16:0 |
32.0 |
33.3 |
38.1 |
36.0 |
31.5 |
38.4 |
35.7 |
34.4 |
35.0 |
32.1 |
|
C18:0 |
2.01 |
2.45 |
2.87 |
5.02 |
5.24 |
2.21 |
2.28 |
2.32 |
4.13 |
4.38 |
|
C18:1 n-9 |
38.6 |
30.4 |
22.4 |
18.6 |
16.4 |
30.8 |
29.9 |
28.8 |
17.8 |
18.4 |
|
C18:2 n-6 |
14.9 |
15.8 |
17.4 |
22.7 |
27.2 |
14.3 |
15.6 |
16.5 |
24.3 |
26.0 |
|
C18:3 n-3 |
0.79 |
1.67 |
2.76 |
5.12 |
7.41 |
0.48 |
1.33 |
1.87 |
4.58 |
5.47 |
|
Saturated FA |
46.0 |
50.7 |
57.8 |
53.7 |
49.4 |
53.9 |
52.4 |
51.8 |
53.4 |
50.2 |
|
Mono-unsaturated FA |
38.6 |
30.4 |
22.4 |
18.6 |
16.4 |
30.8 |
29.9 |
28.8 |
17.8 |
18.4 |
|
Poly-unsaturated FA |
15.3 |
17.4 |
20.2 |
27.9 |
34.7 |
14.8 |
17.0 |
18.8 |
28.7 |
31.5 |
|
n-6:n-3 FA ratio |
18.2 |
9.62 |
6.12 |
4.33 |
3.78 |
29.4 |
11.5 |
8.76 |
5.27 |
4.77 |
Note: 1Composed, per kg, of Co, 0.08 g; Cu, 1.6 g; Fe, 16 g; I, 0.17 g; Mg, 12.2 g; Zn, 8 g; Se, 0.06; vitamin A, 400,000 IU; vitamin B1, 200 mg; vitamin B2, 300 mg; vitamin B6, 300 mg; niacin, 1500 mg; calcium pantothenate, 500 mg; folic acid, 5.5 mg; vitamin B12, vitamin D3, 100,000 IU; vitamin E, 750 mg; vitamin K3, 75 mg, 1 mg; biotin, 5 mg.
Analysis of meat quality
Water-holding capacity (WHC) was determined in both muscles by determining both substance loss and drip loss (Honikel, 1987). Meat samples were weighed and hanged in polyethylene bags for 24 hours at 4°C and weighed a second time to determine the drip loss. The meat samples were then sealed in heat-resistant plastic bags and boiled in a Korimat autoclave (Model 120/1.6, Christian Wanger, Esslingen, Germany) at 80°C until a core temperature of 70°C was reached. The temperature was controlled by a thermocouple (Consort T851, Cohasset, MA, USA). Cooking losses were eventually measured after the samples cooled to room temperature, and the surfaces had been dried with soft paper.
Shear force measurement was performed according to Zhuang and Savage, 2009; in which C-strip samples of the breast meat and the A and B muscles of the thigh were boiled and cut (Figure 1). Samples were sheared using a TA-XT Plus Texture Analyzer (Stable Micro Systems, London, UK) equipped with a Warner-Bratzler test cell. In this process, the muscles were sliced at a constant speed of 2.0 mm/s with a 45° angle inverted knife. The maximum shear force values were recorded, wherein the data were averaged for each muscle type before statistical analysis.
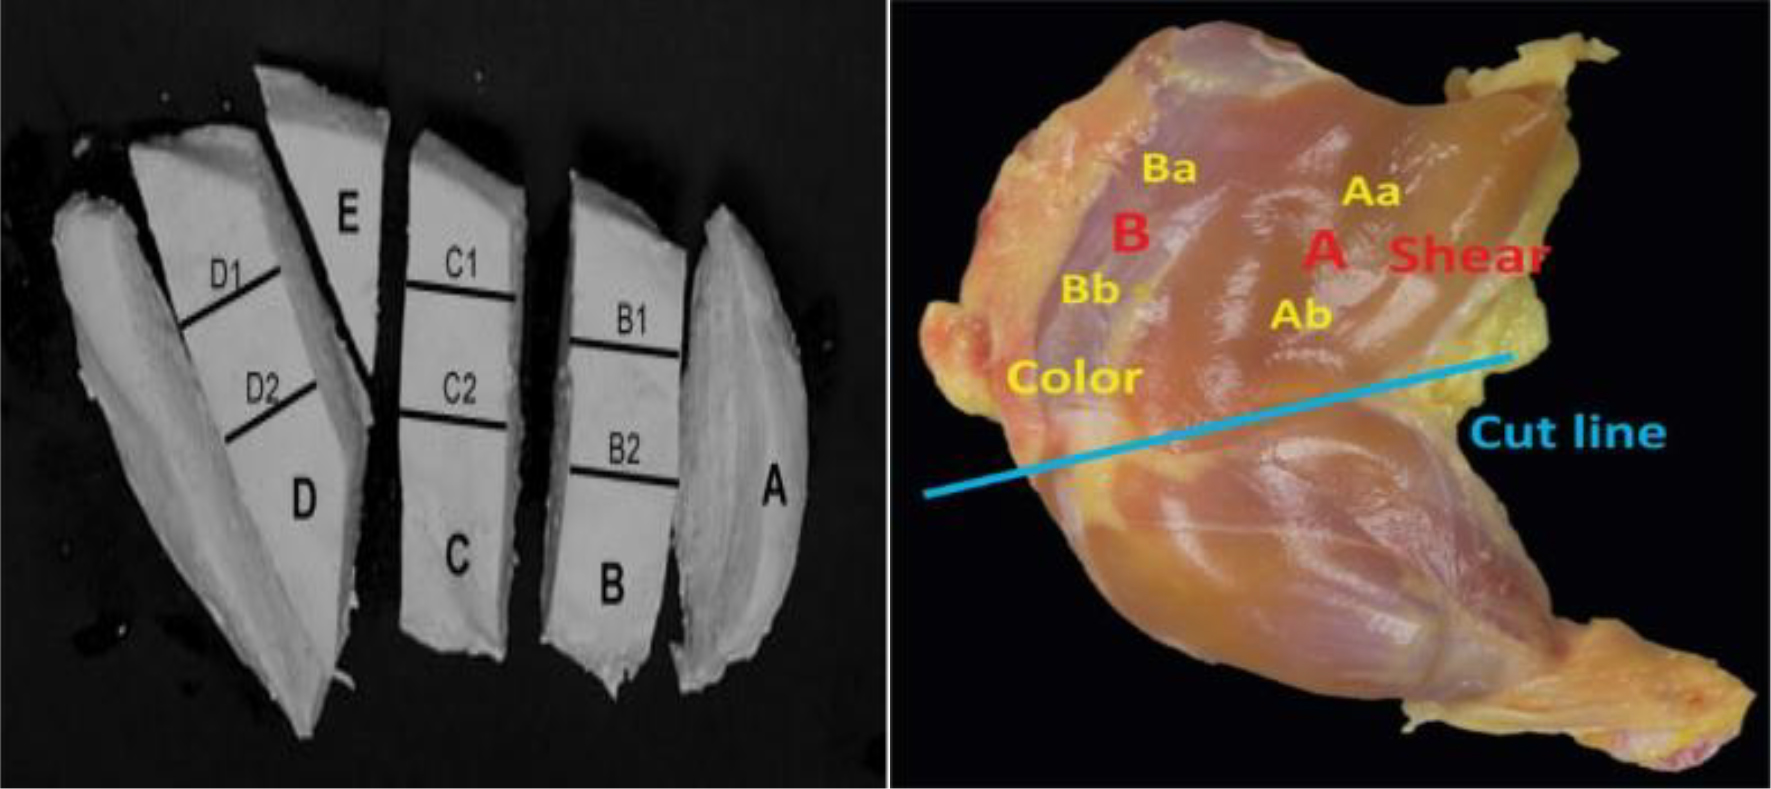
Figure 1. The position of breast and thigh muscle for shear force measurement (adapted from Zhuang and Savage, 2009; Zhuang et al., 2014).
Color measurement was made on the surface area (one hour after blooming) of breast and thigh meat in three replications. Color space was then determined by the method prescribed by Jaturasitha, 2004; [L* = Lightness, where white = 100, and black = 0; a* = redness, where green = 80, and red = 100; and b* = yellowness, where blue = 50, and yellow = 70] on three sites per muscle, via a Minolta Chroma Meter CR-400 (Minolta Camera Co., Osaka, Japan) (Table 2).
Chemical analysis of the breast and thigh meat samples were analyzed for moisture, protein, and ether extract contents following the procedures stated in the AOAC, 2005.
Table 2. Effects of perilla meal at different levels in broiler diets on chemical composition, meat quality, and sensory evaluation (breast muscle).
|
Breast Meat Criteria |
Treatment groups |
SEM1 |
P-value |
||||
|
PM0 |
PM2 |
PM4 |
PM6 |
PM8 |
|||
|
Color |
|
|
|
|
|
|
|
|
L* |
53.8a |
50.6b |
51.4b |
51.9b |
48.3c |
2.123 |
0.000 |
|
a* |
1.91b |
2.45a |
2.24a |
2.18a |
2.70a |
1.319 |
0.003 |
|
b* |
9.30c |
10.9b |
11.5a |
10.3b |
11.6a |
1.722 |
0.008 |
|
pH |
|
|
|
|
|
|
|
|
pH45 min. p.m. |
6.34d |
6.43b |
6.46a |
6.42c |
6.44b |
0.325 |
0.020 |
|
pH24 hr. p.m. |
5.77b |
5.78b |
5.80b |
5.89a |
5.83ab |
0.355 |
0.025 |
|
Water holding capacity (% fresh meat |
|||||||
|
Drip loss |
4.45a |
3.72b |
2.61c |
2.48c |
2.31c |
1.381 |
0.043 |
|
Cooking loss |
40.5a |
28.0b |
22.3c |
25.0bc |
25.3bc |
2.536 |
0.000 |
|
Shear force (N) |
71.7a |
72.9a |
55.1ab |
56.6ab |
48.2b |
16.19 |
0.013 |
|
Chemical composition (% fresh meat) |
|||||||
|
Moisture |
74.5 |
74.1 |
74.0 |
74.0 |
73.5 |
0.653 |
0.069 |
|
Protein |
24.5b |
23.5c |
26.2a |
24.3b |
25.7a |
0.655 |
0.000 |
|
Ether extract |
0.68a |
0.63a |
0.51b |
0.50b |
0.42b |
0.201 |
0.039 |
|
Sensory test (1-9 score, n = 8) |
|||||||
|
Aroma2 |
5.94 |
5.75 |
6.13 |
6.31 |
6.25 |
1.767 |
0.894 |
|
Flavor2 |
6.44 |
6.00 |
6.88 |
6.75 |
6.75 |
1.441 |
0.433 |
|
Texture2 |
6.00 |
6.13 |
6.69 |
6.56 |
6.44 |
1.604 |
0.716 |
|
Off-flavor3 |
2.81 |
2.31 |
1.94 |
2.00 |
2.25 |
1.591 |
0.556 |
|
Overall acceptability2 |
7.44 |
8.50 |
8.69 |
7.56 |
8.68 |
1.763 |
0.081 |
Note: 1SEM: Standard error of the mean.
2Sensory test: score on a scale of 1 (low) to 9 (high). 1 = extremely dislike; 2 = dislike very much 3 = dislike moderately; 4 = dislike slightly; 5 = neither like nor dislike; 6 = like slightly; 7 = like moderately; 8 = like very much; 9 = extremely like.
3sensory test: score on a scale of 1 (low) to 9 (high) for off-flavor. 1 = weak, extreme off-flavor; 2 = weak, very off-flavor; 3 = weak, slight off-flavor; 4 = weak, moderate off-flavor; 5 = neither strong nor weak off-flavor; 6 = strong, slight off-flavor; 7 = strong, moderate off-flavor; 8 = strong, very off-flavor; 9 = strong, extreme off-flavor.
a-c means in the same row with different superscripts differ significantly (P < 0.05).
Fatty acid analysis: lipids were extracted from the meat using a methanol – chloroform mixture (2:1) (Folch et al., 1957). Fatty acids were analyzed by gas chromatography, and methyl esters were prepared according to Morrison and Smith, 1964. Gas chromatographic analysis was carried out via a GC-14B (Shimadzu, Kyoto, Japan) equipped with a 0.25 mm × 30 m × 0.25 µm wall-coated fused wax capillary column, and helium as a carrier gas. The oven temperature was increased from 50 to 220°C at 10°C/min, maintained for 35 minutes, increased at 5°C/min from 220 to 230 °C, and then held at 230°C for 20 minutes. Injector and detector temperatures were set at 250°C. The standard used was a fatty acid methyl ester mix of 37 fatty acids (Supelco 37, Bellefonte, PA, USA). Chromatograms were processed using the Millenium (2010) Chromatography Manager (Millipore, Milford, Massachusetts, USA).
Oxidative stability measurement of the broiler meat was assessed through TBARs assay, expressed as milligrams of malondialdehyde per kilogram of fresh meat (Sinnhuber, 1958). Absorbance was determined at 532 nm via a spectrometer.
The sensory assessment involved eight trained panelists, consisting of students and faculty members, performing sensory evaluations according to the prescribed ISO standards (ISO, 2012). The meat was boiled for 30 minutes at 80°C and cut into 1.5 cm cubes. The samples were placed on preheated plates, covered with aluminum foil (Becker et al., 2016), and served to each panelist in each session, in random order concerning the dietary treatment group. Panelists were asked to grade the samples based on the aroma, flavor, off-flavor, texture, and overall acceptability as attributes on a scale from 1 to 9. Likeability was rated as: 1 = extremely dislike; 2 = dislike very much 3 = dislike moderately; 4 = dislike slightly; 5 = neither like nor dislike; 6 = like slightly; 7 = like moderately; 8 = like very much; 9 = extremely like; and off- flavor was rated as: 1 = weak, extreme off-flavor; 2 = weak, very off-flavor; 3 = weak, slight off-flavor; 4 = weak, moderately off-flavor; 5 = neither strong nor weak off-flavor; 6 = strong, slight off-flavor; 7 = strong, moderate off-flavor; 8 = strong, very off-flavor; 9 = strong, extreme off-flavor (table 2).
Statistical analysis
All statistical analyses were performed by analysis of variance using SAS v.6.12, 1996 (SAS Inst. Inc., Cary, NC, USA). The diets were considered to be a fixed effect, and the birds (40 per treatment) were treated as the experimental unit. The TBARS model contained both the diet grouping and day of storage. Data of the sensory evaluations received from the eight panelists were averaged before statistical analysis. Differences among treatment means were compared using Duncan’s New Multiple Range Test and were deemed significant at P < 0.05.
RESULTS
Effects of perilla meal on meat quality
Breast meat: The effects of perilla meal on breast meat quality are presented in Table 2. The pH at 45 minutes and 24 hours p.m, was lowest in the 0 and 2% perilla meal groups (P < 0.05). Drip and cooking losses were decreased with increased levels of perilla meal. The shear force value (N) was significant (P < 0.05) between the treatment groups. The values for the 0 and 2% perilla meal inclusions (71.7 and 72.9 N, respectively) were significantly higher than those of the 4, 6, and 8% groups. The lightness (L*) values within the 8% perilla meal group was lower than the other groups, whereas redness (a*) and yellowness (b*) showed a positive correlation with increases in perilla meal across all diets (P < 0.05). The chemical compositions of the breast meat were influenced differently across each group. Protein contents of the breast meat were significantly higher in the 4 and 6% groups (P < 0.05), which may be attributable to the breast meat’s lower fat content. We also observed no significant effects upon moisture content or within the results of the sensory evaluation of the breast meat across all dietary inclusions (Table 2).
Thigh meat: The pH values at 45 minutes and 24 hours post mortem were lowest in the 2% perilla meal group. Cooking losses for the thigh muscle were significantly affected by the perilla meal inclusions; wherein losses were reduced with increasing levels of perilla meal. No significant differences in drip loss were observed among all treatment groups (P = 0.05). Shear force values (N) within the thigh muscle were lowest (P = 0.077) in the higher perilla meal inclusions. No significant differences were found in thigh meat color in all groups. The protein contents of the thigh meat were significantly higher (P < 0.05) with each increase in perilla meal. Conversely, the fat content of thigh meat was significantly decreased (P = 0.04). Moreover, there were no statistically significant differences in moisture content across all groups, nor did any inclusion percentage affect the sensory attributes of the thigh meat. The data further showed that there were no significant differences between all groups regarding aroma, flavor, off-flavor, texture, and overall acceptability (Table 3).
Table 3. Effects of perilla meal at different levels in broiler diets on chemical composition, meat quality, and sensory evaluation (thigh muscle).
|
Thigh Criteria of thigh |
Treatment groups |
SEM1 |
P-value |
||||
|
PM0 |
PM2 |
PM4 |
PM6 |
PM8 |
|||
|
Color |
|
|
|
|
|
|
|
|
L* |
50.4 |
50.5 |
49.7 |
48.5 |
50.3 |
2.762 |
0.601 |
|
a* |
5.80 |
5.28 |
5.33 |
5.97 |
5.15 |
1.955 |
0.548 |
|
b* |
6.64 |
6.39 |
6.32 |
6.83 |
6.98 |
1.607 |
0.166 |
|
pH |
|
|
|
|
|
|
|
|
pH45 min. p.m. |
6.57a |
6.42b |
6.56a |
6.59a |
6.56a |
0.194 |
0.002 |
|
pH24 hr. p.m. |
5.97a |
5.73c |
5.84b |
5.75bc |
5.78bc |
0.209 |
<0.001 |
|
Water hold capacity (% fresh meat) |
|||||||
|
Drip loss |
3.37 |
2.78 |
2.77 |
2.24 |
2.34 |
2.431 |
0.234 |
|
Cooking loss |
25.3a |
25.0a |
22.3ab |
22.0ab |
20.3b |
2.255 |
0.031 |
|
Shear force (N) |
20.0b |
31.4a |
17.0b |
23.8ab |
21.1ab |
05.60 |
0.078 |
|
Chemical composition (% fresh meat) |
|||||||
|
Moisture |
73.6 |
73.7 |
73.8 |
73.3 |
73.2 |
1.018 |
0.678 |
|
Protein |
19.0b |
18.7b |
19.1b |
22.1a |
21.4a |
0.698 |
<0.001 |
|
Ether extract |
2.46ab |
2.30a |
1.98b |
1.82b |
1.90b |
0.615 |
0.011 |
|
Sensory test (1-9 score, n = 8) |
|||||||
|
Aroma2 |
4.94 |
4.75 |
5.13 |
5.31 |
5.19 |
1.750 |
0.906 |
|
Flavor2 |
5.44 |
5.00 |
5.88 |
5.75 |
5.75 |
1.440 |
0.433 |
|
Texture2 |
6.00 |
6.50 |
6.88 |
6.81 |
6.56 |
1.497 |
0.495 |
|
Overall acceptability2 |
6.38 |
6.38 |
7.13 |
7.06 |
6.69 |
1.231 |
0.251 |
Note: 1SEM: Standard error of the mean.
2Sensory test: score on a scale of 1 (low) to 9 (high). 1 = extremely dislike; 2 = dislike very much 3 = dislike moderately; 4 = dislike slightly; 5 = neither like nor dislike; 6 = like slightly; 7 = like moderately; 8 = like very much; 9 = extremely like.
3sensory test: score on a scale of 1 (low) to 9 (high) for off-flavor. 1 = weak, extreme off-flavor; 2 = weak, very off-flavor; 3 = weak, slight off-flavor; 4 = weak, moderate off-flavor; 5 = neither strong nor weak off-flavor; 6 = strong, slight off-flavor; 7 = strong, moderate off-flavor; 8 = strong, very off-flavor; 9 = strong, extreme off-flavor.
a-c Means in the same row with different superscripts differ significantly (P < 0.05).
Effects of perilla meal upon the modification of fatty acid profiles of broiler meat
Breast meat: The fatty acid compositions, expressed as a percentage of the total fatty acids within the broiler breast meat, revealed significant differences between each treatment group (P < 0.001) (Table 4). The C14:0 and C16:0 proportions significantly decreased with increasing levels of perilla meal. There were no statistically significant differences in C16:0 proportions between the 6 and 8% perilla meal inclusions; however increases in C14:1, C18:1 n-9, C18:2 n-6, C18:3 n-3, MUFA, PUFA, and total omega-3 fatty acid proportions in breast meat were observed with increasing levels of perilla meal. The n-6:n-3 fatty acid ratio was lowest in broilers fed the 8% perilla diet (P < 0.001) , compared with those of the control, 2, 4, and 6% inclusions, which were not significantly different between groups.
Thigh meat: Significant differences (P < 0.05) were observed in the fatty acid proportions in thigh meat across all treatments (Table 5). Broilers fed perilla meal inclusions had lower (P < 0.001) proportions of C14:0, C16:0, and total SFA than that of the control group; however, no significant differences (P > 0.05) were observed in C18:0 contents among all treatments. The dietary perilla meal treatments increased C14:1, C18:2 n-6, C18:3 n-3, MUFA, and PUFA proportions of thigh meat compared to the control treatment (P < 0.001). The perilla meal inclusions also decreased n-6:n-3 fatty acid ratios (P < 0.001).
Table 4. Fatty acid compositions (percentage of total analyzed fatty acids) of broilers fed varying levels of perilla meal (breast meat).
|
Fatty acid (breast meat) (% of total fat) |
Treatment groups |
SEM1 |
P-value |
||||
|
PM0 |
PM2 |
PM4 |
PM6 |
PM8 |
|||
|
C14:0 |
15.0a |
13.2b |
11.7b |
8.52c |
5.95d |
3.699 |
<0.001 |
|
C14:1 |
9.51e |
18.4d |
20.1c |
23.2b |
27.9a |
7.636 |
<0.001 |
|
C16:0 |
18.1a |
17.1b |
15.3c |
10.3d |
11.0d |
9.732 |
<0.001 |
|
C16:1 |
3.87a |
3.29b |
2.28c |
2.75c |
2.56c |
0.529 |
<0.001 |
|
C18:0 |
6.45a |
6.03a |
4.65b |
5.98a |
6.59a |
0.724 |
<0.001 |
|
C18:1 n-9 |
24.1d |
26.8c |
28.6b |
30.4a |
27.2e |
0.826 |
<0.001 |
|
C18:2 n-6 |
11.8d |
11.6d |
13.7b |
14.6a |
12.5c |
0.824 |
<0.001 |
|
C18:3 n-3 |
0.42c |
1.55b |
1.83b |
2.53a |
2.80a |
0.269 |
<0.001 |
|
C23:0 |
1.18b |
2.22a |
1.84a |
1.88a |
1.55ab |
0.542 |
0.006 |
|
SFA |
48.0a |
38.6b |
33.5c |
26.7d |
25.0e |
6.554 |
0.028 |
|
MUFA |
40.1d |
48.5c |
51.0b |
56.4a |
57.7a |
5.216 |
<0.001 |
|
PUFA |
12.2d |
13.2c |
15.5b |
17.1a |
17.3a |
3.868 |
<0.001 |
|
n-6:n-3 |
28.1a |
7.48b |
7.49b |
5.77c |
4.46c |
1.583 |
<0.001 |
Note: 1SEM: Standard error of the mean.
a-e Means in the same row with different superscripts differ significantly (P < 0.05).
Table 5. Fatty acid compositions (percentage of total analyzed fatty acids) of broilers fed varying levels of perilla meal (thigh meat).
|
Fatty acids (thigh meat) (% of total fat) |
Treatment groups |
SEM1 |
P-value |
||||
|
PM0 |
PM2 |
PM4 |
PM6 |
PM8 |
|||
|
C14:0 |
18.7a |
10.1e |
15.1b |
13.5c |
12.1d |
0.665 |
<0.001 |
|
C14:1 |
7.32d |
14.8c |
20.6b |
23.9a |
19.3b |
0.634 |
<0.001 |
|
C16:0 |
17.4a |
16.5b |
15.1c |
14.5c |
16.6b |
0.697 |
<0.001 |
|
C16:1 |
3.80a |
3.49ab |
2.80bc |
2.38c |
2.88bc |
0.692 |
0.002 |
|
C18:0 |
4.62 |
4.16 |
3.67 |
3.59 |
3.81 |
0.785 |
0.073 |
|
C18:1 n-9 |
36.1a |
34.0b |
28.1d |
25.0e |
29.8c |
0.673 |
0.001 |
|
C18:2 n-6 |
11.8c |
14.6a |
12.3bc |
14.6a |
13.0b |
0.807 |
0.001 |
|
C18:3 n-3 |
ND2 |
1.33c |
1.71b |
2.73a |
2.53a |
0.301 |
0.001 |
|
C23:0 |
0.90b |
1.09a |
0.74b |
ND2 |
ND2 |
0.169 |
0.002 |
|
SFA |
41.6a |
31.9c |
34.6b |
31.6c |
32.5c |
1.629 |
0.001 |
|
MUFA |
47.2b |
52.3a |
51.5a |
53.3a |
52.0a |
1.244 |
0.001 |
|
PUFA |
11.8b |
15.9a |
14.0b |
15.3a |
15.5a |
0.937 |
0.001 |
|
n-6:n-3 |
ND2 |
11.0a |
7.20b |
5.34c |
5.13c |
1.211 |
0.001 |
Note: 1SEM: Standard error of the mean.
2ND: not detected
a-e Means in the same row with different superscripts differ significantly (P < 0.05)
Enhancement of lipid stability
The oxidative stabilities of breast and thigh meat were evaluated at six days of storage and expressed as mg MDA/kg of fresh meat (Figure 2).
The TBARS values of breast meat showed no significant differences on Day 1 of storage. After that, the TBARS values within the 4, 6, and 8% perilla meal groups ranged from 0.29 to 0.50 mg (Figure 2A), which was significantly lower than those of the control and 2% perilla meal diets.
The highest TBARS values for thigh meat were found at storage initiation within the control group, whereas the lowest values were reported in the 8% perilla meal group. Notably, the values increased as storage time increased (Figure 2B).
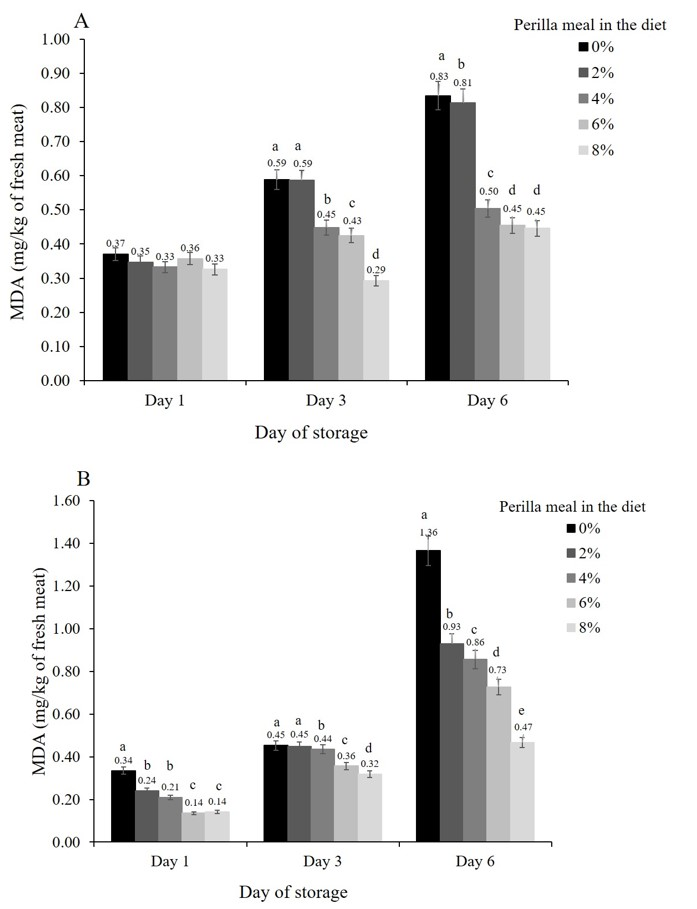
Figure 2. Increases over time of the malondialdehyde concentrations in the breast meat (A) and thigh meat (B), depending on the proportion of perilla meal in each diet.
DISCUSSIONS
Effects of perilla meal on meat quality
There were several significant differences in physicochemical meat properties between diet groups, including pH45 min and pH 24 hr. p.m., WHC, shear force, and color of breast and thigh meat. The changes in these traits were moderate, or not at all systematically changing with the perilla proportions of each diet. All of these traits are strongly determined by genetics and antemortem management. They are only rarely affected by nutrition and, if so, only to a small extent. Alagawany et al., 2019; for example, determined an improvement in WHC when chickens received various n-3 fatty acid sources. Other, more substantial effects, were observed, like the reduction of drip and cooking losses and shear force in breast and thigh meat. The decline in L* and the increase in a* of breast meat seemed to coincide with lower pH, increased water loss, and shear force (Betti et al., 2009). The control group, without the benefit of perilla meal, revealed the lowest pH 45 min., resulting in protein denaturation and decreased WHC. The meat pigment diluted, which led to its lighter color.
Contrastingly, the nutrient compositions of the meat may be affected by nutrition, albeit slightly, where moisture and protein is concerned. Omidi et al., 2020; found a linear decrease in body fat retention in broilers fed sunflower oil. Fat deposition in tissues appears to depend on the utilization of dietary fat, as well as both endogenous fat synthesis and fat catabolism (Ravindran et al., 2016; Ahmed et al., 2017). Rats fed safflower oil instead of tallow exhibited a higher rate of muscle β-oxidation for unsaturated fatty acids (UFA) than for saturated fatty acids (SFA) (Raj et al., 2017). Carnitine palmitoyltransferase I activity was higher in the heart and skeletal muscles of Wistar rats fed a diet rich in unsaturated fatty acids (Power et al., 1997). Carnitine palmitoyltransferase I is a mitochondrial enzyme responsible for the formation of acylcarnitines by catalyzing the transfer of the acyl group of long-chain fatty acyl-CoA, accounting for a decrease in fat content and an increase in protein proportions in meat muscles. Moreover, protein can attract and hold water, due to its excess of negative charges on a protein that attracts the positively charged areas of water molecules (Castellini and Dal Bosco, 2017). The perilla meal groups presented the highest protein content, as well as the highest WHC.
Efficiency of perilla meal
The fatty acids of tissue and body fat in monogastric animals accumulate through the metabolism of hepatic lipogenesis and the dietary fatty acid profile (Crespo et al., 2002). In poultry, de novo lipogenesis occurs by hepatic lipogenesis from dietary carbohydrates; reactions catalyzed by both glucose-6-phosphate dehydrogenase and malic enzymes (Alvarez et al, 2000). They are then transported by chylomicrons as very-low-density lipoproteins, which are deposited in the tissue (Mourot and Hermier, 2001) or oxidized to generate energy (Ferrini et al., 2010). In contrast, if chickens consume a diet high in fat content, the hepatic lipid synthesis will be inhibited, as endogenous lipogenesis occurs from a reduction in dietary starch, then replaced by fat (Mourot and Hermier 2001). We may conclude that fatty acids in tissue depend on their accumulation in the diet by transport from the small intestine to the tissue body, which is carried by chylomicrons via the lymphatic system, through the blood circular system, to the liver and body tissues (Dixon, 2010).
Total SFA proportion tended to go down, and total PUFA proportion was elevated in the perilla meal groups for both breast and thigh meats (P < 0.05). The n-6:n-3 fatty acid ratios were affected in both the breasts and thighs, with the highest value being observed in the control group and lowest in the 6% and 8% perilla meal diets (P < 0.001). The fatty acid composition of poultry meat can be modified through dietary management, especially fat and lipid compositions (Duran-Montgé et al., 2007). The SFA proportion in poultry meat depend on the presence of fatty acids in the diet, and synthesis in the liver (Jung et al., 2010). The synthesis of fatty acids is inhibited in the liver to a greater extent during the digestion of unsaturated fats, versus saturated fats (Sim and Qi, 1995).
Increases in n-3 fatty acids in broiler meat fat through the dietary supplement of n-3 fatty acids have been demonstrated repeatedly, with beneficial enrichments detected within a week (Konieczka et al., 2017). N-3 fatty acids are not synthesized by the birds but are obtained from their diets (Pinchasov and Nir, 1992). Consequently, n-3 and n-6 PUFA are generated by the Δ-5 and Δ-6 desaturase enzyme, stimulated by n-3 PUFA and a balance of the n-6:n-3 fatty acid ratio (Araya et al., 2004). Similar findings were revealed in the study of Zhang et al., 2017; who found higher C18:3 n-3 contents in broilers fed linseed oil. Moreover, our results presented higher C18:3 n-3 and PUFA levels in breast meat than in thigh meat lipids; as PUFA are preferentially incorporated into phospholipids (Hulan et al., 1988), which are in higher proportions in breast muscles than in thigh muscles (Ratnayake et al., 1989).
SFA proportions typically decline (Nain et al., 2015), as fatty acids with 14 and 16 C atoms demonstrate an exchange between saturated and MUFA forms, indicating ∆9-desaturases activity in body tissues (Bauman and Devis, 1974). Skřivan et al., 2018; reported that high contents of SFA in palm oil were consistent with a high expression of mRNA from all hepatic ∆9-desaturases. Likewise, the study herein showed that perilla meal diets produced higher SFA levels than that of the control diet (Table 1). The ∆9-desaturases activity converts C14:0 to C14:1, C16:0 to 16:1, and C18:0 to C18:1 (Puerto et al., 2017).
Enhancement of meat lipid stability
Our data has shown that perilla meal increased the oxidative stability of broiler meat (Figure 2). Lipid peroxidation, which occurs at the double bonds, is the chemical reaction of unsaturated fatty acids with oxygen. Therefore, an increase in the number of double bonds will exponentially increase their susceptibility to oxidation. The results herein have shown that perilla meal increased the levels of unsaturated fatty acids in the meat, but also produced lower MDA values (decreased lipid peroxidation). This may be a result of the bioactive compounds found in perilla meal, such as the antioxidants located in the seed’s coat and intact organelles (Shao et al., 2019). Peng et al., 2005; noted that perilla seeds contain several phenolic compounds; including ferulic, rosmarinic, and caffeic acids, which play an important role in trapping free radicals, thereby delaying rancidity. Moreover, Wood et al., 2008; also reported that the natural protection of polyunsaturated lipids is provided via the seed coat or the intact organelle. Correspondingly, Bortoluzzi et al., 2014; and García et al., 2007; studied the effects of broilers and pigs fed diets containing bioactive compounds, and their effective impact upon animal performance, intestinal health, fat content, lipid metabolism, meat composition, and oxidative stability. Deng et al., 2018; reported that lambs fed 5 % and 10 % perilla seed dietary inclusions exhibited a higher gene expression of antioxidant enzymes (superoxide dismutase, catalase, and glutathione peroxidase) in the Longissimus dorsi muscles. Moderate dietary levels of n-3 fatty acids may even enhance the activity of GSH-Px and total antioxidant capacity, resulting in lower lipid peroxidation in the serum of chickens (Alagawany et al., 2019).
Sensory perceptions of meat with increasing perilla levels.
Lipid oxidation results in off-flavor of chicken meat. The massive increase of polyunsaturated fatty acids (PUFA), particularly C18:3 n-3, and the concomitant protection of oxidation by other perilla ingredients may cause a change in the aroma, flavor, and development of off-flavors in meat (Jayasena et al., 2013). Interestingly, there were no differences found in any of these attributes within the present study. We noted, however, that the meat subjected to sensory analysis had been frozen for two days in refrigerated storage, which may have prevented any form of lipid oxidation, regardless of the treatment. Oxidation can be significantly slowed in frozen meat if oxygen is eliminated (Aidani et al., 2014). Furthermore, panelists were unable to detect off-flavor in meat when the TBARS number is <1.0 mg/kg of fresh meat (Wójciak et al., 2015). Notably, thigh meat tends to present higher TBARS numbers than breast meat, possibly due to the higher fatty acid contents of the thigh muscle (Wójciak et al., 2015).
CONCLUSIONS
The inclusion of perilla meal in broiler diets significantly improved meat qualities; such as pH, color, WHC, and tenderness, in support of our supposition (Hypothesis i); as well as the enhancement of n-3 fatty acids in broiler meat through the inclusion of dietary perilla meal (Hypothesis ii). Concerning lipid peroxidation, the perilla meal groups were able to retard rancidity in breast and thigh meat likely via the phenolic compounds in perilla meal (Hypothesis iii). The minimum perilla meal inclusion of 2% was sufficient to promote an efficient transfer of n-3 fatty acids into the meat lipids. However, its ability to improve oxidative stability was particularly weak. The general effects on meat quality were mostly favorable, was the increase in PUFA in the meat lipids and n-3 fatty acids, beneficial in the prevention of coronary heart disease and other chronic diseases, was particularly beneficial.
ACKNOWLEDGEMENTS
This work was supported by Project Ph.D. 50th Anniversary CMU as well as the Research Center for Functional Food for Well-being, Chiang Mai University, Chiang Mai, Thailand. We wish to extend our thanks to the Department of Animal and Aquatic Sciences, Faculty of Agriculture, Chiang Mai University, Thailand; and the Faculty of Animal Science and Technology, Maejo University, Thailand, for their support within their facilities.
REFERENCES
Aidani, E., Aghamohammadi, B., Akbarian, M., Morshedi, A., Hadidi, M., Ghasemkhani, N., and Akbarian, A. 2014. Effect of chilling, freezing and thawing on meat quality: A review. International Journal of Biosciences. 5: 159-169.
Alagawany, M., Elnesr, S.S., Farag, M.R., El-Hack, M.E., Khafaga, A.F., Taha, A.E., Tiwari, R., Yatoo, W.I., Bhatt, P., Khurana, S.K., and Dhama, K. 2019. Omega-3 and omega-6 fatty acids in poultry nutrition: Effect on production performance and health. Animals. 9: 573-592.
Alvarez, M., Diez, J.A., Lopez-bote, C.J., Gallego, M., and Bautista, J.M. 2000. Shortterm modulation of lipogenesis by macronutrients in rainbow trout (Oncorhynchus mykiss) hepatocytes. British Journal of Nutrition. 84: 619- 628.
Ahmed, A.A., Habib, A.B., and Sciences, B. 2017. Utilization of different peanut oil levels on broiler chickens feed and its effects in their performance. Nova Journal of Medical and Biological Sciences. 6: 1-9.
AOAC. 2005. Official Methods of Analysis of the Association of Official Analytical Chemists, 18th Ed., AOAC International, Gaithersburg, MD, USA, Official Method 2005.08
Araya, J., Rodrigo, R., Videla, L.A., Thielemann, L., Orellana, M., Pettinelli, P., and Poniachik, J. 2004. Increase in long-chain polyunsaturated fatty acid n - 6/n - 3 ratio in relation to hepatic steatosis in patients with non-alcoholic fatty liver disease. Clinical Science. 106: 635-43.
Asif, M. 2011. Health effects of omega-3, 6, 9 fatty acids: Perilla frutescens is a good example of plant oils. Oriental Pharmacy & Experimental Medicine. 11: 51-59.
Bauman, D.E. and Davis, C.L. 1974. Biosynthesis of milk fat. In: B.L. Larson and V.R. Smith (Eds.). Lactation: A Comprehensive Treatise (pp. 31-75). Academic Press, New York.
Becker, W.A., Boulaaba, A., Pingen, S., Krischek, C., and Klein, G. 2016. Low temperature cooking of pork meat physicochemical and sensory aspects. Meat Science. 118: 82-8.
Betti, M., Perez, T., Zuidhof, M., and Renema, R. 2009. Omega-3-enriched broiler meat: 3. Fatty acid distribution between triacylglycerol and phospholipid classes. Poultry Science. 88: 1740-1754.
Bortoluzzi, C., Menten, J., Romano, G., Pereira, R., and Napty, G. 2014. Effect of hops β-acids (Humulus lupulus) on performance and intestinal health of broiler chickens. Journal of Applied Poultry Research. 23: 437-443.
Boselli, E., Pacetti, D., Lucci, P. Di Lecce, G., and Frega, N.G. 2008. Supplementation with high-oleic sunflower oil and α-tocopheryl acetate: Effects on meat pork lipids. European Journal of Nutrition & Food Safety. 110: 381-391.
Castellini, C., and Dal Bosco, A. 2017. Poultry quality evaluation: quality attributes and consumer values. Woodhead, Sawston.
Crespo, N., and Esteve-Garcia, E. 2002. Nutrient and fatty acid deposition in broilers fed different dietary fatty acid profiles. Poultry Science. 81: 1533-1542.
Deng, K., Fan, Y., Ma, T., Wang, Z., TanTai, W., Nie, H., Guo, X.Y. Yu, X.Q., Sun, L.W., and Wang, F. 2018. Carcass traits, meat quality, antioxidant status and antioxidant gene expression in muscle and liver of Hu lambs fed perilla seed. Journal of Animal Physiology and Animal Nutrition. 102: e828-e837.
Department of Livestock Development. 2004. Formula diet of economic animals. (1st ed.). The Agricultural Co-operative Federation of Thailand, LTD, Bangkok.
Dixon, J.B. 2010. Mechanisms of chylomicron uptake into lacteals. 1207(Suppl 1): E52-E57.
Duran-Montgé, P., Lizar, R., Torrallardona, D., and Esteve-Garcia, E. 2007. Fat and fatty acid digestibility of different fat sources in growing pigs. Livestock Science. 109: 66-69.
Ferrini, G., Manzanilla, E.G., Menoyo, D., Esteve-garcia, E., Baucells, M.D., and Barroeta, A.C. 2010. Effects of dietary n-3 fatty acids in fat metabolism and thyroid hormone levels when compared to dietary saturated fatty acids in chickens. Livestock Science. 131: 287-291.
Folch, J., Lees, M., and Sloane Stanley, G. 1957. A simple method for the isolation and purification of total lipids from animal tissues. Journal of Biological Chemistry. 226: 497-509.
Gai, F., Peiretti, P.G., Karamać, M., and Amarowicz, R.J. 2017. Changes in the total polyphenolic content and antioxidant capacities of perilla (Perilla frutescens L.) plant extracts during the growth cycle. Journal of Food Quality. 2017: 1-8.
García, A., Batal, A., and Dale, N. 2007. A comparison of methods to determine amino acid digestibility of feed ingredients for chickens. Poultry Science. 86: 94-101.
Honikel, K. 1987. Evaluation and Control of Meat Quality in Pigs. Springer, Dublin.
Hulan, H.W., Ackman, R.G., Ratnayake, W.M.N., and Proudfoot, F.G. 1988. Omega-3 fatty acid levels and performance of broiler chickens fed redfish meal or redfish oil. Canadian Journal of Animal Science. 68: 533-547.
ISO.Sensory analysis general guidelines for the selection, training and monitoring of selected assessors and expert sensory assessors. 2012. (pp. 1-28). Routledge & CRC Press, Switzerland
Jaturasitha, S., Chaiwang, N., and Kreuzer, M. 2016. Thai native chicken meat: an option to meet the demands for specific meat quality by certain groups of consumers; a review. Animal Production Science. 57: 1582-1587.
Jaturasitha, S. 2004. Meat Management. Mingmuang Press, Chiang Mai.
Jayasena, D.D., Ahn, D.U., Nam, K.C., and Jo, C.J. 2013. Flavour chemistry of chicken meat: A review. Asian-Australasian Journal of Animal Sciences. 26: 732-742.
Joshi, A., Sharma, A., Pande, D., and Bachheti, R. 2017. Physico-chemical properties of Perilla frutescens seeds. Der Pharma Chemica. 7: 35-41.
Jung, S., Choe, J.H., Kim, B., Yun, H., Kruk, Z.A., and Jo, C. 2010. Effect of dietary mixture of gallic acid and linoleic acid on antioxidative potential and quality of breast meat from broilers. Meat Science. 86: 520-526.
Kanakri, K., Carragher, J., Hughes, R., Muhlhausler, B., and Gibson, R. 2017. A reduced cost strategy for enriching chicken meat with omega-3 long chain polyunsaturated fatty acids using dietary flaxseed oil. British Poultry Science. 58: 283-9.
Kitajka, K., Sinclair, A.J., Weisinger, R.S., Weisinger, H.S., Mathai, M., Jayasooriya, A.P., Halver, J.E., and Puskás, L.G. 2004. Effects of dietary omega-3 polyunsaturated fatty acids on brain gene expression. In: Proceedings of the National Academy of Sciences of the United States of America, 101: 10931-10936.
Konieczka, P., Czauderna, M., and Smulikowska, S.J. 2017. The enrichment of chicken meat with omega-3 fatty acids by dietary fish oil or its mixture with rapeseed or flaxseed. Effect of feeding duration: Dietary fish oil, flaxseed, and rapeseed and n-3 enriched broiler meat. Animal Feed Science and Technology. 223: 42-52.
Kumar, S. 2018. Sunflower is a good source of animal feed. International Journal of Current Microbiology and Applied Science. 7: 2812-2816.
Lee, S.A., Whenham, N., and Bedford, M.R.J. 2019. Review on docosahexaenoic acid in poultry and swine nutrition: Consequence of enriched animal products on performance and health characteristics. Animal Nutrition. 5: 11-21.
Longvah, T., and Deosthale, Y. 1998. Effect of dehulling, cooking and roasting on the protein quality of Perilla frutescens seed. Food Chemistry. 63: 519-23.
Morales-Barrera, J.E., Gonzalez-Alcorta, M.J., Castillo-Dominguez, R.M. Prado-Rebolledo, O.P., Hernandez-Velasco, X., Menconi, A., Tellez, G., Hargis, B.M., and Carrillo-Dominguez, S.C. 2013. Fatty acid deposition on broiler meat in chickens supplemented with tuna oil. Food Technology and Nutrition Science. 4: 16-20.
Morrison, E.R., and Smith, L.M. 1964. Preparation of fatty acid methyl esters and dimethylacetals from lipids with boron fluoride-methanol. Journal of Lipid Research. 5: 600-608.
Mourot, J., and Hermier, D. 2001. Lipids in monogastric animal meat. Reproduction Nutrition Development. 42: 109-118.
Nain, S., Oryschak, M., Betti, M., and Beltranena, E.J. 2015. Camelina sativa cake for broilers: Effects of increasing dietary inclusion from 0 to 24% on tissue fatty acid proportions at 14, 28, and 42 d of age. Poultry Science. 94: 1247-1258.
Omidi, S., Mohit, A., and Hossein-Zadeh, N.G. 2020. Effect of dietary fat level and source on performance and immune system response of turkeys. Acta Scientiarum Animal Sciences. 42: e46775-e46788.
Peiretti, P.G., Gasco, L., Brugiapaglia, L., and Gai. F. 2011. Effects of perilla (Perilla frutescens L.) seeds supplementation on performance, carcass characteristics, meat quality and fatty acid composition of rabbits. Livestock Science. 138: 118-124.
Pinchasov, Y., and Nir, I. 1992. Effect of dietary polyunsaturated fatty acid concentration on performance, fat deposition and carcass fatty acid composition in broiler chickens. Poultry Science. 71: 1504- 1512.
Peng, Y., Ye, J., and Kong, J. 2005. Determination of phenolic compounds in Perilla frutescens L. by capillary electrophoresis with electrochemical detection. Journal of Agricultural and Food Chemistry. 53: 8141-8147.
Power, G.W., and Newsholme, E.A. 1997. Dietary fatty acids influence the activity and metabolic control of mitochondrial carnitine palmitoyltransferase I in rat heart and skeletal muscle. Journal of Nutrition. 127: 2142-2150.
Puerto, M., Cabrera, M.C., and Saadoun, A. 2017. A note on fatty acids profile of meat from broiler chickens supplemented with inorganic or organic selenium. International Journal of Food Science. 3: 1-8.
Raj, S., Skiba, G., Sobol, M., and Pastuszewska, B.J. 2017. Effects of dietary fat on the saturated and monounsaturated fatty acid metabolism in growing pigs. Archives of Animal Nutrition. 71: 257-271.
Ratnayake, W. M. N., Ackman, R. G., and Hulan, H. W. 1989. Effect of redfish meal enriched diets on the taste and n-3 PUFA of 42-day-old broiler chickens. Journal of the Science of Food and Agriculture. 49: 59-74.
Ravindran, V., Tancharoenrat, P., Zaefarian, F., and Ravindran, G.J. 2016. Fats in poultry nutrition: Digestive physiology and factors influencing their utilisation. Animal Feed Science and Technology. 213: 1-21.
Saito, K., Nomura, M., and Kimura, J. 2002. Effect of feeding perilla oil, meal and leaves on fatty acid contents in egg yolk. Japan Science and Technology Information. 73: 39-48.
SAS. (1996). SAS/STAT Sofware: Changes and Enhancements, Release 8.2. Cary, NC. USA.
Shao, Q, Liu, X, Su, T. Wang, P., and Ma, C.J. 2019. New insights into the role of seed oil body proteins in metabolism and plant development. Frontiers in Plant Science. 10: 1-14.
Sim, J.S., and Qi, G.H. 1995. Designing poultry products using flaxseed. In L.U. Thompson and S. Cunnane (Eds.). Flaxseed in human nutrition (pp. 315-333). American oil Chemists’ Socity Press (AOCS), Illinois
Sinnhuber, R.O. 1958. 2-Thiobarbituric acid method for the measurement of rancidity in fishery products. II. The quantitative determination of malonaldehyde. Food Technology. 12: 9-12.
Skřivan, M., Marounek, M., Englmaierová, M, Čermák, L., Vlčková, J., and Skřivanová, E. 2018. Effect of dietary fat type on intestinal digestibility of fatty acids, fatty acid profiles of breast meat and abdominal fat, and mRNAexpression of lipid-related genes in broiler chickens. PLoS ONE. 14: 1-11.
Speedy, A.W. 2003. Global production and consumption of animal source foods. Journal of Nutrition. 133: 4048S-4053S.
Song, N.B., Lee, J.H., and Song, K.B. 2015. Preparation of perilla seed meal protein composite films containing various essential oils and their application in sausage packaging. Journal of the Korean Society for Applied Biological Chemistry. 58: 83-90.
Tartrakoon, W., Tartrakoon, T., and Kitsupee, N. 2016. Effects of the ratio of unsaturated fatty acid to saturated fatty acid on the growth performance, carcass and meat quality of finishing pigs. Animal Nutrition. 2: 79-85.
Więcek, J., Rekiel, A., and Skomial, J. 2010. Effect of feeding level and linseed oil on some metabolic and hormonal parameters and on fatty acid profile of meat and fat in growing pigs. Archives of Animal Breeding. 53: 37-49.
Wood, J. D., Enser, M., Fisher, A., Nute, G., Sheard, P., Richardson, R., Hughes, S., and Whittington, F. 2008. Fat deposition, fatty acid composition and meat quality: A review. Meat Science. 78: 343-358.
Wójciak, K.M., Karwowska, M., and Dolatowski, Z. 2015. Fatty acid profile, color and lipid oxidation of organic fermented sausage during chilling storage as influenced by acid whey and probiotic strains addition. Scientia Agricola. 72: 124-131.
Yamada, M., Soeta, A., Sekiguti, S., Aminaka, J., Yamada, K., and Mutou, K. 2005. Effects of perilla meal feeding on the growth, carcass characteristics, and fatty acid composition of fat tissue and muscle in fattening pigs. Japanese Science and Technology Information. 42: 45-53.
Zhang, X., Jin, Y., and Badgery, W.J. 2017. Diet selection and n-3 polyunsaturated fatty acid deposition in lambs as affected by restricted time at pasture. Scientific Reports. 7: 1-10.
Zhuang, H., and Savage, E. 2009. Variation and Pearson correlation coefficients of Warner-Bratzler shear force measurements within broiler breast fillets. Poultry Science. 88: 214-220.
Zhuang, H., Bowker, B.C., Buhr, R.J., and Sanchez Brambila, G. 2014. Hot-boning enhances cook yield of boneless skinless chicken thighs. Poultry Science. 93: 1553-1560.
OPEN access freely available online
Chiang Mai University Journal of Natural Sciences [ISSN 16851994]
Chiang Mai University, Thailand
https://cmuj.cmu.ac.th
Napatsorn Montha1, Winai Yothinsirikul2, Kanchit Chompupun2, Michael Kreuzer3, and Sanchai Jaturasitha4*
1 Department of Animal and Aquatic Sciences, Faculty of Agriculture, Chiang Mai University, Chiang Mai 50200, Thailand
2 Faculty of Animal Science and Technology, Maejo University, Chiang Mai 50290, Thailand
3 ETH Zurich, Institute of Agricultural Sciences, Universitaetstrasse 2, 8092, Zurich, Switzerland
4 Science and Technology Research Institute, Chiang Mai University, Chiang Mai 50200, Thailand
Corresponding author: Sanchai Jaturasitha, E-mail: ja.sanchai@gmail.com
Total Article Views
Editor: Wasu Pathom-aree,
Chiang Mai University, Thailand
Article history:
Received: May 7, 2020;
Revised: August 3, 2020;
Accepted: September 8, 2020