 ISSN: 2822-0838 Online

Metabolite Profiles of Red and White Rice Aqueous Extracts Derived at Different Temperatures and Their Relationship with Biological Properties as Determined Using 1H-NMR-Based Metabolomics Analysis
Papichaya Netrprachit, Nitra Nuangchamnong, Nurul Shazini Ramli, Faridah Abas, and Sudarat Jiamyangyuen*Published Date : 2020-09-01
DOI : https://doi.org/10.12982/CMUJNS.2020.0059
Journal Issues : Number 4, October-December 2020
Abstract Consumption of pigmented rice has continued to increase in recent years, due in part to its potential health promoting properties, especially protection against chronic diseases. Chemical extracts of red rice have demonstrated strong ability to scavenge free radicals, however little is yet known about water extracts of red rice. The antioxidant activity, α-glucosidase inhibition, nitric oxide inhibition, and metabolic profiling of this cultivar’s water extracts have yet to be investigated. In this study, red rice and white rice were extracted using ultrasound-assisted hydrothermal extraction at three different temperatures. The total phenolic content (TPC) as well as the DPPH radical scavenging, α-glucosidase inhibitory, and nitric oxide (NO) inhibitory activities of each extract were determined. NMR analysis was performed to find out the metabolite profiles of the extracts. Correlations between the metabolites and the biological activities of the rice extracts were then investigated using metabolomics analysis. Results show that the red rice aqueous extracts had a higher TPC than the white rice extracts. The highest extraction temperature led to a decrease in the TPC. However, the extraction temperature did not affect the radical scavenging, α-glucosidase inhibitory, or NO inhibitory activities of the red rice extracts. The PCA results indicated extract discrimination by extraction temperature. The PLS score plot exhibited the potentials of red rice aqueous extracts on the α-glucosidase and NO inhibitory activities. The 1H-NMR-based metabolomics analysis shows that red rice aqueous extract possesses beneficial properties which can make it useful as an ingredient for functional foods or other products.
Keywords: 1H-NMR-based metabolomics, Biological properties, Red pigmented rice, Hydrothermal extraction, Ultrasonic-assisted extraction
Introduction
Rice is a staple food eaten daily by much of the world’s population, and its consumption shows no sign of declining (Frank et al., 2012). Pigmented rice cultivars such as black, purple, and red rice have gained more and more interest in recent years, due in part to their potential health promoting properties (Min et al., 2012). Those pigmented rice is known to contain phenolic compounds, for example phenolic acids and flavonoids, that have the ability to scavenge free radicals and thereby provide health-promoting benefits (Min et al., 2014). Among those pigmented rice, red rice has been reported to have a stronger antioxidant activity than black rice (Gunaratne et al., 2013). However there have been few studies to investigate the antioxidant properties, biological activities, and metabolite profiling of aqueous red rice extracts, and this is the focus of the current study.
The use of chemical solvents is a common method to obtain extracts from plants. Unfortunately conventional extraction that uses chemical solvents can be time-consuming, require large amounts of the solvent, and pose danger from the chemicals themselves. In contrast, several alternative techniques have been developed which can reduce extraction time and solvent consumption and provide high reproducibility. These alternative techniques include ultrasound-assisted extraction, microwave-assisted extraction, supercritical fluid extraction, high-pressure extraction, and hydrothermal extraction (Tabaraki et al., 2011). That said, some techniques like high-pressure extraction and supercritical fluid extraction have limitations, for example they can be expensive or impractical for large scale manufacturing. One comparatively simple and efficient method is ultrasound-assisted extraction (Pringret et al., 2012). This extraction technique is widely applied in the production of various food ingredients (He et al., 2016).
Hydrothermal extraction is considered a non-toxic and sustainable extraction method providing extracts that are safe and suitable for use as functional food ingredients and supplements. Extraction parameters such as extraction temperature and extraction time can influence the efficiency and yield of the extraction as well as the biological properties of resulting plant extract. Excessive heat can cause the degradation and/or loss of phenolic compounds (Saikia et al., 2012). This makes careful temperature control vital during the extraction process in order to preserve the plant’s biological benefits in the finished extract.
Metabolomic analysis is a useful tool to illustrate and understand metabolic states in plant materials. In this technique, metabolites are profiled and identified using the principles of spectroscopy (Kusano et al., 2015). Nuclear Magnetic Resonance (NMR) is a kind of spectroscopy that is non-destructive and can analyze a broad range of metabolites, making it a commonly used technique for profiling (Lee et al., 2016). Profile data from NMR can be interpreted by using multivariate statistical analysis in order to identify correlations between metabolites and biological properties.
At present little is known about water extracts of white and red rice and the influences of hydrothermal conditions during extraction on the biological properties of the finished extract. The current study has three purposes: 1) to evaluate the effects of extraction temperature on the total phenolic content (TPC) as well as DPPH free radical scavenging, α-glucosidase inhibitory, and nitric oxide (NO) inhibitory activities of white and red rice extracts obtained from ultrasound-assisted hydrothermal extraction, 2) to use NMR to determine the metabolite profiles of those extracts, and 3) to use metabolomics including principle component analysis (PCA) and partial least square (PLS) analysis to find out the relationships between the extracts’ metabolites and biological activities.
Materials and Methods
Rice sample preparation
Unpolished white and red rice samples were purchased from the rice farmers’ cooperative in Nong Sano Sub-District, Sam Ngam District, in Pichit Province, Thailand. The samples were ground using an electric grain grinder, sieved through a 250 µm (60 mesh) sieve (discarding any larger particles), transferred to plastic zip lock bags, and stored in a refrigerator at 4°C. The samples were defatted by soaking them in hexane in beakers overnight at a ratio of 1 gram of sample per 4 milliliters of hexane. The hexane was then drained and the samples were placed under a fume hood to evaporate all residual hexane. Lastly the dried defatted samples were transferred to new zip lock plastic bags and returned to storage at 4°C until use.
Aqueous rice extract preparation
The extraction of the white and red rice samples was performed using the method of Gunaratne et al. (2013) with minor modifications. For each sample, six replicates were prepared at the same time. Each defatted rice sample (0.5 g) was mixed with deionized water (10 mL). The extraction was carried out using a sonicator bath (53 Hz) for 30 min at three different temperatures: 30, 60, and 80°C. The slurry was then centrifuged at 3,000 rpm for 15 min and the supernatant was collected. Each extraction was repeated twice. The supernatants were then pulled together, freeze-dried, and then stored at 4°C.
Total phenolic content determination
The TPC of the rice extracts was determined using the Folin-Ciocalteu assay (Lee et al., 2016). Each rice extract (20 µL) was mixed with Folin-Ciocalteu reagent (100 µL, 10-fold dilution) and 7.5% sodium carbonate solution (80 µL) and then left to sit in the dark for 30 min. The absorbance of the mixture was then read with a spectrophotometer at 760 nm against the reagent blank. The TPC was reported as mg gallic acid equivalent per 100 g sample (mg GAE/100 g).
DPPH scavenging activity measurement
The DPPH radical scavenging activity of the rice extracts was determined using the method of Abas et al. (Abas et al, 2006). An aliquot of each extract (50 µL) was prepared and a serial dilution was performed in a 96-well plate. Then 100 µL of DPPH solution in methanol (5.9 mg/100 mL methanol) was added into each well and the plate was left to sit in the dark for 30 min. After that, the absorbance of the solution was read at 517 nm. The DPPH scavenging activity (%) of the extracts and the standard (quercetin) were calculated using the following equation:
DPPH radical scavenging activity (%) = [(Ao – As) / Ao) x 100
Where Ao is the absorbance of the reagent blank and As is the absorbance of the extract. The results are expressed as IC50 value in µg/mL.
Alpha-glucosidase inhibitory activity assay
The determination of α-glucosidase inhibitory activity of the rice extracts was performed using the method of Lee et al. (2014) with minor modifications. In order to find the IC50 of alpha-glucosidase inhibitory activity, a serial dilution was prepared from an aliquot of each extract in a 96-well microplate, along with a blank substrate, a negative control, and a positive control. Then 75 µL of p-nitrophenyl-α-D-glucopyranose (PNPG) dissolved in 50 mM phosphate buffer (pH 6.5) was mixed into the sample, blank substrate, and negative control wells while the rest was received 75 µL of 30 mM phosphate buffer. The microplate was left to sit in the dark for 5 min. Next, 75 µL of α-glucosidase was added and these mixtures were then left to sit at room temperature for 15 min. After that, 50 µL of 2M glycine (pH 10) was put into the sample, blank substrate, and negative control wells. The rest received 50 µL of deionized water. The absorbance of all the wells was read at 405 nm. The percentage (%) of inhibition was calculated using the following equation:
% inhibition of sample = [(an-as)/an] x 100%
Where an is the difference in absorbance between the negative control and the blank, and as the difference in absorbance between the sample and the blank. The results are presented as IC50 value in µg/mL.
Nitric oxide inhibitory activity and cell viability tests
An NO inhibition assay (Abdul-hamid et al., 2016) was carried out using RAW 264.7 macrophage cells. These cells were cultured in a plastic culture flask in phenol red Dulbecco’s Modified Eagle’s Medium (DMEM) with 10% fetal bovine serum (FBS) and 1% Pen-Strep solution. The cells were place in an incubator at 37°C with 5% carbon dioxide (CO2). After cells confluency, the cells were detached using TrypLE™ Express enzyme and centrifuged at 1,000 rpm for 10 min at 4°C. After centrifugation, the supernatant was removed and the cells were suspended in DMEM containing no phenol red. A cell count and viability test was performed using the standard Trypan Blue cell counting method. The concentration of the cells was adjusted to 1x10⁶ cells/mL. Then 50 µL of the adjusted cell solution was seeded into each well of a 96-well culture plate, along with 50 µL of DMEM per well. This well plate was incubated at 37°C with 5% CO2 for 24 h.
A serial dilution of the rice extract (50 µL) was performed in DMEM medium containing dimethylsulphoxide (DMSO). Then 100 µL of IFN-γ (200 U/mL) and/or 100 µL of lipopolysaccharide (LPS, 10 µg/mL) were added into the wells of the culture plate depending on the existing contents of the well. The culture plate was then incubated at 37°C with 5% CO2 for 24 h. NO inhibition was determined using the Griess assay, as follows. A 50 µL portion of the cell supernatant was mixed with 50 µL of the Griess reagent (1% sulfanilamide, 0.1% N-(1-naphthyl)-ethylenediamine dihydrochloride, and 2.5% H3PO4) away from direct light at room temperature for 5 min. The absorbance was then measured at 550 nm with a micro-plate reader, using curcumin as the reference standard. The NO inhibitory activity was expressed as IC50. The viability of the cells was tested using the cytotoxicity assay, as follows. After removing the cell supernatant from the culture plate, 100 µL of DMEM was added into each well, followed by 20 µL of 3-(4,5-dimethylthaiazol-2-yl)-2,5-diphenyltetrazolium bromide (MTT) in phosphate-buffered saline (PBS) (5 mg/mL). The culture plate then was incubated at 37°C with 5% CO2 for 4 h. The absorbance was measured at 570 nm and the percentage of dead cells was calculated.
1H NMR analysis
1H nuclear magnetic resonance (1H NMR) spectral data on the rice extracts was collected according to the method of Abdul-Hamid et al. (2016) with minor modifications. The rice extract solution was prepared in a microcentrifuge tube by mixing 0.375 mL of KH2PO4 buffer (in pH 6.0 D2O containing 0.1% trimethylsilyl propionic acid-d4 sodium salt, i.e. TSP), 0.375 mL of CD3OD, and 10 mg of rice extract. The solution was mixed using a vortex mixer for 1 min at room temperature, sonicated for 5 min, and centrifuged for 10 min at 13,000 rpm. The supernatant was then transferred to a NMR tube and exposed to a 500 MHz Varian INOVA NMR spectrometer (Varian Inc., Milpitas, California, USA) to perform 1H NMR analysis using pre-saturation pulse sequence (PRESAT) mode with retained temperature at 26°C. Each sample required 3:53 min and 64 scans with spectral width of 20 ppm and 1.0 s of relaxing delay. An additional two dimensional 1H 1H J-resolved measurement was conducted to aid in metabolite identification of some required components.
Multivariate data analysis (MVDA)
The phasing and baseline correction of the spectral data were carried out using Chenomx software (v. 5.1, Edmonton, Alberta, Canada) and the spectrum of trimethylsilyl propionic acid-d4 sodium salt (TSP) was used as a reference. The water region (4.70-4.90 ppm) was excluded. The spectral data was normalized and binned for MVDA using SIMCA-P+ (Version 13.0, Umetrics AB, Umeå, Sweden).
Statistical analysis
All results are expressed as the means ± standard deviation of six replicates. The analysis of significant difference was performed using analysis of variance (ANOVA) and the Tukey test with P< 0.05.
Results
Total phenolic content and biological activities of the rice water extracts
Total phenolic content results of the red and white rice water extracts from different extraction temperatures are shown in Table 1. All the red rice extracts had significantly (P< 0.05) higher phenolic content than the corresponding white rice extracts. The extraction temperature also significantly affect the phenolic content, with the extracts of both red and white rice extracted at 30 and 60°C showing a higher TPC value than those extracted at 80°C. At 80°C, TPC values dropped by 50% or more. There was no significant difference between the extracts obtained at 30 and 60°C. The highest TPC value came from the red rice extract obtained at 30°C.
The results from testing DPPH scavenging activity, α-glucosidase inhibitory activity, and NO inhibitory activity of the water extracts of red and white rice, all expressed as IC50 (µg/mL), are displayed in Table 1. Free radical scavenging activity reflects the capability of extracts to donate hydrogen to the free radical. Consequently, antioxidant capacity of extracts can be determined. The red rice extracts are more effective free radical scavengers than the white rice extracts. The lowest IC50 value was obtained from the red rice extracted at 30°C. There was no significant difference in free radical scavenging observed among the red water extracts obtained at different temperatures. On the other hand, extraction temperature did affect the scavenging activity of the white rice extracts, with increases in extraction temperature leading to decreases in scavenging activity.
Looking at the α-glucosidase inhibition results, the white rice extracts had inhibition rates lower than 50%, therefore α-glucosidase inhibition of the white rice extracts was not considered further. In contrast, the red rice water extracts demonstrated impressive inhibition activity (with low IC50 values ranging from 1.2 to 2.0 µg/mL), surpassing even the quercetin standard (IC50 2.76 ± 0.24 µg/mL). Interestingly, the inhibitory activity of the aqueous red rice extracts was not significantly influenced by the extraction temperature (P< 0.05).
The NO inhibitory activity of the red rice extracts possessed a greater NO inhibitory activity than the white rice extracts. In addition, the red rice extracts obtained from different extraction temperatures displayed no significant difference in the inhibition activity. The red rice extracts using the extraction temperature of 30°C exhibited the lowest IC50 value. However, a significant difference in the NO inhibitory activity was observed between the white rice extracted at 30°C and 60°C.
Table 1. Total phenolic content, DPPH scavenging, α-glucosidase inhibitory and NO inhibitory activities determination of water extracts of red and white rice from different extraction temperatures.
|
Variety |
Extraction temperature (°C) |
TPC |
DPPH scavenging activity expressed as IC50 (µg/mL) |
α-glucosidase inhibitory activity expressed as IC50 (µg/mL) |
NO inhibitory activity expressed as IC50 (µg/mL) |
|
Red |
30 |
1689.10 ± 198.50d |
13.47 ± 4.46a |
1.24 ± 0.35a |
169.63 ± 0.02a |
|
60 |
1668.67 ± 206.62d |
17.205 ± 3.52a |
1.87 ± 0.16a |
176.26 ± 0.02a |
|
|
80 |
708.46 ± 77.09c |
16.10 ± 5.18a |
2.00 ± 0.12a |
193.75 ± 0.02a |
|
|
White |
30 |
522.18 ± 55.14b |
136.98 ± 23.17ab |
ND |
233.24 ± 0.01b |
|
60 |
404.61 ± 20.55b |
178.44 ± 24.13b |
ND |
279.59 ± 0.01c |
|
|
80 |
122.11 ± 60.84a |
561.67 ± 23.52c |
ND |
ND |
Note: Different superscripts indicate significant difference among red and white rice extracts (P < 0.05).
ND = not determined as the percent of inhibition was lower than 50% at concentration of 5,000 ppm.
1H NMR profiling of the rice water extracts
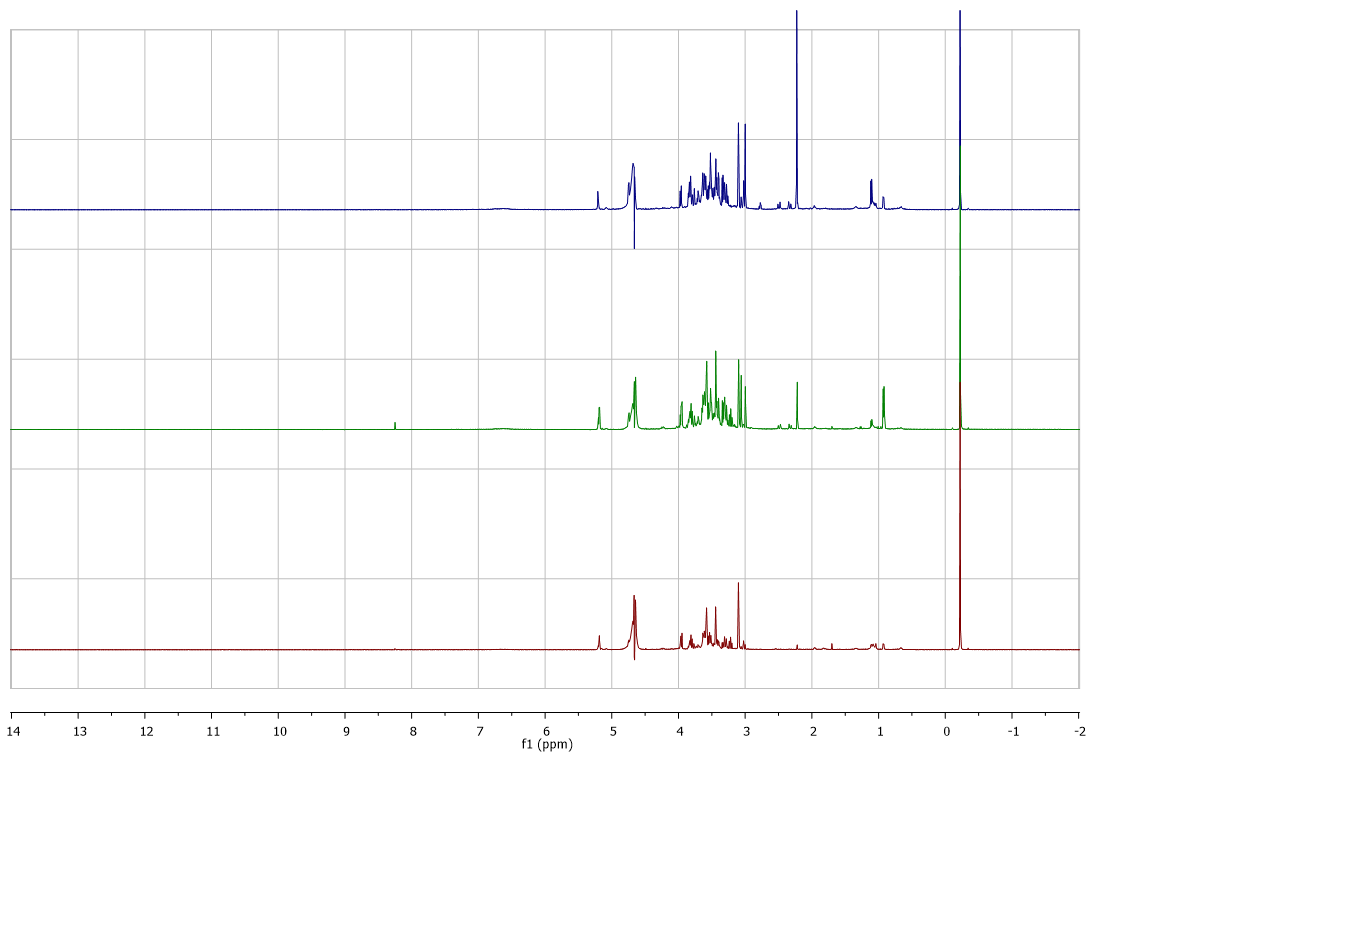
The representative 1H NMR spectra of red and white rice water extracts from different extraction temperatures were obtained (Figure 1). The spectra showed difference in peaks and intensity of peaks in aromatic (δ 5.5-9.0), aliphatic (δ 0.5-3.0), and sugar regions (δ 3.0-5.5). Different pattern of spectra and peak intensities between white and red extracts was observed clearly in aliphatic regions in which the extracts of white rice appeared to have more compounds compared to the red rice extracts. Different extraction temperatures also exhibited changes in spectra and peak intensities of both white and red rice in all regions. At the extraction temperature of 60⁰C, for both cultivars of rice, the content of sugars and aliphatic compounds were higher than the extracts obtained from 30⁰C. Whereas some compounds in these regions reduced when the temperature reached 80⁰C. The spectra of the representative white and red rice extracts from different extraction temperatures were characterized as shown in Table 2. Phenolic compounds (caffeic acid, epicathecin, vanillic acid, chlorogenic acid), alkaloid (trigonelline), amino acids (choline, glutamine, valine, isoleucine, leucine, alanine, threonine, tyrosine, tryptophan, τ-methylhistidine, histidine), sugars (sucrose, UDP-glucose, glucose, and maltose), organic acids (acetic acid, 4-aminobutyric acid, pyruvic acid, succinic acid, citric acid, 2-oxoglutarate, 2-hydroxyisovalerate, syringic acid, formic acid, and nicotinic acid) and fatty acids derivatives were identified as the components of those extracts.
(A)
(B)
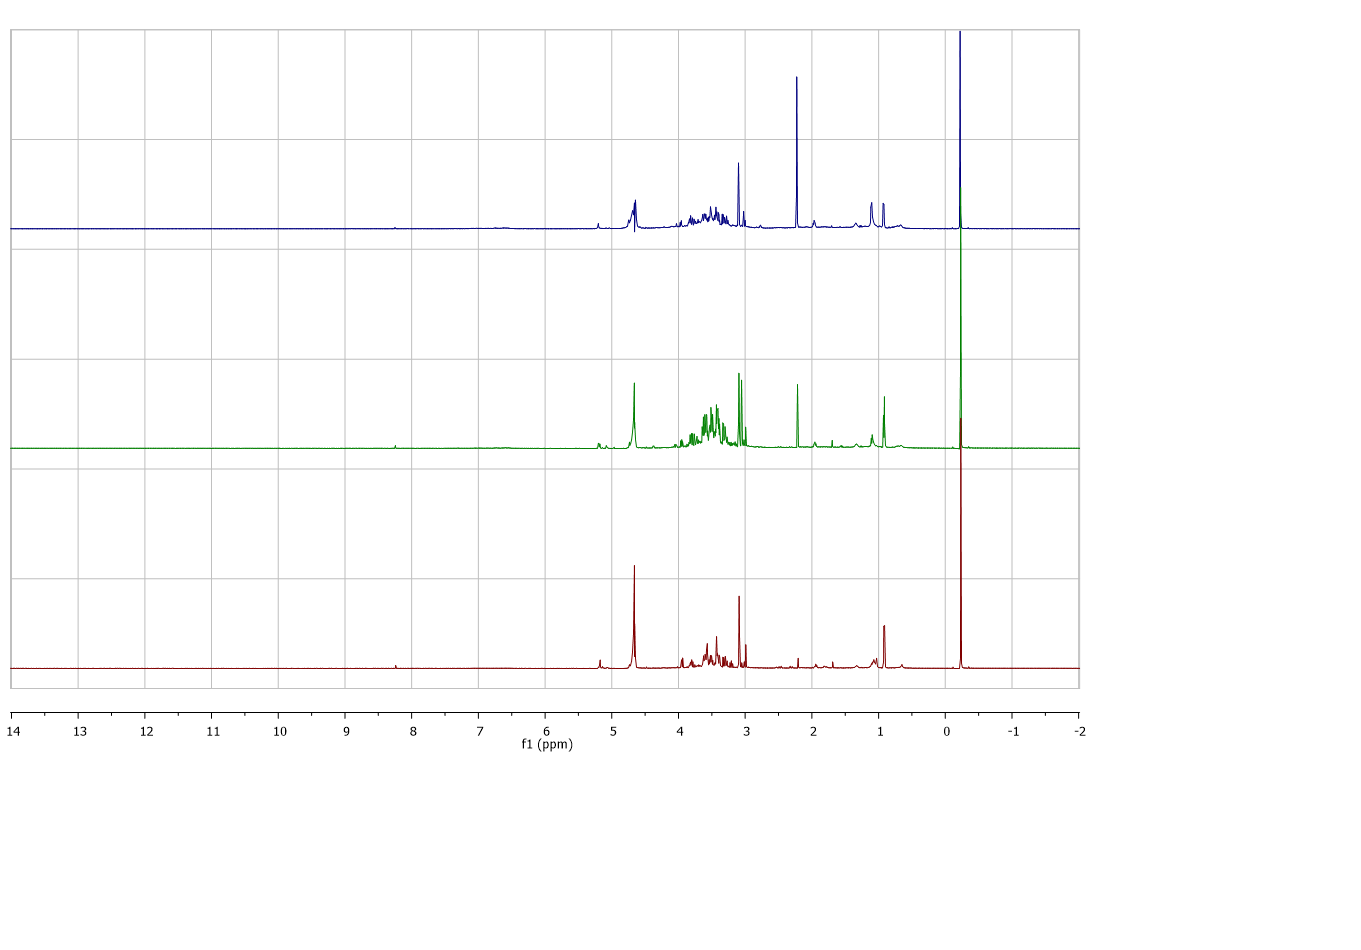
Figure 1. 1H NMR spectra of different extracts from red and white aqueous extracts a) 30, b) 60 and c) 80°C.
Table 2. 1H NMR characteristic signals of different rice extracts from various extraction temperature.
|
Metabolites |
1H NMR characteristic signals (δ) |
Rice variety/ Extraction temperature (⁰C) |
||||||
|
White |
|
Red |
||||||
|
30 |
60 |
80 |
|
30 |
60 |
80 |
||
|
Phenolic acids |
|
|
|
|
|
|
|
|
|
Caffeic acid |
3.93 (s), 3.51 (s), 3.39 (s) |
+ |
+ |
+ |
|
+ |
+ |
+ |
|
Epicatechin |
6.13 (m), 5.01 (s), 2.90 (m), 2.80 (m) |
+ |
+ |
+ |
|
+ |
+ |
+ |
|
Vanillic acid |
7.50 (d), 7.46 (d) |
- |
- |
- |
|
+ |
+ |
+ |
|
Chlorogenic acid |
7.62 (d), 7.19 (d), 7.1 (d), 6.94 (d), 6.38 (d), 5.30 (m) |
+ |
+ |
+ |
|
+ |
+ |
+ |
|
Protocatechuic acid |
7.42 (d), 7.38 (dd) |
+ |
+ |
+ |
|
+ |
+ |
+ |
|
Alkaloids |
|
|
|
|
|
|
|
|
|
Trigonelline |
9.10 (s), 8.80 (m), 8.10 (m) |
+ |
+ |
+ |
|
+ |
+ |
+ |
|
Amino acids |
|
|
|
|
|
|
|
|
|
Choline |
3.21 (s) |
+ |
+ |
+ |
|
+ |
+ |
+ |
|
Glutamine |
3.76 (m), 2.45 (m), 2.19 (m), 2.10 (m) |
+ |
+ |
+ |
|
+ |
+ |
+ |
|
Valine |
3.60 (d), 2.28 (m), 1.04 (d), 0.97 (d) |
+ |
+ |
+ |
|
+ |
+ |
+ |
|
Isoleucine |
3.66 (d), 1.97 (m), 1.47 (m), 1.25 (m), 1.00 (m) |
+ |
+ |
+ |
|
+ |
+ |
+ |
|
Leucine |
3.73 (m), 1.70 (m), 1.0 (m) |
+ |
+ |
+ |
|
+ |
+ |
+ |
|
Alanine |
3.77 (m), 1.48 (d) |
+ |
+ |
+ |
|
+ |
+ |
+ |
|
Threonine |
4.25 (m), 1.32 (d) |
+ |
+ |
+ |
|
+ |
+ |
+ |
|
Tyrosine |
7.20 (d), 6.86 (d) |
+ |
+ |
+ |
|
+ |
+ |
+ |
|
Tryptophan |
7.54 (d), 7.3 (m), 7.18 (t) |
- |
- |
- |
|
+ |
+ |
+ |
|
T-methylhistidine |
8.10 (s), 7.16 (s) |
+ |
+ |
+ |
|
+ |
+ |
+ |
|
Histidine |
8.26 (s), 7.18 (s) |
+ |
+ |
+ |
|
+ |
+ |
+ |
|
Sugars |
|
|
|
|
|
|
|
|
|
Sucrose |
5.41 (d), 4.17 (d), 4.04 (t), 3.76-3.88 (m), 3.55-3.68 (m) |
+ |
+ |
+ |
|
+ |
+ |
+ |
|
UDP-glucose |
5.98 (m), 5.58 (m) |
+ |
+ |
+ |
|
+ |
+ |
+ |
|
Glucose |
5.20 (d), 4.63 (d), 3.71-3.89 (m), 3.53 (t), |
+ |
+ |
+ |
|
+ |
+ |
+ |
|
Maltose |
5.20 (d), 4.65 (d) |
+ |
+ |
+ |
|
+ |
+ |
+ |
|
Organic acids |
|
|
|
|
|
|
|
|
|
Acetic acid |
1.91 (s) |
+ |
+ |
+ |
|
+ |
+ |
+ |
|
4-aminobutyrate |
2.98 (t), 2.28 (t), 1.91 (m) |
+ |
+ |
+ |
|
+ |
+ |
+ |
|
Pyruvic acid |
2.36 (s) |
+ |
+ |
- |
|
+ |
+ |
- |
|
Succinic acid |
2.43 (s) |
+ |
+ |
- |
|
+ |
+ |
- |
|
Citric acid |
2.70 (d), 2.54 (d) |
- |
- |
- |
|
+ |
- |
- |
|
2-oxoglutarate |
2.98 (t), 2.43 (t) |
+ |
+ |
+ |
|
+ |
+ |
+ |
|
2-hydroxyisovalerate |
3.84 (d), 1.96-2.05 (m), 0.97 (d), 0.82 (d) |
+ |
+ |
+ |
|
+ |
+ |
+ |
|
Syringic acid |
7.27 (m), 3.91 (m) |
+ |
+ |
+ |
|
+ |
+ |
+ |
|
Nicotinic acid |
8.94 (d), 8.60 (dd), 8.26 (m), 7.55 (m) |
+ |
+ |
+ |
|
+ |
+ |
+ |
|
Formic acid |
8.45 (s) |
+ |
+ |
+ |
|
+ |
+ |
+ |
|
Fatty acid derivatives |
1.25-1.33 (m), 0.87 (m) |
+ |
+ |
+ |
|
+ |
+ |
+ |
Note: d = doublet; dd = double of doublet; m = multiple; s = singlet; t = triplet; + = present; - = absent.
Influences of different extraction temperatures and rice cultivars on metabolite profiles of the rice water extracts
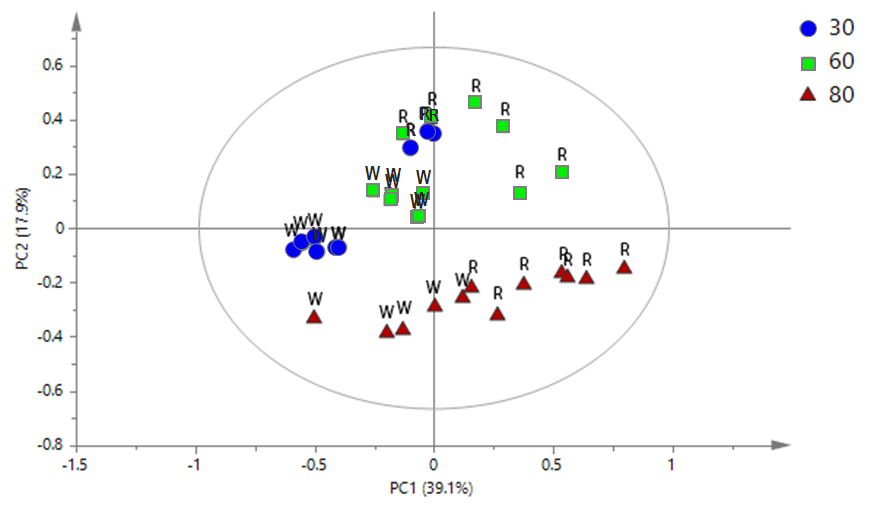
The PCA analysis was conducted to investigate the effects of thermal extraction on the extracts obtained from different cultivars of rice (Figure 2). The clusters of metabolites contributed in the pigmented rice extracts were observed (Figure 2A). The extracts obtained from 30°C of extraction temperature, both red and white rice, were separated by PC1. In addition, the extracts of red rice extracted at 60°C were also differentiated from those obtained from white rice at the same extraction temperature by PC1. The extracts obtained from 60°C and 80°C of both cultivars were discriminated from each other by PC2. The model represented a good fitness and predictability (R2X = 0.937, Q2 = 0.813). The loading plot (Figure 2B) demonstrated that the extracts obtained from 30°C composed of higher metabolites comparing to the extracts from other extraction temperatures. Meanwhile, glucose, sucrose, tyrosine, valine, 2-hydroxyisovalerate, epicatechin, and caffeic acid were the metabolites that related to the separation of the extracts of red rice extracted at 60°C. Alanine and succinic acid, which were the constituent that located distant from the plot origin, were found to be corresponded to the model discrimination.
(A)
(B)
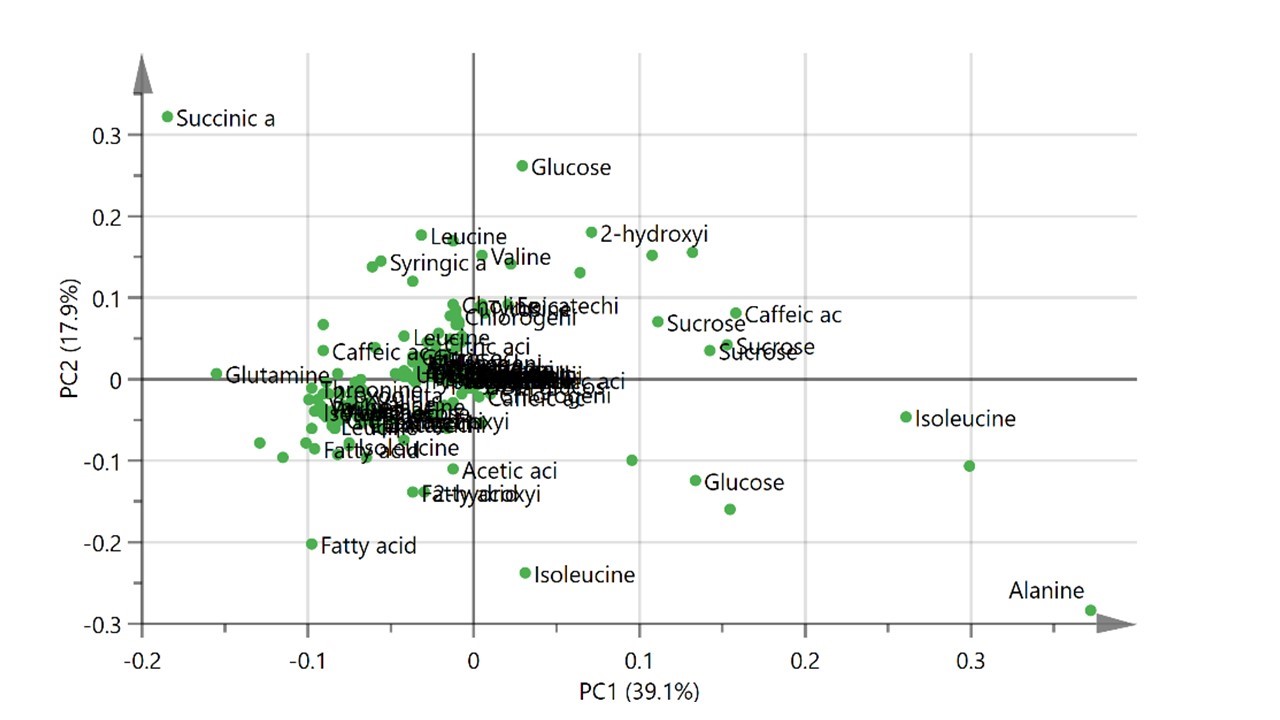
Figure 2. The PCA score plot (A) and loading plot (B) of 1H NMR spectra presenting the rice water extracts obtained from different extraction temperatures (30, 60 and 80°C) and rice cultivars (red and white).
Correlations between the metabolites and bioactivities of the rice water extracts
The PLS analysis was performed as an unsupervised method to describe the relationship between samples by group of data. The PLS biplot of 1H NMR spectra of the rice extracts obtained from different extraction temperatures and rice cultivars is demonstrated as Figure 3. The biplot represented the separation of metabolites contributed in the extracts into clusters. The extracts obtained from red and white rice were discriminated by PC1. On the other hand, the extracts of 60°C of red and white rice were separated from each other by PC1 as well. The extracts of 30°C of both cultivars of rice were isolated from those obtained from 80°C by PC2. The red rice extracted at both 30°C and 60°C illustrated a highly correlation to the DPPH, α-glucosidase and NO inhibitory activities, which represented in the same quadrant of the biplot. Tyrosine, chlorogenic acid, epicatechin and glucose were attributed to those activities.
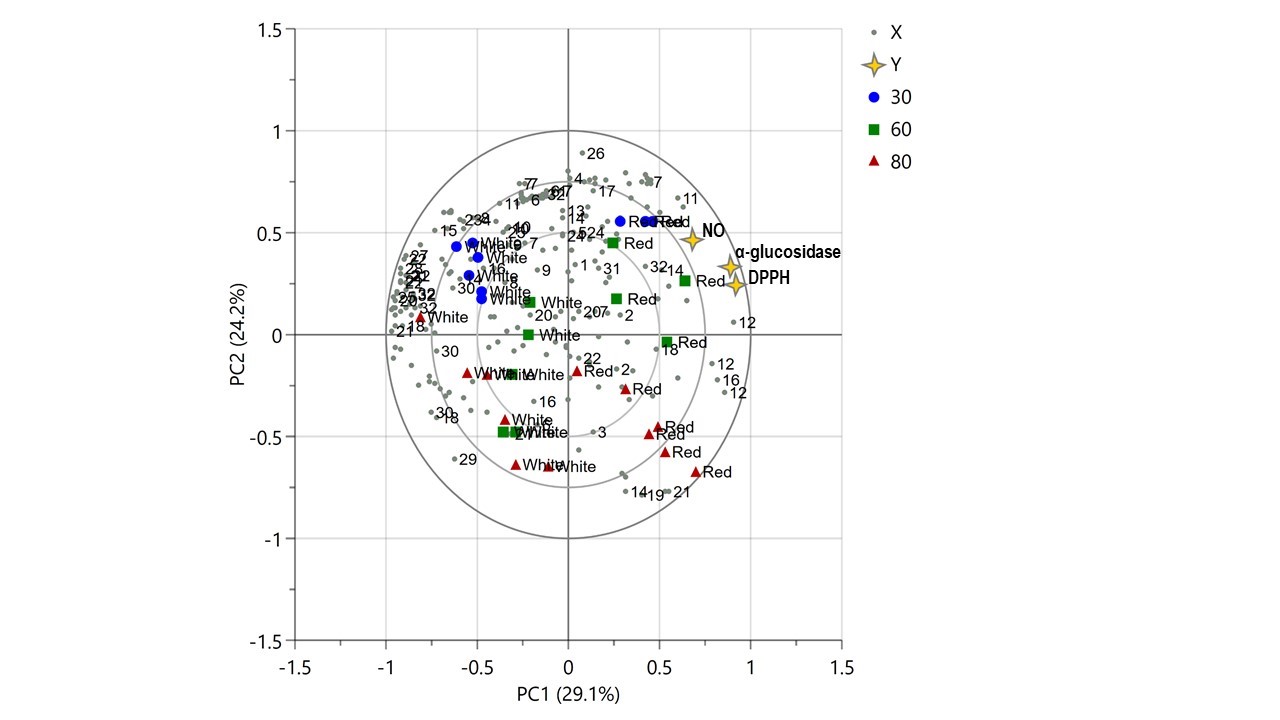
Figure 3. The PLS biplot presenting the variation of the rice extracts obtained from different rice cultivars (red and white) and extraction temperatures (30, 60 and 80°C) (1: trigonelline, 2: nicotinic acid, 3: formic acid, 4: histidine, 5: t-methylhistidine, 6: UDP-glucose, 7: chlorogenic acid, 8: tryptophan, 9: vanillic acid, 10: protocatechuic acid, 11: tyrosine, 12: sucrose, 13: maltose, 14: glucose, 15: threonine, 16: caffeic acid, 17: syringic acid, 18: 2-hydroxyisovalerate, 19: alanine, 20: leucine, 21: isoleucine, 22: valine, 23: 2-oxoglutarate, 24: citric acid, 25: glutamine, 26: succinic acid, 27: pyruvic acid, 28: 4-aminobutyrate, 29: acetic acid, 30: fatty acid, 31: choline, 32: epicatechin).
DISCUSSION
The concentration of phenolic compounds in rice varies among genotypes and grown location. Grains with colored pericarp are generally reported to have a higher concentration of phenolic compounds than light pericarp grains (Pedro et al., 2013). Phenolic compounds are water-soluble and heat labile components (Saikia et al., 2012). Thus, processing factors such as water content and temperature can affect the decomposition of phenolic compounds. Additionally, polymerization of phenolic compounds as well as formation of its complex structure could be induced during gelatinization of starches and protein denaturation, resulting in a reduction of phenolics content (Walter et al., 2013). Several studies stated the reduction of phenolic contents in rice with application of thermal treatments (Massaretto et al., 2011; Zaupa et al., 2015; Tang et al, 2016).
The changes of DPPH scavenging activity of aqueous extracts of plant materials by heat treatment have been reported (Arina and Harisum, 2019; Park et al., 2019). Furthermore, a stronger scavenging activity of water extracts obtained from red-hulled rice than those from white-hulled rice has been reported by Srisawat et al. (2010). The α-glucosidase inhibitory activity of germinated white and red rice ethanol extracts has been reported by Pramai et al. (2018) in which no significant difference in the percent of inhibition of α-glucosidase was observed between those samples. The NO inhibitory activity determination of red rice and white rice extracts using absolute and 50% ethanol have been reported in previous study and the stronger activity of the red rice than the white rice has been established (Okonogi et al., 2018). Bhawamai et al. (2016) have examined the effects of cooking on the anti-inflammatory activities of black rice and found similar activities between cooked and raw rice extracts despite of the decreased in phenolic contents and antioxidant capacity activity.
In this study, difference patterns of metabolite composition were observed between the red and white rice extracts with different extraction temperatures. Difference in metabolite distribution between pigmented and non-pigmented rice extracts was stated by Shao et al. (2018), in which the pigmented rice extracts were found to have higher content of phenolic compounds and minerals compared to the non-pigmented rice extracts. Kim et al. (2013) characterized the metabolites present in black and white rice grains and reported that amino acids, organic acids, sugars, phenolic acids, sugar alcohols and amine as metabolites contain in those samples. Metabolites contribute in plants can be varied by harvesting parameters and plant cultivars. In addition, extraction parameters like temperature also lead to the decomposition of metabolites during the extraction, resulting in different patterns of metabolite profiles. The thermal decomposition of phenolic compounds and changes in phenolic profile in processed lychee juice have been reported earlier by Su et al. (2019).
The variation of metabolites contained in the rice extracts were affected by the extraction temperature. The degradation of cyanidin-3-glucoside and enlargement of protocatechuic acid in cooked black rice have been reported by Heimori et al. (2009). In addition, Lang et al. (2019) has observed an increase in bound phenolic compounds in black rice when the drying temperature was increased. Zeng et al. (2019) found changes in phenolic compounds in brown rice after hydrothermal treatment.
To evaluate the correlation of the metabolites on the PLS model, variable importance in the projection (VIP) was performed. All of the metabolites corresponded to the observed biological activities were considered as important constituents presenting the VIP value more than 0.7 (Maulidiani et al., 2013). The validation of the model was further conducted using cross-validation and permutation test. The cross-validation showed a good fitness and prediction (R2Y = 0.96, Q2 = 0.889). The permutation test was examined with 100 permutations and the Y-intercepts of R2 and Q2 for all observed activities were less than 0.3 and 0.05, respectively (Khoo et al., 2015). Consequently, the model is valid with a goodness of fit and predictability performance.
Conclusion
This study has revealed that the particular cultivar of rice as well as the extraction temperature used both significantly affect the total phenolic content and biological activities of rice aqueous extracts. The aqueous red rice extracts had a higher TPC than the aqueous white rice extracts. The highest extraction temperature led to a decrease in the TPC. However, variations in extraction temperature did not affect the free radical scavenging, α-glucosidase inhibitory, or NO inhibitory activities of the red rice extracts. The PCA results indicated discrimination among the extracts based on variations in their metabolites, and these variations were affected by the rice cultivar and the extraction temperature. The red rice extracts obtained at 30 and 60⁰C were discriminated not only from the red rice extracted at 80⁰C but also from all of the white rice extracts. The correlation between metabolites and biological activities of the rice water extracts was clearly established by the PLS model. The red rice extracted at 30 and 60⁰C showed high correlation with NO inhibitory, α-glucosidase inhibitory, and DPPH scavenging activities. The metabolites tyrosine, chlorogenic acid, epicatechin, and glucose were associated with those activities. The 1H-NMR-based metabolomics analysis reveals and highlights the multiple beneficial properties of red rice aqueous extract that make it a promising source of useful ingredients for functional foods.
Acknowledgement
This research was financially supported by the National Research Council of Thailand (Project R2561B046). The authors greatly appreciate for this support.
References
Abas, F., Lajis, N.H., Israf, D.A., Khozirah, S., and Umi Kalsom, Y. 2006. Antioxidant and nitric oxide inhibition activities of selected Malay traditional vegetables. Food Chemistry. 95(4): 566-573. https://doi.org/10.1016/j.foodchem.2005.01.034
Abdul-Hamid, N.A., Mediani, A., Maulidiani, M., Abas, F., Ismail, I.S., Sharri, K., and Lajis, N.H. 2016. Discrimination and nitric oxide inhibitory activity correlation of Ajwa dates from different grades and origin. Molecules. 21(12): 1423. https://doi.org/10.3390/molecules21111423
Arina, M.Z.I., and Harisun, Y. 2019. Effect of extraction temperatures on tannin content and antioxidant activity of Quercus infectoria (Manjakani). Biocatalysis and Agricultural Biotechnology. 19: 101-104. https://doi.org/10.1016/j.bcab.2019.101104
Bhawamai, S., Lin, S., Hou, Y., and Chen, Y. 2016. Thermal cooking changes the profile of phenolic compounds, but does not attenuate the anti-inflammatory activities of black rice. Food & Nutrition Research. 60: 32941. https://doi.org/10.3402/fnr.v60.3294
Frank, T., Reichardt, B., Shu, Q., and Engel, K. 2012. Metabolite profiling of colored rice (Oryza sativa L.) grains. Journal of Cereal Science. 55(2): 112-119. https://doi.org/10.1016/j.jcs.2011.09.009
Gunaratne, A., Wu, K., Li, D., Bentota, A., Corke, H., and Cai, Y. 2013. Antioxidant activity and nutritional quality of traditional red-grained rice varieties containing proanthocyanidins. Food Chemistry. 138(2-3): 1153-1161. https://doi.org/10.1016/j.foodchem.2012.11.129
He, B., Zhang, L., Yue, X., Liang, J., Jiang, J., Gao, X., and Yue, P. 2016. Optimization of ultrasonic-assisted extraction of phenolic compounds and anthocyanins from blueberry (Vaccinium ashei) wine pomace. Food Chemistry. 204: 70-76. https://doi.org/10.1016/j.foodchem.2016.02.094
Hiemori, M., Koh, E., and Mitchell, A.E. 2009. Influence of cooking on anthocyanins in black rice (Oryza sativa L. Japonica var. SBR). Journal of Agricultural and Food Chemistry. 57(5): 1908-1914. https://doi.org/10.1021/jf803153z
Kim, J.K., Park, S., Lim, S., Yeo, Y., Cho, H.S., and Ha, S. 2013. Comparative metabolic profiling of pigmented rice (Oryza sativa L.) cultivars reveals primary metabolites are correlated with secondary metabolites. Journal of Cereal Science. 57(1): 14-20. https://doi.org/10.1016/j.jcs.2012.09.012
Khoo, L.W., Mediani, A., Zolkeflee, N.K.Z., Leong, S.W., Ismail, I.S., Khatib, A., Shaari, K., and Abas, F. 2015. Phytochemical diversity of Cliacanthus nutans extracts and their bioactivity correlations elucidated by NMR based metaboloics. Phytochemistry Letters. 14: 123-133. https://doi.org/10.1016/j.phytol.2015.09.015
Kusano, M., Yang Z., Okazaki Y., Nakabayashi R., Fukushima A., and Saito K. 2015. Using metabolomics approaches to explore chemical diversity in rice. Molecular Plant. 8(1): 58-67. https://doi.org/10.1016/j.molp.2014.11.010
Lang, G.H., Lindemann, I., Ferreira, C.D., Hoffmann, J.F., Vanier, N.L., and Oliveira, M. 2019. Effects of drying temperature and long-term storage conditions on black rice phenolic compounds. Food Chemistry. 287: 197-204. https://doi.org/10.1016/j.foodchem.2019.02.028
Lee, S.Y., Abas, F., Khatib, A., Ismail, I., Shaari, K., and Zawawi, N. 2016. Metabolite profiling of Neptunia oleracea and correlation with antioxidant and α-glucosidase inhibitory activities using 1H-NMR-based metabolomics. Phytochemistry Letters. 16: 23-33. https://doi.org/10.1016/j.phytol.2016.02.014
Lee, S.Y., Mediani, A., Nur, Ashikin, A.H., Azliana, A.B.S., and Abas, F. 2014. Antioxidant and α-glucosidase inhibitory activities of the leaf and stem of selected traditional medicinal plants. International Food Research Journal. 21(1): 165-172.
Massaretto, I.L., Madureira Alves, M.F., Mussi de Mira, N.V., Karaoglanovic Carmona, A., and Lanfer Marquez, U.M. 2011. Phenolic compounds in raw and cooked rice (Oryza sativa L.) and their inhibitory effect on the activity of angiotensin I-converting enzyme. Journal of Cereal Science, 54(2): 236–240. https://doi.org/10.1016/j.jcs.2011.06.006
Maulidiani, M., Abas, F., Khatib, A., Shitan, M., Shaari, K., and Lajis, N.H. 2013. Comparison of partial least squares and artificial neural network for the prediction of antioxidant activity in extract of Pegaga (Centella) varieties from 1H nuclear magnetic resonance spectroscopy. Food Research International. 54: 852-860. https://doi.org/10.1016/j.foodres.2013.08.029
Min, B., McClung, A., and Chen, M. 2014. Effects of hydrothermal processes on antioxidant in brown, purple, and red bran whole grain rice (Oryza sativa L.). Food Chemistry. 159: 106-115. https://doi.org/10.1016/j.foodchem.2014.02.164
Min, B., Gu L., McClung, A.M., Bergman, C.J., and Chen, M. 2012. Free and bound total phenolic concentrations, antioxidant capacities, and profiles of proanthocyanidins and anthocyanins in whole grain rice (Oryza sativa L.) of different bran colours. Food Chemistry. 133(3): 715-722. https://doi.org/10.1016/j.foodchem.2012.01.079
Okonogi, S., Kaewpinta, A., Junmahasathien, T., and Yotsawimonwat, S. 2018. Effect of rice variety and modification on antioxidant and anti-inflammatory activities. Drug Discoveries & Therapeutics. 12(4): 206-213. https://doi.org/10.5582/ddt.2018.01041
Park, C.Y., Lee, K., Gul, K., Rahman, M.S., Kim, A., and Chun, J. 2019. Phenolics and antioxidant activity of aqueous turmeric extracts as affected by heating temperature and time. Food Science and Technology. 105: 149-155. https://doi.org/10.1016/j.lwt.2019.02.014
Pedro, A.C., Granato, D., and Rosso, N.D. 2016. Extraction of anthocyanins and polyphenols from black rice (Oryza sativa L.) by modeling and assessing their reversibility and stability. Food Chemistry. 191: 12-20. https://doi.org/10.1016/j.foodchem.2015.02.045
Pingret, D., Fabiano-Tixier, A., Le Bourvellec, C., Renard, C.M.G.C., and Chemat, F. 2012. Lab and pilot-scale ultrasound-assisted water extraction of polyphenols from apple pomace. Journal of Food Engineering. 111: 73-81. https://doi.org/10.1016/j.jfoodeng.2012.01.026
Pramai, P., Abdul, Hamid, N.A., Mediani, A., Maulidiani, M., Abas, F., and Jiamyangyuen, S. 2018. Metabolite profiling, antioxidant, and α-glucosidase inhibitory activities of germinated rice: nuclear-magnetic-resonance-based metabolomics study. Journal of Food and Drug Analysis. 26: 47-57. https://doi.org/10.1016/j.jfda.2016.11.023
Saikia, S., Dutta, H., Saikia, D., and Mahanta, C.L. 2012. Quality characterization and estimation of phytochemicals content and antioxidant capacity of aromatic pigmented and non-pigmented rice varieties. Food Research International. 46: 334-340. https://doi.org/10.1016/j.foodres.2011.12.021
Shao, Y., Hu, Z., Yu, Y., Mou, R., Zhu, Z., and Beta, T. 2018. Phenolic acids, anthocyanins, proanthocyanidins, antioxidant activity, minerals and their correlations in non-pigmented, red, and black rice. Food Chemistry. 239: 733-741. https://doi.org/10.1016/j.foodchem.2017.07.009
Shuyuan, L., Zeyi, A., Fengfeng, Q., Yuqiong, C., and Deijiang, N. 2017. Effect of steeping temperature on antioxidant and inhibitory activities of green tea extracts against α-amylase, α-glucosidase and intestinal glucose uptake. Food Chemistry. 234: 168-173. https://doi.org/10.1016/j.foodchem.2017.04.151
Srisawat, U., Panunto, W., Kaendee, N., Tanuchit, S., Itharat, A., Lerdvuthisopon, N., and Hansakul, P. 2010. Determination of phenolic compounds, flavonoids, and antioxidant activities in water extracts of Thai red and white rice cultivars. Journal of the Medical Association of Thailand. 93 (7): S83-S91. https://doi.org/10.1055/s-0030-1264431
Su, D., Wang, Z., Dong, L., Huang, F., Zhang, R., Jia, X., Wu, G., and Zhang, M. 2019. Impact of thermal processing and storage temperature on the phenolic profile and antioxidant activity of different varieties of lychee juice. LWT - Food Science and Technology. 116: 108578. https://doi.org/10.1016/j.lwt.2019.108578
Tabaraki, R., and Netghi, A. 2011. Optimization of ultrasonic-assisted extraction of natural antioxidants from rice bran using response surface methodology. Ultrasonics Sonochemistry. 18(6): 1279-1286. https://doi.org/10.1016/j.ultsonch.2011.05.004
Tang, Y., Cai, W., and Xu, B. 2016. From rice bag to table: fate of phenolic chemical compositions and antioxidant activities in waxy and non-waxy black rice during home cooking. Food Chemistry. 191: 81-90. https://doi.org/10.1016/j.foodchem.2015.02.001
Walter, M., Marchesan, E., Massoni, P.F.S., Picolli da Silva, L., Sartori, G.M.S., and Ferreira, R.B. 2013. Antioxidant properties of rice grains with light brown, red and black pericarp colors and the effect of processing. Food Research International. 50(2): 698-703. https://doi.org/10.1016/j.foodres.2011.09.002
Zaupa, M., Calani, L., Rio, D., Brighenti, F., and Pellegrini, N. 2015. Characterization of total antioxidant capacity and (poly)phenolic compounds of differently pigmented rice varieties and their changes during domestic cooking. Food Chemistry. 187: 338-347. https://doi.org/ 10.1016/j.foodchem.2015.04.055
Zeng, Z., Hu, X., McClements, D.J., Luo, S., Liu, C., Gong, E., and Huang, K. 2019. Hydrothermal stability of phenolic extracts of brown rice. Food Chemistry. 271: 114-121. https://doi.org/10.1016/j.foodchem.2018.07.180
Papichaya Netrprachit1, Nitra Nuangchamnong2, Nurul Shazini Ramli4, Faridah Abas3, 4, and Sudarat Jiamyangyuen1*
1Department of Agro-industry, Faculty of Agriculture, Natural Resources, and Environment, Naresuan University, Phitsanulok 65000, Thailand
2Science Laboratory Centre, Faculty of Science, Naresuan University, Phitsanulok 65000, Thailand
3Laboratory of Natural Products, Institute of Bioscience, Universiti Putra Malaysia, 43400 Serdang, Selangor, Malaysia
4Department of Food Science, Faculty of Food Science and Technology, Universiti Putra Malaysia, 43400 Serdang, Selangor, Malaysia
*Corresponding Author. Email: sudaratj@nu.ac.th
Total Article Views
Article history:
Received: November 1 2019;
Revised: March 9, 2020;
Accepted: March 23, 2020