 ISSN: 2822-0838 Online

Simple Cost-Effective Sequential Injection Lab at Valve with Remote Control Employing Everyday Communication Technology with a Webcam Camera Detector for the Determination of Iron and Phosphate as Model Analytes
Wasin Wongwilai, Kanokwan Kiwfo, Kitti Phojuang, Narong Kotchabhakdi, Pathinan Paengnakorn, and Kate Grudpan*Published Date : 2020-09-01
DOI : https://doi.org/10.12982/CMUJNS.2020.0057
Journal Issues : Number 4, October-December 2020
ABSTRACT Simple cost-effective sequential injection lab at valve (SI-LAV) with remote control employing everyday communication technology, and including a webcam camera detector, was developed for the determination of iron and phosphate as model analytes. The use of a webcam as a detector allowed recording of color data and monitoring flow behavior simultaneously. The remotely controlled system was operated via the internet using readily available software. The utility of the proposed system was investigated for the iron and phosphate reactions, representing fast and slow reaction models, respectively. The system performance was also demonstrated for the assay of phosphate in real samples.
Keywords: Sequential injection lab at valve (SI-LAV), Remote control, Webcam, Information technology (IT), Phosphate, Iron
INTRODUCTION
The sequential injection lab on valve (SI-LOV) system was developed by direct modification of a selection valve by incorporation of a microfluidic module for micro-scale manipulation of sample and reagents (Chen and Ruzicka, 2004). It has been demonstrated that application of SI-LOV on dirty samples was more effective than that of chip-based flow devices. However, SI-LOV is usually employed using expensive detection systems such as a fiber optic spectrophotometer, fluorescence spectrometer, or inductively coupled plasma mass spectrometry (ICP-MS).
Sequential injection lab at valve (SI-LAV) has been a proposed assembly by incorporating additional components to accommodate and monitor the reaction at, rather than within the valve (Grudpan, 2004). There have been a number of reports on SI-LAV, viz; for chloride determination, liquid-liquid extraction, and a kinetic study (Burakham et al., 2005; Jakmunee et al., 2005; Ganranoo, et al., 2011).
Information technology (IT) that is ubiquitous in everyday life includes hardware (e.g., computer notebooks, mobile phones, tablets), readily available, powerful communication and data handling software (e.g. Google, TeamViewer®, Skype®, Excel®), the internet and cloud storage, and many of these have been applied in various ways for chemical analysis (Grudpan et al., 2015).
Although, there are published works on the use of webcam cameras for colorimetric detection in flow analysis systems (Rodrigues and Lapa, 2010; Wongwilai et al., 2010; Andrade et al., 2013; Lima et al., 2013; Lima et al., 2014), thus far there has been no report of their use in a remotely controlled flow system.
In this work, an SI-LAV system employing information technology (IT) was developed for cost-effective chemical analysis with remote control operation from a laptop computer or mobile phone. A Complementary Metal Oxide Semiconductor (CMOS) webcam was employed as a colorimetric detector. Performance of the proposed system was investigated via determination of phosphate and iron as reaction models for slow and fast reactions, respectively. Application to real samples was demonstrated and compared with a standard spectrophotometric method for phosphate.
MATERIALS AND METHODS
Chemicals and reagents
Iron(II) determination: A solution of 2 %(w/v) of 1, 10-phenanthroline was prepared by dissolving 1 g of 1, 10-phenanthroline (Fisher Scientific, UK) in 50 mL of 20 % EtOH. A solution of 2.5 % (w/v) ascorbic acid was prepared by dissolving 2.5 g of L-ascorbic acid (Ajax, Australia) in deionized (DI) water (> 1 MΩ.cm at 25 °C, Milli-DI®, Merck, Germany) and ultrapure water (18.2 MΩ.cm at 25 °C, Simplicity®, Merck. Germany) and adjusting the volume to 100 mL. An acetate buffer pH 3.1 was prepared by mixing 10 mL of 2 M ammonium acetate (Ajax, Australia) with 390 mL of 2 M acetic acid (RCI Labscan, Thailand). A series of iron(II) standard solutions was prepared from dilution of 1.8 x 10⁴ μM iron (II) stock solution (Merck, Germany) to 18, 54, 90 and 125 μM
Phosphate determination: A 2.5 M sulfuric acid solution was prepared by diluting 70 mL of H2SO4 (RCI Labscan, Thailand) with ultrapure water and adjusting to 500 mL. A potassium antimonyl tartrate was prepared by dissolving 1.37 g of potassium antimonyl tartrate solution (K(SbO)C4H4O6.0.5H2O) (Merck, Germany) with 400 mL ultrapure water, then adjusting to 500 mL with ultrapure water. An ammonium molybdate solution was prepared by dissolving 20 g of ammonium molybdate ((NH4)6Mo7O24.4H2O), Fisher Scientific, UK) with ultrapure water and adjusting to 500 mL. 0.1 M ascorbic acid was prepared by dissolving 1.76 g of ascorbic acid (Ajax, Australia) with ultrapure water and adjusting to 100 mL. A 0.1 M phosphate standard stock solution was prepared by dissolving 1.3609 g of KH2PO4 (Fisher Scientific, UK) with DI water and adjusting to 100 mL. A series of standard solutions were diluted from the 0.1 M stock solution to 5, 10, 30, 50 and 70 µM.
SI-LAV system employing IT including CMOS webcam detector
The SI-LAV system consisted of a multi-position valve (1/16 inch, VICI, USA), syringe pump (2,500 microliter, Cavro® XLP 6,000, USA), holding coil (ID 0.003 inch, 2 meters’ length, Cole-Parmer, USA), and a switching valve (1/16 inch Cavro® XLP 6,000, USA). The SI-LAV system was controlled by in-house developed software (FBACTRL). The photo and color intensity were obtained using a CMOS webcam (Oker, China) via FBAIR software developed in-house. One photo was taken per second, and color data within a designed detection zone (DZ, 35x50 pixel) were recorded in an RGB color model system, which consists of red (R), green (G), and blue (B) channels as shown in Figure 3. The recorded data were saved as a CSV file, and were further evaluated using Microsoft Excel software.
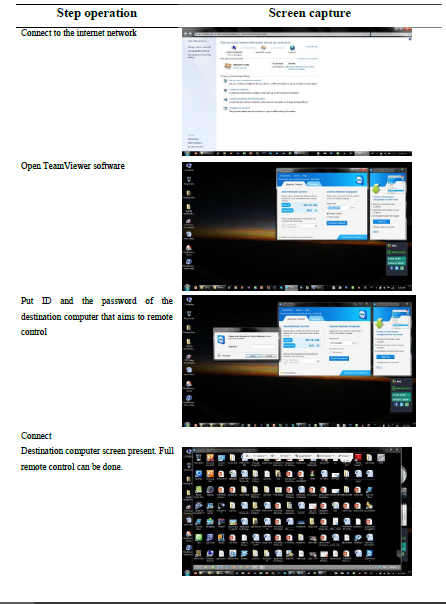
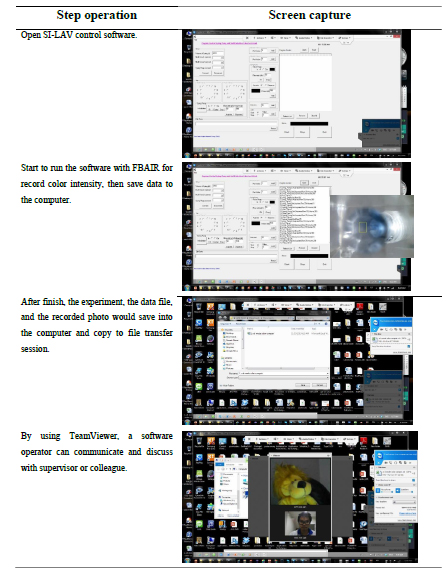
The SI-LAV system remote control was managed via an internet network by employing readily available software/application either Team Viewer®, VNC® or AnyDesk®. Table 1 demonstrates using Team Viewer® for remote control of the SI-LAV system via a laptop. For VNC® or AnyDesk®, operations were similarly applied by following the manuals. The control could also be made via computer notebooks, mobile phones, or tablets.
Table 1. Step operation of TeamViewer software for remote control of SI-LAV system with CMOS webcam detector via laptop.
RESULTS AND DISCUSSION
Remote operations of SI-LAV system with CMOS webcam detector
An SI-LAV system employing with a CMOS webcam camera as a detector was designed and developed as illustrated in Figure 1(a). A micro-chamber was placed at one port of a multi-position valve without any modification from the purchased original to accommodate a relevant reaction. It was made of a piece of acrylic 1.5 cm x 1.5 cm (as shown in Figure 1(d)), with a total volume of 300 µL, allowing micro-liter manipulation of sample and reagents as shown in Figure 1(b), 1(c). A CMOS webcam detector was placed on the top of the chamber to monitor any change of color due to the reaction in the small chamber as shown in Figure 1. The FBAIR software was used for data acquisition by taking a photo and recording color intensity every second.
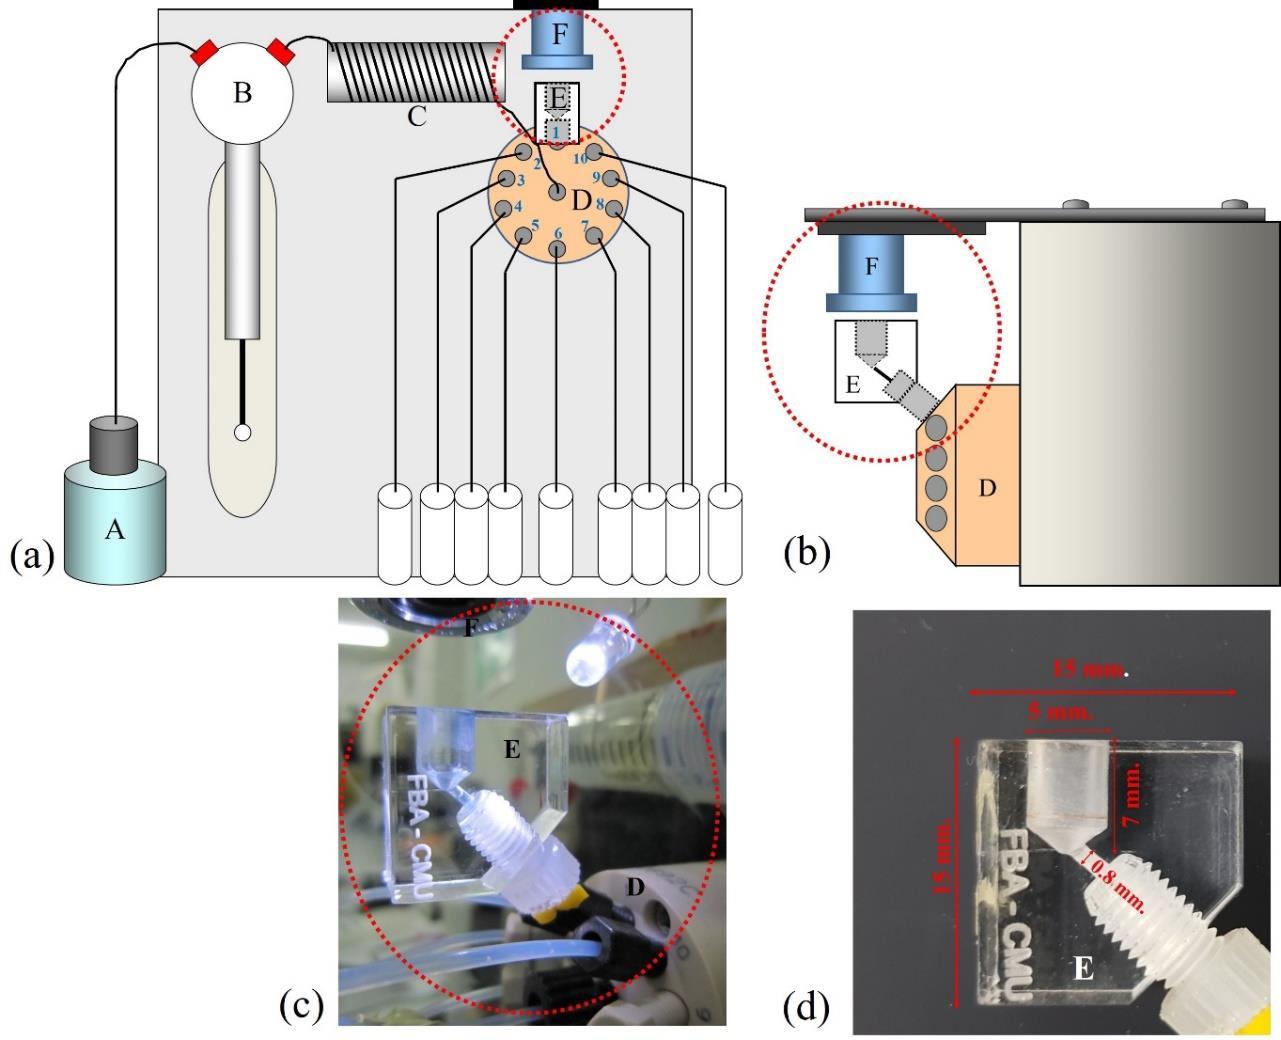
Figure 1. The SI-LAV system: (a) schematic diagram, (b) side view illustrating attachment of webcam camera together with chamber to a port of multi-position valve, (c) photo of (b), (d) dimension of (b) (A: carrier, B: syringe pump, C: holding coil, D: 10 ports multi-position valve, E: chamber, F: CMOS webcam camera).
The SI-LAV system was controlled remotely from another computer or mobile phone via TeamViewer software, which is normally used for network remote access and support, and data transfer was performed as shown in Figure 2. This could be useful for remote, on-site process analysis. Also, real-time data sharing and consulting with other team members or experts in the field were also possible via internet networking.
Figure 2 illustrates remote control of the SI- LAV system, using either a laptop computer (a) or a mobile phone (b). The controlling system was connected to the station PC via internet connection such as Wi-Fi, 3G or 4G for controlling the SI-LAV for operations such as pump control, valve switching, detector interrogation and data evaluation.
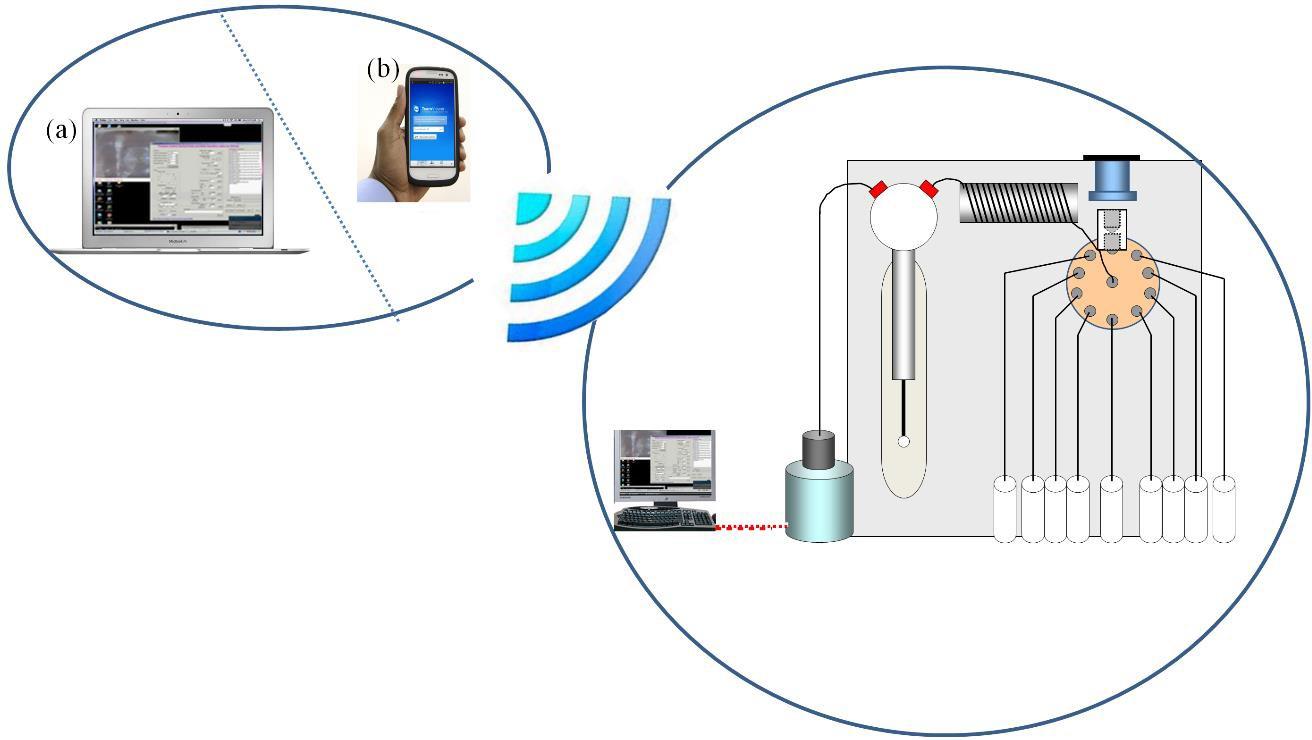
Figure 2. Remote control of the SI- LAV system via the internet with IT devices (a) a laptop computer and (b) a mobile phone.
Figure 3 illustrates that photos were recorded in each second along with color intensity data during an experiment. The color change was followed in a defined detection zone (DZ) while the whole mixing phenomenon could be observed in real-time (c.f. Figure 3(c)). This ability to monitor color change while a reaction is proceeding, as well as observing solution mixing behavior, is not possible using a fiber-optic spectrophotometer, as it only monitors color change in a smaller area. This could be useful for studying the reaction and dispersion of products inside the reaction chamber.
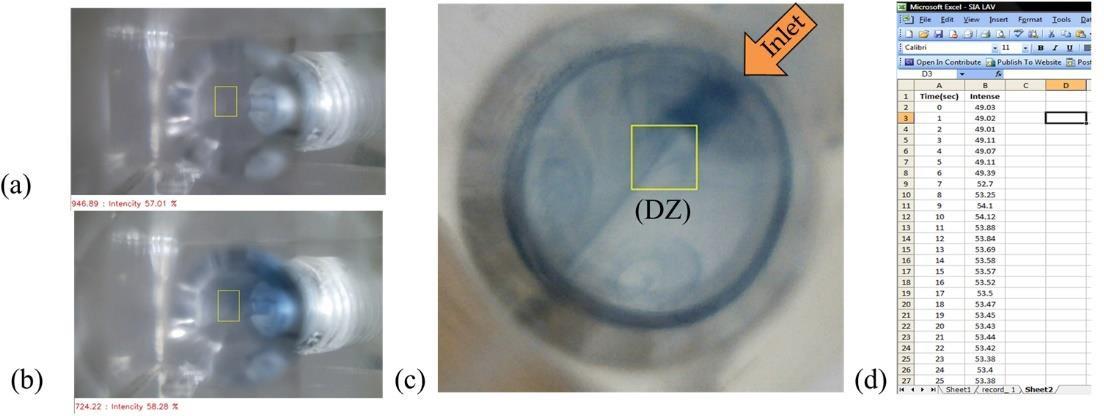
Figure 3. Illustration of information (the reaction of phosphate with molybdate) obtained from using webcam camera as a detector: photos (a) and (b) taken in sequence of desired time interval, (c) closeup of the photo, (d) recorded color intensity values of a given detection zone (DZ) in (c).
Performance test for the SI-LAV system with CMOS webcam detector
The proposed system was tested using the assays of phosphate and iron as model reactions.
Determination of phosphate using molybdate and determination of iron using 1, 10-phenanthroline were chosen as slow and fast model reactions, respectively.
Determination of phosphate with molybdate
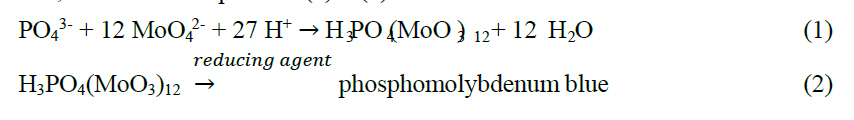
The phosphate determination is based on the molybdenum blue reaction, consisting of two reaction steps. First, a complexation between heptamolybdate and phosphate occurs under acidic condition to form molybdophosphoric acid, followed by a reduction with ascorbic acid to a product, phosphomolybdenum blue, as shown in Equations (1) – (2).
Using the proposed system with a set of conditions derived from previous experiences (Grudpan, 2004; Apichai et al., 2019), it was designed for phosphate standard/sample to be aspirated via port 10 to holding coil while sulfuric acid via port 9, potassium antimonyl tartrate via port 8, ammonium molybdate via port 7, and ascorbic acid was connected via port 6. No flow reversal was made, but all the sequenced segments were dispensed into the chamber, where the mixing and reaction occurred. A color change was followed by the CMOS webcam detector, and waste was emptied from the chamber via port 3.
Figure 4 shows a plot of recorded color intensity against time. The reaction was slow and required more than 100 s to reach a constant intensity. By using an excess concentration of molybdate and ascorbic acid, the reaction rate for phosphate depends on the concentration of phosphate (Apichai et al., 2019). It was found that the color intensity was proportional to phosphate concentration as shown in Figure 4 (a) and gave a linear response in the range 5-70 μM at 100 s and 300 s as shown in Figure 4 (b); color intensity due to R = 0.186 [phosphate] + 53.9, R2 = 0.998 and color intensity due to R = 0.221[phosphate] + 55.8, R2 = 0.995, respectively. From calibration graphs, LOD and LOQ were calculated using the linear regression method (Miller and Miller, 2005); LOD are 5 and 8 μM and LOQ are 17 and 26 PO43- μM at 100 s and 300 s, respectively. It was noted that calibration equations obtained at 100 s and 300 s show similar linearity characteristics. Although the longer reaction time exhibited a slight increase in sensitivity, the calibration at 100 s was chosen for further experiment because it gave a lower LOD and a shorter analysis time.
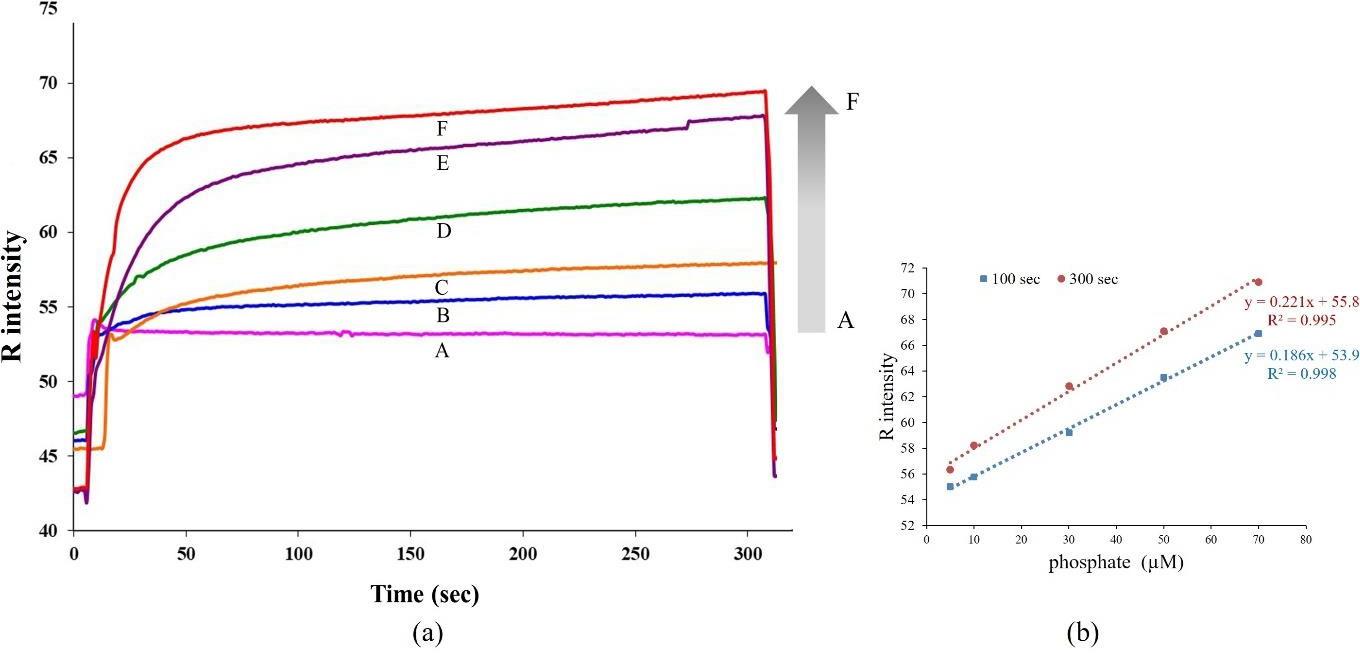
Figure 4. (a) Signal profiles for standard phosphate solutions with various concentrations; A: blank, B: 5, C:10, D: 30, E: 50 and F: 70 µM,
(b) calibration graphs at 100 and 300 s.
Determination of iron (II) with 1,10 phenanthroline
An iron assay, using 1,10 phenanthroline chemistry is a well-known reaction (American Public Health Association, 1915). It is based on a complexation between iron(II) and 1,10 phenanthroline (phen) under acidic condition, resulting in a red color product, ferroin ([Fe(phen)3]2+) as shown in Equation (3);
Fe2+ + 3 phen [Fe(phen)3]2+ (3)
Employing the proposed system with a set of reaction conditions derived from previous experience (Apichai et al., 2019), it was designed for iron (II) standard/sample to be aspirated via port 10 into holding coil, while ascorbic acid via port 9, acetate buffer via port 8 and 1, 10-phenanthroline via port 7. No flow reversal was made but all the sequence segments were dispensed into the mini-chamber via port 1. The mixing and reaction took place in the reaction chamber, where it was monitored by the CMOS webcam detector and waste was emptied from the chamber via port 3. The information regarding the mixing of solutions and chemistry progress was able to be followed.
In Figure 5, the signal was recorded as color intensity per time. As a fast reaction, the signal profile increased very fast in a few seconds and became stable after dispensing all solutions into the microchamber. It was found that the color intensity was proportional to iron (II) concentration as shown in Figure 5 (a) and a linear relation was obtained between the range 18-125 μM at 50 s and 200 s as shown in Figure 5(b); color intensity due to B = 0.0503[iron] + 51.5, R2 = 0.995 and color intensity due to B = 0.0482[iron] + 51.4, R2 = 0.998, respectively. LOD and LOQ were calculated from obtained calibration using the Miller’s method (Miller and Miller, 2005); LOD are 12 and 8 Fe2+ μM, and LOQ are 40 and 26 Fe 2+ μM at 50 s and 200 s, respectively. It was found that the calibrations equations obtained from 50 s and 200 s showed no significant difference in sensitivity and linearity range due to the fast reaction of ferroin complex formation.
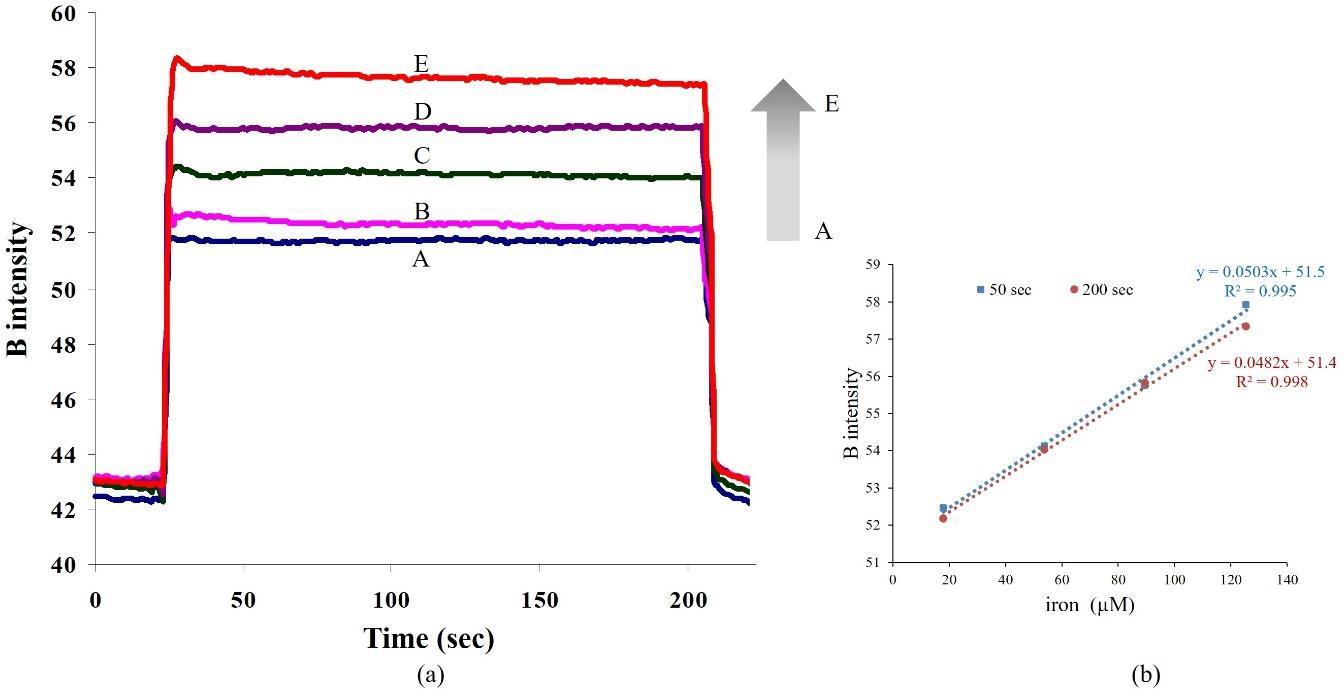
Figure 5. (a) Signal profiles of iron (II) via 1, 10-phenanthroline reaction with various iron (II) concentrations; A: blank, B: 18, C: 54, D: 90 and E: 125 µM, (b) calibration graphs at 50 and 200 s.
Application of the remote SI-LAV system including CMOS webcam detector to phosphate analysis in real samples
In this study, application of the SI-LAV system was demonstrated via phosphate assay in real samples; frozen seafood samples. As one of the food additives commonly used in food processing, the amount of phosphate in food should be monitored for food safety purposes. The results obtained from the remote SI-LAV system were compared with those of the spectrophotometric method as a standard method for phosphate determination in food (AOAC, 2000). For frozen seafood samples, 100 g of food samples were soaked and stirred in 1 L of ultrapure water for 30 minutes at room temperature. The supernatant was filtered using Whatman no. 1 filter paper, all samples were diluted 300-fold and then analyzed using the SI-LAV system.
Table 2 shows the results for frozen food samples, and it was found that the amounts of phosphate from the SI-LAV system compared favorably with those obtained from the reference spectrophotometric method.
Table 2. Water-soluble phosphate contents in frozen seafood samples obtained from the remote SI-LAV system and the conventional spectrophotometric method as a reference method, n=3.
|
Sample |
Water-soluble phosphate content (mg/kg) |
|||
|
|
||||
|
SI-LAV
|
Reference method1
|
|||
|
Shrimp 2 |
1950 ± 20 |
2010 ± 50 |
|
|
|
Fish 2 |
4140 ± 40 |
4020 ± 110 |
|
|
Note: 1Reference method; AOAC methods 50.1.12 and 50.1.15; 2100 g of food samples were soaked and stirred in 1 L of water for 30 minutes, water-soluble phosphate of the sample was estimated; water-soluble phosphate content (mg/kg)
= (A x B x C ) x D
1000 E
where A is concentration obtained from calibration, μM; B is dilution factor; C is molecular weight of phosphate 94.971, g.mol-1; D is extract solution volume, L, and E is sample weight used in extract solution, kg.
CONCLUSION
The developed remote SI-LAV employing everyday IT including webcam camera offers a cost- effective tool in networking chemical analysis that would be useful for process analysis and the study of chemical kinetics and solution mixing phenomena. In this study, iron and phosphate were chosen as model analytes. Application of the proposed system to real samples was demonstrated via phosphate assay in frozen seafood samples. For further study, an automation unit/process could be developed for sample preparation for SI-LAV analysis, e.g. digestion for total Fe ana determination. The developed sample preparation unit when connected to the developed remote SI-LAV unit would enable greater versatility in sample handling and manipulation. The studied results suggest that the proposed system with remote control could be further developed for routine analysis in industry or the public health sector, such as product quality control and food safety monitoring, where automation and remote operation are needed.
ACKNOWLEDGEMENTS
The Thailand Research Fund (TRF) Distinguished Research Professor Award Grant (DPG6080002 to Kate Grudpan), The TRF- Royal Golden Jubilee Ph.D. (for a scholarship to Kanokwan Kiwfo (PHD/0349/2552)) and Chiang Mai University (through the Center of Excellence on Innovation in Analytical Science and Technology (I-ANALY-S-T), the Science and Technology Research Institute and the Graduate School) are thanked. We thank Assoc. Prof. Ian McKelvie for comments and editing the manuscript.
REFERENCES
American Public Health Association. 1915. Standard Methods for the Examination of Water and Wastewater. Washington D.C.: American Public Health Association.
Andrade, S.I.E., Marcelo, B.L., Inakã, S. B., Wellington, S.L., Luciano, F.A., Mário, C.U.A., and Edvan, C.S. 2013. A digital image-based flow-batch analyzer for determining Al(III) and Cr(VI) in water. Microchemical Journal. 109: 106-111. https://doi.org/10.1016/j.microc.2012.03.029
AOAC. 2000. Official methods of the association of official analytical chemists. Washington D.C.: Association of Official Analytical Chemists.
Apichai, S., Thajee, K., Wongwilai, W., Wangkarn, S., Paengnakorn, P., Saenjum, C., and Grudpan, K. 2019. A simple platform with moving drops for downscaling chemical analysis incorporating smartphone detection. Talanta. 201: 226-229. https://doi.org/10.1016/j.talanta.2019.04.014
Burakham, R., Lapanantnoppakhun, S., Jakmunee, J., and Grudpan, K. 2005. Exploiting sequential injection analysis with lab-at-valve (LAV) approach for on-line liquid-liquid micro-extraction spectrophotometry. Talanta. 68 (2): 416-421. https://doi.org/10.1016/j.talanta.2005.09.002
Chen, Y., and Jaromir, R. 2004. Accelerated micro-sequential injection in lab-on-valve format, applied to enzymatic assays. Analyst. 129 (7): 597-601. https://doi.org/10.1039/b401831a
Grudpan, K. 2004. Some recent developments on cost-effective flow-based analysis. Talanta. 64(5): 1084-1090. https://doi.org/10.1016/j.talanta.2004.07.046
Grudpan, K., Kolev, S.D., Lapanantnopakhun, S., McKelvie, I.D., and Wongwilai, W. 2015. Applications of everyday IT and communications devices in modern analytical chemistry: a review. Talanta. 136: 84-94. https://doi.org/10.1016/j.talanta.2014.12.042
Jakmunee, J., Patimapornlert, L., Suteerapataranon, S., Lenghor, N., and Grudpan, K. 2005. Sequential injection with lab-at-valve (LAV) approach for potentiometric determination of chloride. Talanta. 65(3): 789-793. https://doi.org/10.1016/j.talanta.2004.08.007
Lima, M.B., Andrade, S.I.E., Silva Neta, M.S., Barreto, I.S., Almeida, L.F., and Araújo, M.C.U. 2014. A micro-flow-batch analyzer using webcam for spectrophotometric determination of ortho-phosphate and aluminium(III) in tap water. Journal of the Brazilian Chemical Society. 25(5): 898-906. https://doi.org/10.5935/0103-5053.20140059
Lima, M.B., Andrade, S.I.E., Barreto, I.S., Almeida, L.F., and Araújo, M.C.U. 2013. A digital image-based micro-flow-batch analyzer. Microchemical Journal. 106: 238-243. https://doi.org/10.1016/j.microc.2012.07.010
Lucksagoon, G., Lapanantnoppakhun, S., and Grudpan, K. 2011. Chemical kinetic study using sequential injection systems incorporating lab-at-valve with a longer (30 mm) path Z-cell. 28(1): 7-12. http://doi.org/10.24688/jfia.28.1-7
Miller, J.N., and Miller, J.C. 2005. Statistics and Chemometrics for Analytical Chemistry. Pearson/Prentice Hall.
Rodrigues, Eunice R.G.O., and Rui, Lapa A.S. 2010. CMOS arrays as chemiluminescence detectors on microfluidic devices. Analytical and Bioanalytical Chemistry. 397(1): 381-388. https://doi.org/10.1007/s00216-010-3518-x
Wongwilai, W., Lapanantnoppakhun, S., Grudpan, S., and Grudpan, K. 2010. Webcam camera as a detector for a simple lab-on-chip time based approach. Talanta. 81(3): 1137-1141. https://doi.org/10.1016/j.talanta.2010.01.058
Wasin Wongwilai1,2, Kanokwan Kiwfo1,3, Kitti Phojuang1,4, Narong Kotchabhakdi1,3, Pathinan Paengnakorn1,5, and Kate Grudpan1,2,3*
1Center of Excellence for Innovation in Analytical Science and Technology, Chiang Mai University, Chiang Mai 50200, Thailand
2Science and Technology Research Institute, Chiang Mai University, Chiang Mai 50200, Thailand
3Department of Chemistry, Faculty of Science, Chiang Mai University, Chiang Mai 50200, Thailand
4Environmental Sciences Program, Faculty of Science, Chiang Mai University, Chiang Mai 50200, Thailand
5Biomedical Engineering Institute, Chiang Mai University, Chiang Mai 50200, Thailand
*Corresponding author. E-mail: kgrudpan@gmail.com
Total Article Views
Article history:
Received: February 24, 2020;
Revised: March 11, 2020;
Accepted: March 13, 2020