 ISSN: 2822-0838 Online

Amorphous SiO2 Nanoparticles from Natural Sands: Structure and Porosity
Munasir*, Lydia Rohmawati, Ahmad Taufiq, and DarmintoPublished Date : 2020-07-17
DOI : https://doi.org/10.12982/CMUJNS.2020.0037
Journal Issues : Number 3, July-September 2020
ABSTRACT Silica (SiO2) nanoparticles (NPs) generally include mesoporous materials (2–50 nm), having broad application prospects, such as for drug delivery systems. In this study, we report the porosity of amorphous SiO2 NPs by investigating their crystal structure, morphology, diameter, and volume of pores. Amorphous SiO2 NPs have been prepared from quartz sand, heated at a temperature range from 500 to 1,200 °C. The identification of the crystal structure was performed using XRD, the morphology and grain growth particles were considered using SEM, and the diameter and volume of pores were investigated using BET. An FTIR analysis was used to analyze the -Si-O and Si-OH functional groups. The results of this study presented that at a calcination temperature range of 500–800 °C, the crystal structure disappeared. However, at a temperature of 1,000 °C, a new crystalline tridymite structure was observed. Furthermore, the structural transformation was observed at a temperature of 1,200 °C from the amorphous phase to the polycrystalline phase consisted of quartz, cristobalite, and tridymite structures. During the calcination process, as the particles’ pore size grew more significantly, the number of grain boundaries decreased, influencing the particle porosity sizes. The results of the analysis using BET presented that the pore surface area and pore volume of the samples tended to be smaller, along with increasing calcination temperature.
Keywords: Structural transformation, Amorphous SiO2, Nanoparticle, Porosity, Calcination temperature
INTRODUCTION
In general, quartz sands from the Bancar-Tuban, Indonesia area contain many oxide elements, including SiO2, Fe2O3, CaCO3, Al2O3, and a few other oxides; which are clean brown (Akl et al. 2013; Munasir et al., 2013; Sdiri et al., 2014). Furthermore, the color of the quartz sands is bright white or another, depending on its contaminant compounds. Other physical properties of the quartz sands are given as follows; hardness of 7 Mohs, specific gravity of 2.6–2.7 (g.cm-3), melting point of 1,715 °C, specific thermal of 830 (J.kg-1.°C-1), and thermal conductivity of 7.7–8.4 (W.m-1.K-1). Silica has the crystalline structures of quartz, cristobalite, and tridymite with the temperature stability of 870 °C, from quartz to cristobalite, and 1,470 °C, from cristobalite to tridymite (Guttman, 1990; Marians and Hobbs, 1990; Stevens et al., 1997; Dapiaggi et al., 2015). Interestingly, slica NPs can be prepared from natural quartz sands (Munasir et al., 2013), siliceous sands (Sdiri et al., 2014), and douiret sands (Trabelsi et al., 2009). The synthesis routes can be employed by the alkali fusion by using KOH at a temperature of 350 °C (Mori, 2003), NaOH at a temperature of 500 °C (Mori, 2003; Munasir et al., 2013), and Na2CO3 at a temperature of 1,100 °C (Trabelsi et al., 2009). Moreover, the synthesis methods can also be conducted by using hydrothermal method or chemical process (Zulfiqar et al., 2016), such as the precipitation, reverse microemulsion, and flame synthesis, and sol-gel process (Guo et al., 2017).
The natural raw materials as sources of silica are hardcore such as diorite and gabbro (Jang et al., 2008; Trabelsi et al., 2009; Waseem et al., 2009), quartz sands (Munasir et al., 2013, 2015), clays or muds, organic materials such as rice hush ash (Liou, 2004; Nittaya Thuadaij, 2008), and bagasse ash (Affandi et al., 2009). Quartz sand is commonly found in coastal areas of rivers, lakes, beaches, and some in shallow seas. Most of the content of quartz sand is silica (SiO2), which is 55.30-99.87 wt% (Munasir et al., 2015). Silica is widely used in various applications such as for mixed materials in concrete (Said et al., 2012; Heikal et al., 2013); tire industry, rubber nanocomposites (Chen et al., 2008), emulsion wall-paint (Mizutani et al., 2006), lotions and cosmetics, ingredient cosmetic efficacy (Fruijtier-Pölloth, 2012), ceramics (Said et al., 2012; Heikal, 2013; Obrtlík et al., 2017), heavy metal absorbent material of Cd+2 and Pb+2 (Saad Al-Farhan, 2016), Fe3O4@SiO2 core-shell (Karimi et al., 2016), wrapper drugs (Barbé et al., 2004; Kwon et al., 2013), packaging, and anti-bacterial agents (Wang et al., 2007; Luo et al., 2015). Silica NPs can also be applied for developing renewable energy, such as for material for ion-lithium batteries, electrodes (Favors et al., 2014), electrolytes (He et al., 2005; Park et al., 2007), and separators (Fu et al., 2012). However, the toxic effects produced by silica NPs (Demir and Castranova, 2016) should be overcome.
In nature, the silica particles in macro and micro sizes form a stable phase in the quartz phase. However, in a nanometric size, silica particles normally construct an amorphous phase (Munasir et al., 2015). Synthesis of amorphous silica NPs from natural materials either from organic or inorganic materials (Kalapathy et al., 2002; Affandi et al., 2009; Munasir et al., 2015). Recently, a previous work reported that silica NPs prepared from silica sands via a coprecipitation route, constructing SiO2-cristobalite and tridymite phases (Munasir et al., 2015). Furthermore, silica NPs which were prepared from organic sugarcane bagasse ash, rice husk ash through the combustion process at a temperature of 900 °C produced tridymite and cristobalite phases (Affandi et al., 2009, Rahman and Padavettan, 2012). Therefore, this work concerned on producing silica powders in nanometric size using a continuous method, including a hydrothermal process to obtain a sodium silicate precursor solution, following by a co-precipitation process to get silicit acid Si(OH)4, and modification of the hydrothermal method and calcination of silica NPs to be analyzed of their crystalline phase and porosity transformation.
MATERIALS AND METHOD
Materials
The raw materials in this study were natural sands from Bancar-Tuban, East-Java, Indonesia, chloric acid, sodium hydroxide, and demineralized water. Some supporting equipment for the synthesis process were hot-plate magnetic stirrer, pH meter, reaction glass, measuring cup, and magnetic bar.
Experimental methods and data analysis
The natural sands were ground and filtered to obtain fine powders with a size of approximately 250 μm. It was then mixed with NaOH (7 M) and stirred wisely for 2 h to get sodium silicate solution. The solution was dried at room temperature for 24 h. Furthermore, a reaction with HCl (2 M) was done to obtain a neutral pH with the characteristic of a white gel. The gel was then filtered and whased by demineralized water for several times. The precipitate of Si(OH)2 (silica gel) was dried using 100 W lamp for 2 days. The calcination process of NPs was varied at temperatures of 500 (sample #1), 800 (sample #2), 1,000 (sample #3), and 1,200 °C (sample #4) with the holding time of 10 h.
The obtained samples were then characterized by XRD, FTIR, SEM, and BET. A Fourier-transform infrared (FTIR) spectroscopy (Shimadzu, Type: IRPrestige 21) was used to identify the functional groups of -OH, Si-O, and Si-O-Si. Crystal structure and quantitative phase characterization were conducted using X-ray diffraction (XRD) using monochromatic Cu-Kα radiation operating at 40kV/40mA (PAN Analytical, X-Pert Pro). All XRD data were collected under the same experimental conditions with a 2θ range of 5°-90°. The characterization of microstructure, shape, and grain size of the samples was conducted by scanning electron microscopy (SEM) with the operating conditions at 20 kV and 60 μA and magnification 10,000 times. A Brunauer-Emmet-Teller technique was employed to investigate the porosity size, i.e., surface and volume of pores. Meanwhile, a Barret-Joyner-Halenda (BJH) was used to determine the distribution of pore diameter porosity (Quercia et al., 2013). In this work, the BET was used to determine the porous surface area (SP), porous volume (VP), and porous radii (Dv) of the samples.
RESULTS
XRD analysis
The diffraction patterns of silica NPs heated at temperatures of 500, 800, 1,000, and 1,200 °C are presented in Figure 1. It is shown that the samples #0, #1, #2, and #3 were dominated by amorphous phase. However, the existence of a single peak appeared at 2q of ~21.6° for sample #3. The sample calcined at a temperature of 1,000 °C started to form cristobalite phase (Shinohara et al., 2004). For the sample (#0) that calcined at temperatures of 500 (sample #1) and 800 °C (sample #2), the diffraction patterns presented the diffraction peaks at 2q of ~22.01°.
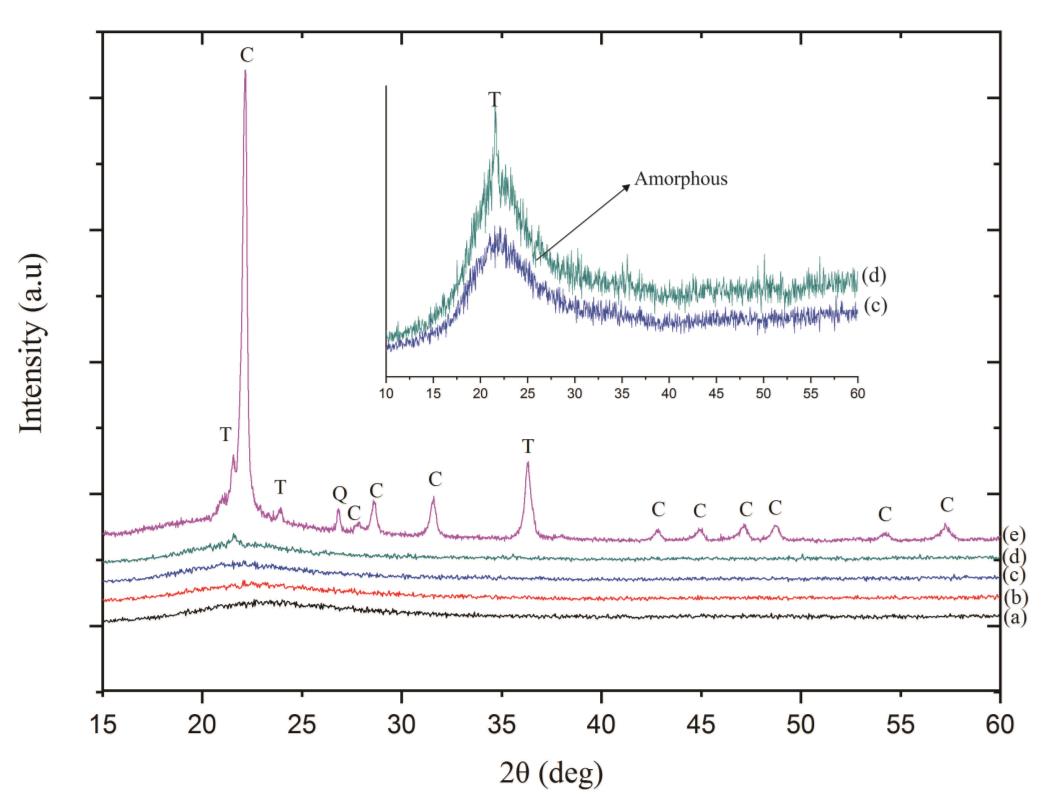
Figure 1. X-ray diffraction patterns of the samples: (a) no-calcination (sample #0), (b) #1, (c) #2, (d) #3, and (e) #4.
It can be observed for the sample #3 calcined at 1,000 °C that a single peak was detected at 2q of 22.97°, indicated that there was a formation of a small peak identified as tridymite phase (Figure 1); confirmed by PDF no. 96-901-3493. For sample#4, the polycrystalline phase was dominated by the cristobalite phase (PDF no. 39-1425). The quartz phase was confirmed with a diffraction peak at 2q of 26.68° (PDF no. 01-071-1540). Furthermore, a quantitative analysis presented that quartz, thymidine, and cristobalite with the compositions of 8.4%, 14.2%, and 77.4%, respectively. The samples calcined at the temperatures of 800-1,000 °C presented the cristobalite and tridymite with in line with the previous work (Shinohara et al., 2004; Munasir et al., 2018). The cristobalite and tridymite phased constructed from amorphous SiO2 at the temperatures of 800-1,350 °C. In more specific, sample #0, #1, and #2 had a diffraction peak 2q of approximately at 20.69° owing to the quartz phase with PDF no. 46-1045.
FTIR analysis
FTIR characterization was done to determine the functional groups of the samples. The infrared spectra for the samples are shown in Figure 2. The peaks at 465–475, 800–870, 960–1,115, and 3,000–4,000 cm-1 associated with the O-Si- vibration, Si-O-Si asymmetry vibration, and OH.
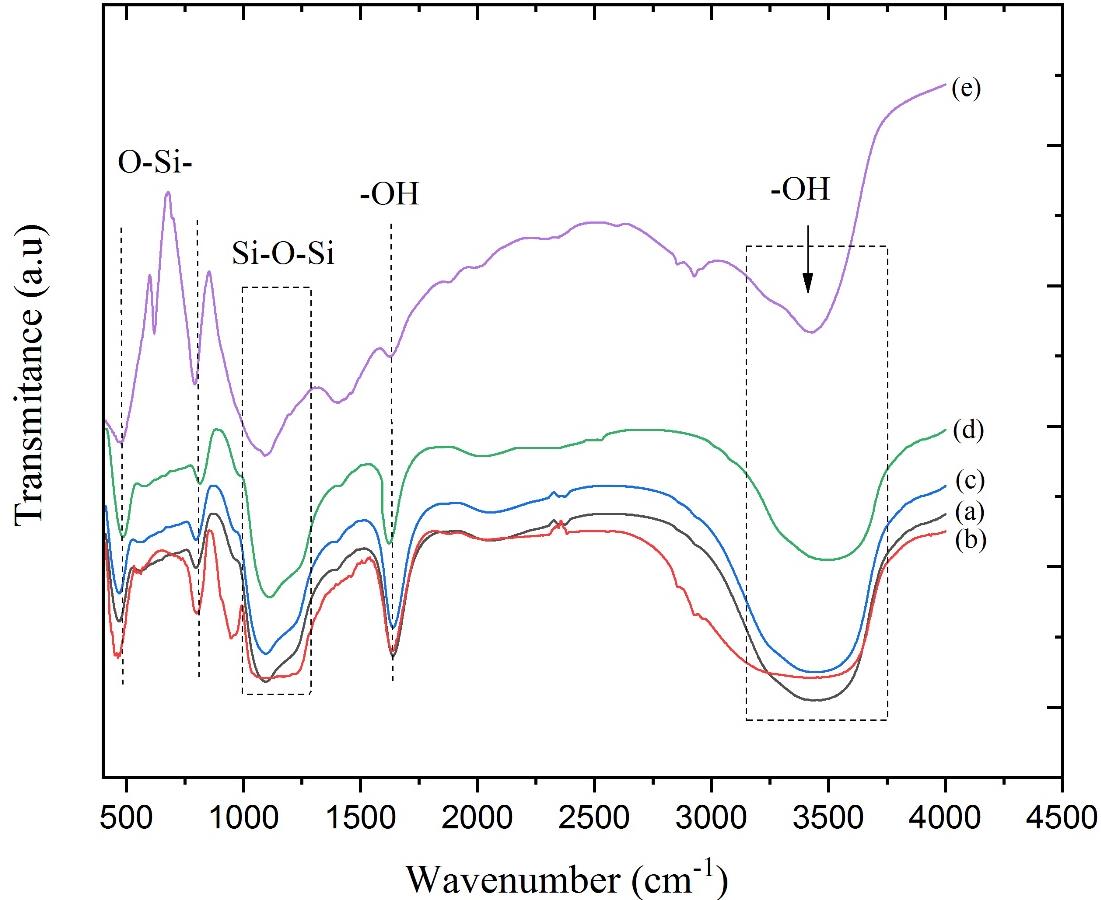
Figure 2. Infrared spectra of the samples #0 (a), #1 (b), #2 (c), #3 (d), and #4 (e).
Table 1. Functional groups of the samples.
|
Functional Groups |
Wavenumber (cm-1) |
References |
|
Si-O |
465-475 |
Rahman (2012), Jal et al. (2004) |
|
-OH |
800-870 |
Wasem (2009), Jal et al. (2004) |
|
Si-O-Si asymmetric vibration |
1,000-1,115 |
Wasem (2009), Jal et al. (2004) |
|
-OH (molecule H2O)
|
1,639, |
Wasem (2009), Rahman (2012), |
SEM analysis
SEM images of the samples are presented in Figure 3. In general, the formation of grain patterns that were larger for the higher calcination temperature. This phenomenon coincides with the formation of new crystalline phases, as shown by the diffraction patterns in Figure 1 for sample #3 and sample #4.
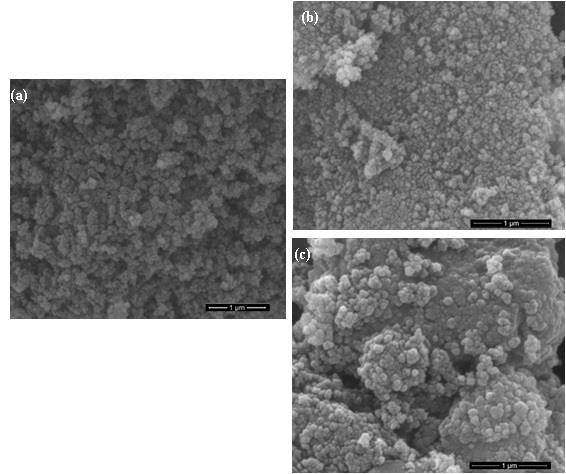
Figure 3. SEM images of the samples: (a) without calcination (#0), (b) calcination at a temperature of 1,000 (#3), and (c) 1,200 ºC (#4).
The SEM images of the samples after calcination (samples #3 and #4) are given in Figure 4. It can be seen that the samples are agglomerated with the geometry of spherical and oval shapes. It is shown that the grain sizes increased as increasing calcination temperature for samples #3 and #4). The grain area sizes were 291.6, 391.9, and 594.1 nm2 for the respective samples #0, #3, and #4). Meanwhile, the diameter sizes of the respective samples were 19.2, 22.3, and 27.6 nm. The SEM images inform that the porosity of the particles is getting smaller due to the growth of particle grains; particle surface area is getting narrower.
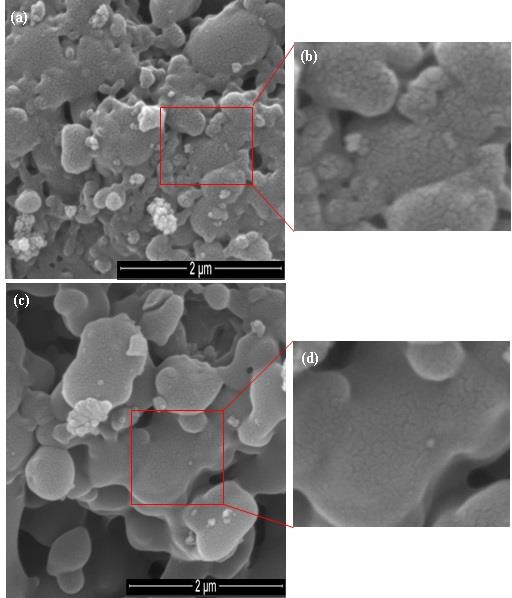
Figure 4. SEM images of the samples after calcination: #3 (a, b) and #4 (d, e).
Porosity analysis
The BET method was used to determine the pore surface area, pore-volume, and pore type of solid material. In contrast, the BJH m and DH were used to emphasize more on how the quantitative pore size distribution was obtained by the pore radius, pore surface area, and pore volume of NPS. Isothermal adsorption and absorption profiles of nitrogen gas (temperature 77.35 K) on the samples before calcination (#0) and after calcining at 1,000 and 1,200 ºC (samples #3 and #4) can be seen in Figure 5. Based on the graph, Vp as the function of P/Po, as shown in Figure 5, the turning point of the adsorption graph (violet, blue, and black) and the desorption (brown, green, and red) of nitrogen gas as adsorbate with the temperature of 77.35 K, molecule weight of 28.013 g, cross-section of 16.20 Å, and liquid density of 0.808 g/cc.
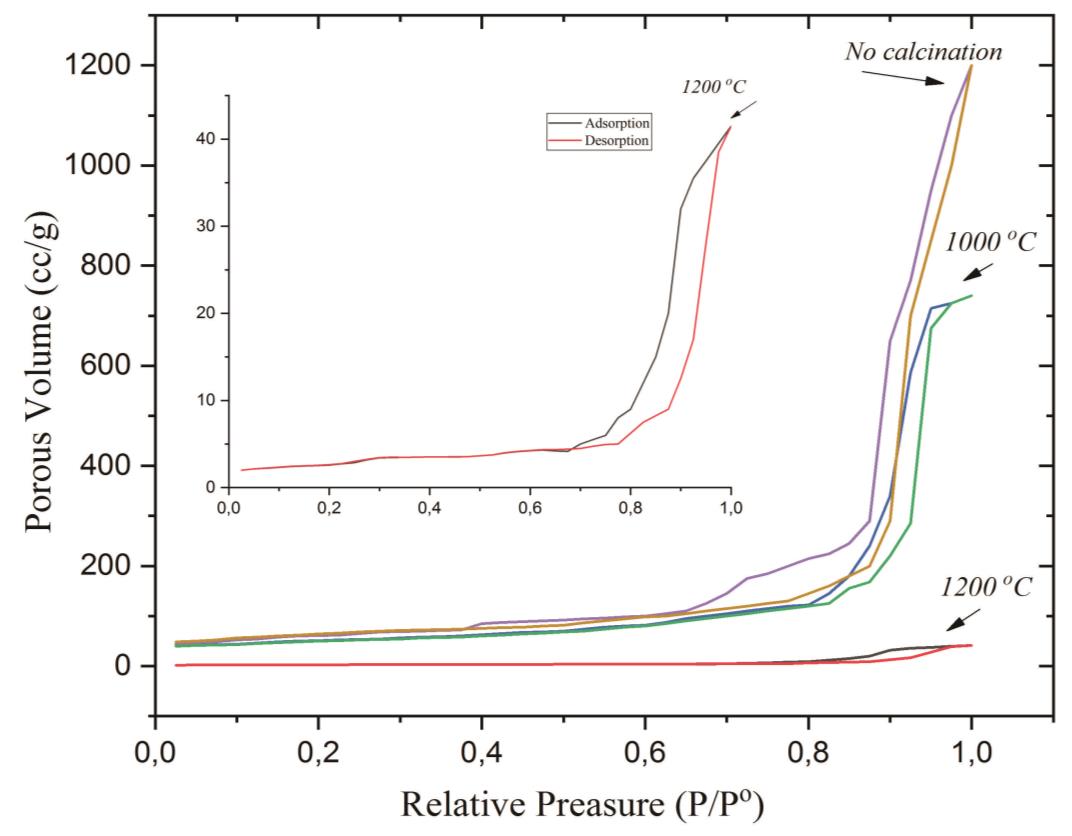
Figure 5. N2 adsorption-desorption isothermal of samples: (a) without calcination (#0), (b) calcination at a temperature of 1,000 (#3), and (c) 1,200 ºC (#4).
Hysteresis loop of particles without calcination is in line with H1-type, whose dominant porous structure is cylindrical porous, whereas after calcination is included in H2-type, the porous structure has a narrow neck like an ink-bottle. The effect of calcination temperature on the pore size distribution profile of silica particles (Dv(r) to the porous volume differential dV(r)) is shown in Figure 6.
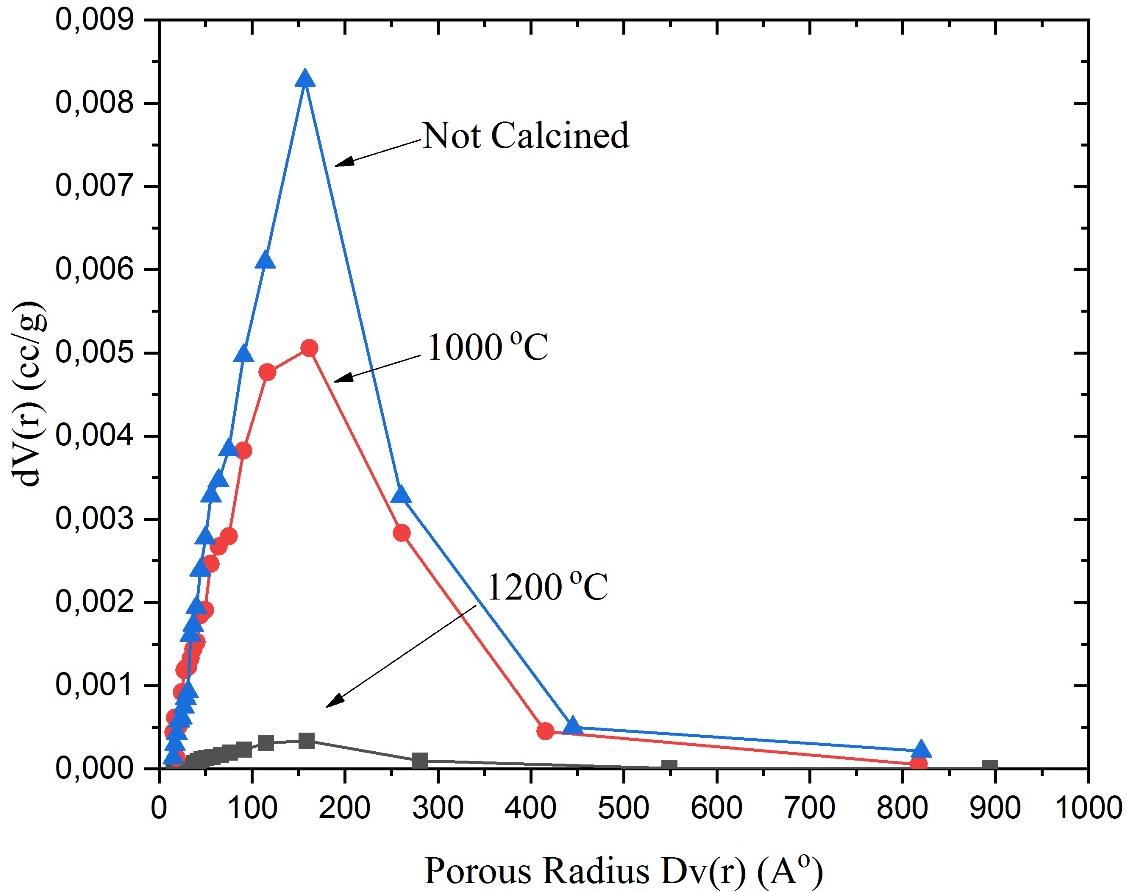
Figure 6. Porous sizes distribution of the samples: no calcination (#0), and calcination at a temperature of 1000 (#3) and 1200 ºC (#4).
Table 2. Pore size, pore surface area and pore volume of the samples before calcination and after calcination (BET, BJH and DH methods).
|
Porosity |
Methods |
Before calcination |
After calcination |
|||
|
(sample #0) |
(sample #3) |
(sample #4) |
||||
|
Pore surface area S(m2/g) |
BET |
293.6 |
182.9 |
10.24 |
||
|
BJH |
Adsorption |
217.3 |
167.4 |
8.811 |
|
|
|
Desorption |
331.5 |
201.7 |
15.32 |
|
||
|
DH |
Adsorption |
218.6 |
169.3 |
8.883 |
|
|
|
Desorption |
335.3 |
204.9 |
15.60 |
|
||
|
Pore volume Vp(cm3/g) |
BJH |
Adsorption |
1.826 |
1.144 |
0.064 |
|
|
Desorption |
1.930 |
1.173 |
0.068 |
|
||
|
DH |
Adsorption |
1.769 |
1.110 |
0.062 |
|
|
|
Desorption |
1.885 |
1.149 |
0.066 |
|
||
|
Total pore volume BET |
1.870 |
1.151 |
0.064 |
|
||
|
Pore radius Dv(r) (A°) |
BJH |
Adsorption |
157.0 |
161.7 |
158.6 |
|
|
Desorption |
90.06 |
90.31 |
88.97 |
|
||
|
DH |
Adsorption |
157.0 |
161.7 |
158.6 |
|
|
|
Desorption |
90.69 |
90.31 |
89.70 |
|
||
|
Average pore radius (DP) (A°), BET |
152.6 |
146.8 |
125.9 |
|
||
The calcination treatment affected the particle size and particle pore size. As shown in Figure 6, micrographic silica particles calcined at 1,000 and 1,200 ºC; the higher the calcination temperature, the larger the particle size, as shown in Figure 4 (a, b), but the smaller the pore size as shown in Figure 4 (c, d). The samples without calcination and with calcination had pore size with a similar value shown in Table 2 and Figure 6. The positions of the pore radius Dv(r) for the respective samples were 152.6, 146.8, and 125.9 A° with the differential volume of 0.000337, 0.00559, and 0.00827 cc/g, respectively. The total pore volume for pores with a radius of less than 1085.24 Å at P/Po = 0.991089 for the respective samples were 1.870, 1.151, and 0.064 cm2/g. Based on the N2 adsorption-desorption isothermal patterns of the samples, as shown in Figure 5, the maximum pore volume was 1,200, 770, and 40 cc/g, respectively.
DISCUSSION
Sample #4 calcined at 1,200 °C presented the transformation of amorphous silica NPs to the crystalline phase. The crystalline phase was detected by the formation of several peaks of the crystalline plane, as shown in Figure 1 (sample #4). The three dominant phases were formed in quartz, tridymite, and cristobalite structures. The X-ray diffraction peak of the quartz phase was detected at 2q of 26.68°; the tridymite phase was detected at 2q of 21.53° and 35.71°, and the cristobalite phase was detected at 2q of 22.05°, 28.49°, 31.43°, and 35.99°, confirming with PDF no 39-1425 (Munasir et al., 2018).
The uptake matches the characteristics of the silica uptake pattern obtained from references (Jiang et al., 2013; Nariyal et al., 2014). The absorption pattern of the synthesized Si-O-Si (siloxane) group observed at the wavenumber of 1,098 cm-1; the result was in accordance with the reference at the wavenumber of 1,050-1,115 cm-1. O-H functional group (water molecules) has absorption at a wavenumber of 1,639 cm-1 (Dhiman et al., 2012; Akl et al., 2013; Munasir et al., 2015). The absorption pattern of the Si-O-Si (siloxane) group was observed at the wavenumber of 1,095 cm-1, the results were in accordance with references at the wavenumber of 1,050-1,115 cm-1 (Nittaya Thuadaij, 2008; Rahman and Padavettan, 2012; Nariyal et al., 2014). Furthermore, O-H functional group has absorption at a wavenumber of 1,639 cm-1 (Nittaya Thuadaij, 2008; Rahman and Padavettan, 2012; Nariyal et al., 2014; Munasir et al., 2015).
The data analysis results of the FTIR spectra shown the phenomenon of the loss of absorption patterns of O-H groups (water molecules) as the higher the calcination temperature used is shown in Figure 2, respectively, from the samples infrared wave absorption pattern of sample #3 without calcination (a). the pattern of absorption of infrared waves for sample #3 after calcining at 1,000 °C (b), and the pattern of infrared absorption of sample #3 after calcination at 1,200 °C (Wanyika et al., 2011; Dhiman et al., 2012; Akl et al., 2013). The results of the analysis shown that the sample was formed in a type of mesoporous particle because its pore diameter was between 2-50 nm. The silica pore size distribution was influenced by the number of silanol-group (Si-OH) on the surface of the particles (Das et al., 2014). The calcination process was able to reduce silanol groups on silica surfaces so that, the increasing particle size also in line with the reducing pore surface area and porous volume (Rao et al., 2005; Le et al., 2013; Azlina et al., 2016; Zulfiqar et al., 2016).
The pore surface area of particles was studied by BET, BJH, and DH methods and calculated by extrapolating the graph in linear curves adsorption-dissipation (Figure 5). Pore surface area expressed as S (m2/g), BET was computed using a BET graph to approach the linear region of the adsorption-desorption curve; the results of the calculations are presented in Table 2. It was proven that the smaller the pore surface area of the particle as the temperature of calcination increases or the particle size decreases (Munasir, 2018). The analysis showed that for silica particles without calcination showed pore volume (Vp) adsorption and nitrogen absorption were quite large, around 1,200 cm2/g; and different phenomena showed that Vp decreased when the calcination temperature was increased. The pore volume of the samples #0, #3, and #4 were 1.826, 1.144, and 0.064 cm3/g, respectively, for the adsorption process; and were 1.930, 1.173, and 0.068 cm3/g, respectively for the desorption process (BJH Method). The Vp data are consistent with estimates using the BJH method: 1.769, 1.110, and 0.062 cm3/g (adsorption process) and 1.885, 1.149, and 0.066 cm3/g (desorption process). Physically, the particle grain growth process tended to eliminate the grain boundary area, and the narrowing of the pore of the particle, so that the porous volume decreased. Based on the reference of the IUPAC standardization, the pattern of adsorption and absorption (Figure 5), including type-IV, porous of the tested silica particles included mesoporous type, with particle shape like a sphere as SEM data (Azlina et al., 2016; Zulfiqar et al., 2016).
The differential porous volume decreased with increasing calcination temperature. Type IV isotherm graphs indicated adsorption graphs that made up the monolayer-multilayer. In this graph, there was a hysteresis loop which shown the adsorption and reabsorption processes in the adsorbent. The formation of the hysteresis loop as a result of the lower adsorbate adsorbed at a specific relative pressure and the higher the adsorbate that was desorbed to a particular pressure. Hysteresis loop in this isotherm was H1-type, where the dominant form of the porous structure was cylindrical and spherical (Naumov et al., 2009; Ramesh et al., 2014), type IV isotherm charts were commonly found in mesopore-sized adsorbents.
The pore sizes distribution (Figure 6), could be shown optimally for the silica NPs without calcination, then decreased for the NPs with calcination temperatures of 1,000, and 1,200 °C, which was in the range of 100-200 Å (porous diameter). The silica NPs without calcination showed the greatest change in porous volume when adsorption-dissipation of nitrogen gas was 8.4×10⁻³ (cm3/g). The calcination performed at temperatures of 1,000 and 1,200 °C exerted an influence on the change in the pore structure. Where there was a pattern of decreasing pore volume with a slight shift in the pore radius, furthermore, it was reinforced by the formation of the particles larger than those without calcination (Cabañas et al., 2007; Bhagat et al., 2008).
CONCLUSION
In this work, the natural sands were used to synthesize amorphous silica NPsThe transformation of the amorphous silica to quartz, tridymite, and cristobalite crystals structures were strongly influenced by the calcination temperature. At a calcination temperature of 1,200 °C, the polycrystalline tridymite, cristobalite, and quartz were observed with the dominant cristobalite phase. The calcination temperature initiated the grain growth, reduced the pore diameter pore volume, and pore surface area of the particles. The pore volume for the samples before calcination and after calcination tended to reduce significantly, i,e., 1,200 cc/g (before calcination) to 700 and 40 cc/g for the respective calcination of 1,000 and 1,200 °C.
ACKNOWLEDGEMENTS
The author (M) expresses his gratitude to the Ministry of Research and Higher Education of the Republic of Indonesia and the Department of Physics of Universitas Negeri Surabaya for providing experimental facilities.
REFERENCES
Akl, M.A., Aly, H.F., Soliman, H.M.A., Abd ElRahman, A.M.E., and Abd-Elhamid, A.I. 2013. Preparation and characterization of silica nanoparticles by wet mechanical attrition of white and yellow sand. Journal of Nanomedicine & Nanotechnology. 4(6): 1-14. https://doi.org/10.4172/2157-7439.1000183
Affandi, S., Setyawan, H., Winardi, S., Purwanto, A., and Balgis, R. 2009. A facile method for production of high-purity silica xerogels from bagasse ash. Advanced Powder Technology. 20(5): 468–472. https://doi.org/10.1016/j.apt.2009.03.008
Azlina, H.N., Hasnidawani, J.N., Norita, H., and Surip, S.N. 2016. Synthesis of SiO2 nanostructures using sol-gel method. Acta Physica Polonica A. 129: 842–844. https://doi.org/10.12693/APhysPolA.129.842
Barbé, C., Bartlett, J., Kong, L., Finnie, K., lin, H.Q., Larkin, M., Calleja, S., Bush, A., and Calleja, G. 2004. Silica particles: a novel drug-delivery system. Advanced Materials. 16(21): 1959–1966. https://doi.org/10.1002/adma.200400771
Bhagat, S.D., Kim, Y-H., Yi, G., Ahn, Y-S., Yeo, J-G., and Choi, Y-T. 2008. Mesoporous SiO2 powders with high specific surface area by microwave drying of hydrogels: a facile synthesis. Microporous Mesoporous Mater. 108(1-3): 333–339. https://doi.org/10.1016/j.micromeso.2007.03.026
Cabañas, A., Enciso, E., Carmen Carbajo, M., Torralvo, M.J., Pando, C., and Renucio, J.A.R. 2007. Studies on the porosity of SiO2-aerogel inverse opals synthesised in supercritical CO2. Microporous Mesoporous Mater. 99(1-2): 23–29. https://doi.org/10.1016/j.micromeso.2006.08.030
Chen, Y., Peng, Z., Kong, L.X., Huang, M.F., and Li, P.W. 2008. Natural rubber nanocomposite reinforced with nano silica. Polymer Engineering & Science. 48(9): 1674–1677. https://doi.org/10.1002/pen.20997
Dapiaggi, M., Pagliari, L., Pavese, A., Sciascia, L., Merli, M., and Francescon, F. 2015. The formation of silica high temperature polymorphs from quartz: influence of grain size and mineralising agents. Journal of the European Ceramic Society. 35(16): 4547–4555. https://doi.org/10.1016/j.jeurceramsoc.2015.08.015
Das, D., Yang, Y., O’Brien, J.S., Breznan, D., Nimesh, S., Bernatchez, S., Hill, M., Sayari, A., Vincent, R., and Kumarathasan, P. 2014. Synthesis and physicochemical characterization of mesoporous SiO2 nanoparticles. Journal of Nanomaterials. 2014: 1–12. https://doi.org/10.1155/2014/176015
Demir, E., and Castranova, V. 2016. Genotoxic effects of synthetic amorphous silica nanoparticles in the mouse lymphoma assay. Toxicology Reports. 3: 807–815. https://doi.org/10.1016/j.toxrep.2016.10.006
Dhiman, N., Singh, B.P., and Gathania, A.K.G. 2012. Synthesis and characterization of dye-doped TiO2-SiO2 core-shell composite microspheres. Journal of Nanophotonics. 6: 063511. https://doi.org/10.1117/1.JNP.6.06351
Favors, Z., Wang, W., Bay, H.H., Mutlu, Z., Ahmed, K., Liu, C., Ozkan, M., and Ozkan, C.S. 2014. Scalable synthesis of nano-silicon from beach sand for long cycle life Li-ion batteries. Scientific Reports. 4(5623): 1-8. https://doi.org/10.1038/srep05623
Fruijtier-Pölloth, C. 2012. The toxicological mode of action and the safety of synthetic amorphous silica a nanostructured material. Toxicology. 294: 61–79. https://doi.org/10.1016/j.tox.2012.02.001
Fu, D., Luan, B., Argue, S., Bureau, M.N., and Davidson, I.J. 2012. Nano SiO2 particle formation and deposition on polypropylene separators for lithium-ion batteries. Journal of Power Sources. 206: 325–333. https://doi.org/10.1016/j.jpowsour.2011.10.130
Guo, Q., Huang, D., Kou, X., Cao, W., Li, L., Ge, L., and Li, J. 2017. Synthesis of disperse amorphous SiO2 nanoparticles via sol–gel process. Ceramics International. 43(1): 192–196. https://doi.org/10.1016/j.ceramint.2016.09.133
Guttman, L. 1990. Ring structure of the crystalline and amorphous forms of silicon dioxide. Journal of Non-Crystalline Solids. 116: 145-147. https://doi.org/ 10.1016/0022-3093(90)90686-G
He, X., Shi, Q., Zhou, X., Wan, C., and Jiang, C. 2005. In situ composite of nano SiO2–P(VDF-HFP) porous polymer electrolytes for Li-ion batteries. Electrochimica Acta. 51(6): 1069–1075. https://doi.org/10.1016/j.electacta.2005.05.048
Heikal, M., Abd, E.l., Aleem, S., and Morsi, W.M. 2013. Characteristics of blended cements containing nano-silica. HBRC Journal. 9: 243–255. https://doi.org/10.1016/j.hbrcj.2013.09.001
Jang, H.D., Chang, H.K., Yoon, H.S., Cho, K. Park, J.H., and Oh, S.Y. 2008. Production of silica nanopowder from domestic siliceous mudstone. Colloids and Surfaces A: Physicochemical and Engineering Aspects. 313–314: 121–125. https://doi.org/10.1016/j.colsurfa.2007.04.081
Jal, P.K., Sudarshan, M., Saha, A., Patel, S., and Mishra, B.K. 2004. Synthesis and characterization of nanosilica prepared by precipitation method. Colloids and Surfaces A: Physicochemical and Engineering. 240(1-3): 173-178. https://doi.org/10.1016/j.colsurfa.2004.03.021
Jiang, C., Zhang, Y., Wang, Q., and Wang, T. 2013. Superhydrophobic polyurethane and silica nanoparticles coating with high transparency and fluorescence. Journal of Applied Polymer Science. 129: 2959–2965. https://doi.org/10.1002/app.39024
Kalapathy, U., Proctor, A., and Shultz, J. 2002. An improved method for production of silica from rice hull ash. Bioresource Technology. 85: 285–289. https://doi.org/10.1016/S0960-8524(02)00116-5
Karimi, P.E., Kakavandi, B., Nasseri, S., Hossien, M.A., NaBizadeh, R., Esrafili, A., and Ruzaei, K.R. 2016. Silica-coated magnetite nanoparticles core-shell spheres (Fe3O4@SiO2) for natural organic matter removal. Journal of Environmental Health Science & Engineering. 14(21): 1-13. https://doi.org/10.1186/s40201-016-0262-y
Kwon, S., Singh, R.K., Perez, R.A., Neel, E.A.A., Kim, H-W, and Chrzanowski, W. 2013. Silica-based mesoporous nanoparticles for controlled drug delivery. Journal of Tissue Engineering. 4: 1-18. https://doi.org/10.1177/2041731413503357
Le, V.H., Thuc, C.N.H., and Thuc, H.H. 2013. Synthesis of silica nanoparticles from Vietnamese rice husk by sol–gel method. Nanoscale Research Letters. 8: 58. https://doi.org/10.1186/1556-276X-8-58
Liou, T-H. 2004. Preparation and characterization of nano-structured silica from rice husk. Materials Science and Engineering: A. 364: 313–323. https://doi.org/10.1016/j.msea.2003.08.045
Luo, Z., Xu, Y., and Ye, Q. 2015. Effect of nano-SiO2-LDPE packaging on biochemical, sensory, and microbiological quality of Pacific white shrimp Penaeus vannamei during chilled storage. Fisheries Science. 81: 983–993. https://doi.org/10.1007/s12562-015-0914-3
Marians, C.S., and Hobbs, L.W. 1990. Network properties of crystalline polymorphs of silica. Journal of Non-Crystalline Solids. 124: 242–253. https://doi.org/10.1016/0022-3093(90)90269-R
Mizutani, T., Arai, K., Miyamoto, M., and Kimura, Y. 2006. Application of silica-containing nano-composite emulsion to wall paint: a new environmentally safe paint of high performance. Progress in Organic Coatings. 55: 276–283. https://doi.org/10.1016/j.porgcoat.2005.12.001
Mori, H. 2003. Extraction of silicon dioxide from waste colored glasses by alkali fusion using potassium hydroxide. Journal of Materials Science. 38: 3461–3468. https://doi.org/10.1023/A:1025100901693
Munasir, Sulton, A., Triwikantoro, Zainuri, M., and Darminto. 2013. Synthesis of silica nanopowder produced from Indonesian natural sand via alkalifussion route. In: AIP Conference Proceedings. AIP Publishing. 1555(28): 28–31. https://doi.org/10.1063/1.4820986
Munasir, Triwikantoro, Zainuri, M., and Darminto. 2015. Synthesis of SiO2 nanopowders containing quartz and cristobalite phases from silica sands. Materials Science-Poland. 33: 47–55. https://doi.org/10.1515/msp-2015-0008
Munasir, Supardi, Z.A.I, Mashadi, Nisa, Z., Kusumawati, D.H., Putri, N.P., Taufiy, A., Sunaryono, Hidayat, N., and Darminto. 2018. Phase transition of SiO2 nanoparticles prepared from natural sand: the calcination temperature effect. Series: Journal of Physics: Conference Series. 1093: 012025. https://doi.org/10.1088/1742-6596/1093/1/012025
Nariyal, R.K., Kothari, P., and Bisht, B. 2014. FTIR Measurements of SiO2 glass prepared by Sol-Gel technique. Chemical Science Transactions. 3(3): 1064-1068.
Naumov, S., Valiullin, R., Kärger, J., and Monson, P.A. 2009. Understanding adsorption and desorption processes in mesoporous materials with independent disordered channels. Physical Review E. 80(3): 031607. https://doi.org/10.1103/PhysRevE.80.031607
Nittaya Thuadaij, A.N. 2008. Preparation of nanosilica powder from rice husk ash by precipitation method. Chiang Mai Journal of Science. 35: 206–211.
Obrtlík, K., Čelko, L., Chráska, T., Sulak, I., and Gejdos, P. 2017. Effect of alumina-silica-zirconia eutectic ceramic thermal barrier coating on the low cycle fatigue behaviour of cast polycrystalline nickel-based superalloy at 900 °C. Surface and Coatings Technology. 318: 374-381. https://doi.org/10.1016/j.surfcoat.2017.03.003
Park, J.T., Lee, K.J., Kang, M-S., Kang, Y.S., and Kim, J.H. 2007. Nanocomposite polymer electrolytes containing silica nanoparticles: comparison between poly (ethylene glycol) and poly (ethylene oxide) dimethyl ether. Journal of Applied Polymer Science. 106(6): 4083–4090. https://doi.org/10.1002/app.26951
Quercia, G., Lazaro, A., J.W.Geus, J.W., and Brouwers, H.J.H. 2013. Characterization of morphology and texture of several amorphous nano-silica particles used in concrete. Cement and Concrete Composites. 44(2013), 77-92. https://doi.org/10.1016/j.cemconcomp.2013.05.006
Rahman, I.A., and Padavettan, V. 2012. Synthesis of silica nanoparticles by sol-gel: size-dependent properties, surface modification, and applications in silica-polymer nanocomposites: a review. Journal of Nanomaterials. 2012: 1-15. https://doi.org/10.1155/2012/132424
Ramesh, K., Reddy, K.S., Rashmi, I., and Biswas, A.K. 2014. Porosity distribution, surface area, and morphology of synthetic potassium zeolites: a SEM and N2 adsorption study. Communications in Soil Science and Plant Analysis. 45: 2171–2181. https://doi.org/10.1080/00103624.2014.929699
Rao, K.S., El-Hami, K., Kodaki, T., Matsushige, K., and Makino, K. 2005. A novel method for synthesis of silica nanoparticles. Journal of Colloid and Interface Science. 289(1): 125–131. https://doi.org/10.1016/j.jcis.2005.02.019
Saad Al-Farhan, B. 2016. Removal of Cd+2 and Pb+2 ions from aqueous solutions using bentonite-modified magnetic nanoparticles. International Journal of Nanomaterials and Chemistry. 2: 27–31. https://doi.org/10.18576/ijnc/020105
Said, A.M., Zeidan, M.S., Bassuoni, M.T., and Tian, Y. 2012. Properties of concrete incorporating nano-silica. Construction and Building Material. 36: 838–844. https://doi.org/10.1016/j.conbuildmat.2012.06.044
Sdiri, A., Higashi, T., Bouaziz, S., and Benzina, M. 2014. Synthesis and characterization of silica gel from siliceous sands of southern Tunisia. Arabian Journal of Chemistry. 7: 486–493. https://doi.org/10.1016/j.arabjc.2010.11.007
Shinohara, Y., and Kohyama, N. 2004. Quantitative Analysis of Tridymite and Cristobalite Crystallized in Rice Husk Ash by Heating., Journal of Industrial Health. 42(2), 277-2285. https://doi:10.2486/indhealth.42.277
Stevens, S., Hand, R.J., and Sharp, J.H. 1997. Polymorphism of silica. Journal of Materials Science. 32: 2929–2935. https://doi.org/10.1023/A:1018636920023
Trabelsi, W., Benzina, M., and Bouaziz, S. 2009. Physico-chemical characterisation of the Douiret sand (Southern Tunisia): Valorisation for the production of Silica Gel. Physics Procedia. 2: 1461–1467. https://doi.org/10.1016/j.phpro.2009.11.117
Wang, S., Hou, W., Wei, L., Jia, H., Liu, X., and Xu, B. 2007. Antibacterial activity of nano-SiO2 antibacterial agent grafted on wool surface. Surface and Coatings Technology. 202(3): 460-465. http://doi.org/10.1016/j.surfcoat.2007.06.012
Wanyika, H., Gatebe, E., Kioni, P., Tang, Z., and Gao, Y. 2011. Synthesis and characterization of ordered mesoporous silica nanoparticles with tunable physical properties by varying molar composition of reagents. African Journal of Pharmacy and Pharmacology. 5(21): 2402-2410. https://doi.org/10.5897/AJPP11.592
Waseem, M., Mustafa, S., Naeem, A., Shah, K.H., Shah, I., and Ihsan-ul-Haque. 2009. Synthesis and characterization of silica by Sol-Gel method. Journal of Pakistan Materials Society. 3(1):19-21.
Zulfiqar, U., Subhani, T., and Husain, S.W. 2016. Synthesis and characterization of silica nanoparticles from clay. Journal of Asian Ceramic Societies. 4: 91–96. https://doi.org/ 10.1016/j.jascer.2015.12.001
Munasir1*, Lydia Rohmawati1, Ahmad Taufiq2, and Darminto3
1Department of Physics, Faculty of Mathematics and Science, Universitas Negeri Surabaya, Indonesia
2Department of Physics, Faculty of Mathematics and Natural Sciences, Universitas Negeri Malang, Indonesia
3Department of Physics, Institut Teknologi Sepuluh Nopember, Indonesia
*Corresponding author. E-mail: munasir_physics@unesa.ac.id
Total Article Views
Article history:
Received: January 1, 2020
Revised: April 4, 2020
Accepted: April 10, 2020