 ISSN: 2822-0838 Online

Optimization of Treatment Conditions for Non-collagen Removal from Yellowfin Tuna Skin (Thunnus albacares)
Binh Cong Nguyen, Hong Minh Xuan Nguyen, Kha Hoang Nam Nguyen, and Tuyen Chan Kha*Published Date : 2020-07-17
DOI : https://doi.org/10.12982/CMUJNS.2020.0036
Journal Issues : Number 3, July-September 2020
ABsTRACT Yellowfin tuna skin (Thunnus albacares), a by-product from the processing of tuna fillet, can be used as raw material for collagen production. The removal of non-collagen composition in fish skin is a very important step in the extraction process of collagen. The optimization of treatment conditions for non-collagen removal by alkaline treatment was carried out using response surface methodology. The optimal sodium solution concentration, ratio of solution to yellowfin tuna skin and treatment time were found and validated to be 0.93N, 5:1 (v/w) and 28 hours, respectively. Under such conditions, the ratio of hydroxyproline/protein in the obtained collagen was 9.86% whilst the remaining fat content was 5.6% (dry basis). The conversion factor between hydroxyproline and collagen of yellowfin tuna (k) was 9.3.
Keywords: Collagen, Yellowfin tuna skin, Non-collagen removal, Hydroxyproline
INTRODUCTION
Collagen, one of the most abundant animal-derived proteins, accounts for approximately 30% of the protein in the animal. It is distributed mostly in skin, muscles, tendons, cartilage, bone, tooth and ligaments (Di Lullo et al., 2002). More than 29 types of collagen have been identified in different tissues, each with different amino acid sequences and physiological properties. Among those 29 types of collagen, type I collagen is the most common (Hulmes, 2008). Collagen is a hydroxyproline-rich substance, consisting of three twisted polypeptide chains with 1.5 nm diameter and 300 nm length (Jenkins and Raines, 2002). The structure of collagen has a repetitive pattern of Glycine-X-Y, in which X and Y can be any amino acids, but mostly proline and hydroxyproline (Silvipriya et al., 2015). Collagen fibers contain most of the ligaments, affecting the ability to compress cartilage joints and the flexibility of blood vessels and skin. It is considered a glue that binds parts of the human body to a complete block; without collagen, the human body will be individual parts. This demonstrates the importance of collagen in human life (Buehler, 2006; Zylberberg and Laurin, 2011).
The production of collagen from fish skin requires the removal of non-collagen composition including lipids, minerals, pigments, and non-collagen proteins. Non-collagen components are often eliminated by using dilute alkali solution or a combination of alkali solution and some non-polar solvents such as alcohol and n-hexane. Depending on the chemical composition and properties of type of fish skin, the conditions for alkaline treatment such as alkaline concentration, ratio of alkaline solution to fish skin, treatment temperature and time are very different. If the alkali concentration and fish skin treatment conditions are not suitable, they would significantly reduce the amount of collagen in fish skin (Liu et al., 2015).
Although there were many researches on the removal of non-collagen from fish skin, there is still a lack of information on optimization of treatment conditions for non-collagen removal from the skin of yellowfin tuna. Therefore, this study was designed to optimize the alkaline concentration, ratio of alkaline solution to the fish skin and treatment time to obtain the maximum efficiency of non-collagen and lipid removals from the fish skin by using response surface methodology (RSM). In addition, the conversion factor between hydroxyproline and collagen of yellowfin tuna was also determined.
MATERIALS AND METHODS
Chemicals
Standard amino acids and hydroxyproline (Sigma-Aldrich, USA) and all other reagents used in this study were analytical grade.
Sample preparation
Yellowfin tuna skin (Thunnus albacares), a by-product of the fish processing industry, was provided by J.K. FISH Co., Ltd. (Khanh Hoa Province, Vietnam). It was frozen at -40 °C and stored in an insulated container before being transferred to the laboratory. At the laboratory, the skin was thawed in water at 25 °C. The tuna skin was removed the leftover meat and scales and then washed with water at 10 °C. The cleaned skins were cut into small pieces (1 × 1 cm), washed again with water at 10 °C and let drained. After that, they were homogenously mixed, packed in plastic bags, frozen at -40 °C for 30 minutes, and stored at -20 °C (Mitsubishi freezer, Japan) for further use.
To remove non-collagen composition, the tuna skins were treated with (4 - 10) volumes (v/w) of alkali solution (0.8 - 1.2N NaOH) at 4 °C in a laboratory refrigeration (LCL - 2075D Labtech, Korea) for 20 - 30 hours. After the alkali treatment, the skin was washed with a cold distilled water (10 °C) to pH of 7.
Experimental design
Response surface methodology (RSM) was employed to optimize treatment conditions for non-collagen removal from yellowfin tuna skin using NaOH solution. The independent variables include the concentration of NaOH (X1, N), treatment time (X2, hour), and ratio of NaOH solution/fish skin (X3, v/w). The levels of the independents were based on preliminary experiment results (data not shown). The levels of the independent variables used in this RSM design are presented in Table 1. The experimental design was based on Box-Behnken model with three central points. All experiments were performed in triplicate. A second-order polynomial equation was used to express the percentage of hydroxyproline/protein (Y1, %) and percentage of remaining lipid compared to dry matter (Y2, %). The functions of the independent variables were presented as the following equation:
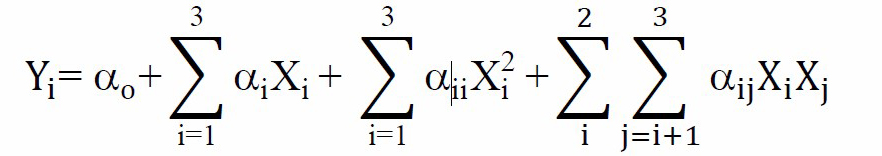
where Yi represents the response variables; ao is a constant; ai, aii, aij are the linear, quadratic and interactive coefficients, respectively. Xi, Xj are the levels of the independent variables.
Table 1. The code and uncoded values of independent variables.
|
Independent variables |
Symbol |
Range and levels |
||
|
-1 |
0 |
1 |
||
|
Concentration of NaOH (N) Treatment time (hour) Ratio of NaOH solution to fish skin (v/w) |
X1 X2 X3 |
0.8 20 4:1 |
1 25 7:1 |
1.2 30 10:1 |
Proximate analysis of yellowfin tuna fish skin
Proximate analyses were performed according to the methods established by the AOAC (2000). In brief, the moisture content was determined by the drying method at 105 oC with heat-drying cabinet (model 30-1,060, Memmert, Germany). Crude fat content was analyzed with an automatic extractor (Gerhardt SE416, Germany). Crude ash was analyzed by burning at 550oC with a furnace (Nabertherm Gmbh, Germany) and crude protein was analyzed with an automatic analyzer (2300KJEL-TEC, Switzerland) based on the Kjeldahl nitrogen determination method (N x 6.25).
Determination of amino acid content
An amount of 0.1 gram of sample was dissolved in 5mL of 6N HCl and hydrolyzed in COD (Chemical Oxygen Demand) tube at 110 °C for 24 hours by ECO8 equipment (VELP, Italy). Afterward, it was neutralized by 6N NaOH and 0.1N NaOH, volumed up to 25mL with distilled water and centrifuged (at 4 °C, x10,000g, for 10 min) to remove insoluble contents. The supernatant was filtered through a 0.45 µm syringe membrane, and the filtrate was created derivatives with 4-Dimethylaminoazobenzene-4'-sulphonyl chloride (DABS-C1) (Stocchi et al., 1992).
When the sample was hydrolyzed with acid, the amino acids tryptophan and tyrosine were lost. Therefore, to determine these two amino acids, the sample must be hydrolyzed with alkaline. An amount of 0.1 gram of collagen samples was dissolved in 5 mL of 4 N NaOH and hydrolyzed in COD tube and Argon (Ar) gas reduction for 3 minutes at a rate of 10 mL/min. The CODs tube was incubated at 120 °C for 18 hours by ECO8 equipment (VELP, Italy). Samples after hydrolysis were acidified to pH 6.5 with 4N HCl and 0.1N HCl and removed insoluble parts by centrifugation (4 °C, x10,000g, 10 min). The supernatant was alkalized to pH 12, added 0.01N NaOH to full 25 mL and filtered through a 0.45 µm syringe membrane. The filtrate was created derivatives with 4-Dimethylaminoazobenzene-4'-sulphonyl chloride (DABS-C1) (Stocchi et al., 1992).
HPLC analysis of amino acids was performed with an Agilent 1,200 HPLC (Santa Clara, CA, USA) equipped with diode array detector system consisting of a ACC C18 (4.6 x 250 mm) collumn. The mobile phase consisted of acetonitrile (ACN) and buffer trifluoroacetic acid (20: 80, v/v). The flow rate of 1 mL/min was at 40oC, the detection was at 250 nm, and the injection volume was 20 mL. The identification of amino acids was based solely on the retention time of peaks compared with authentic standards. The amount of amino acids in the yellowfin tuna skin was expressed as g/100g.
Similarly, the content of hydroxyproline was analyzed using HPLC method (Stocchi et al., 1992). The mobile phase consisted of acetate buffer and acetonitrile (75:25, v/v). The flow rate of 1 mL/min was at 40 °C, the detection was at 465 nm, and the injection volume was 20 mL. The identification of hydroxyproline was based solely on the retention time of peak compared with authentic standard.
Determination of collagen content
The determination of collagen was based on the content of hydroxyproline in the sample (Stocchi et al., 1992). The collagen content was calculated according to the formula:
RESULTS
Proximate composition of yellowfin tuna skin
The chemical composition of yellowfin tuna skin before treatment is presented in Table 6. The results indicated that the ash content of yellowfin tuna skin was very low (about 1%) as the scales on the skin were removed. The lipid content in the skin was about 11%. High content of protein (about 88%, dry matter, d.m.) in the fish skin was found, in which the most abundant component was collagen (approximately 70%, d.m.).
Fitting the model
The percentage of hydroxyproline/protein (Y1, %) and the percentage of remaining lipid to dry matter (Y2, %) obtained from all experiments are presented in Table 2. ANOVA analysis (Table 3) showed that the second order polynominal model adequately represented the experimental data with the coefficient of multiple determination (R2) for the responses Y1 and Y2 being high (R2 = 0.99). The predicted values argeed well with the experimental ones obtained from the RSM design (Table 2). Furthermore, statistical results also indicated that the two quadratic regression models were significant (P < 0.001), and there was non-significance in the lack of fit (P > 0.05) in each of the models. As a result, it proves that the quadratic models were adequate to describle the influence of the independent variables investigated on the Y1 and Y2.
Table 2. Experimental (Exp.) and predicted (Pred.) values of Y1 and Y2 obtained from Box-Behnken design.
|
Exp. runa |
Uncoded levels of variable |
|
Hydroxyproline/protein (Y1, %) |
|
Lipid/dry matter (Y2, %) |
||||
|
X1 |
X2 |
X3 |
|
Exp. |
Pred. |
|
Exp. |
Pred. |
|
|
1 |
0.8 |
30 |
7 |
|
9.46 |
9.49 |
|
6.25 |
6.167 |
|
2 |
1.0 |
25 |
7 |
|
9.78 |
9.75 |
|
5.67 |
5.69 |
|
3 |
1.0 |
20 |
4 |
|
9.14 |
9.18 |
|
6.34 |
6.30 |
|
4 |
1.0 |
20 |
10 |
|
9.46 |
9.45 |
|
6.15 |
6.11 |
|
5 |
0.8 |
20 |
7 |
|
9.25 |
9.25 |
|
6.39 |
6.39 |
|
6 |
0.8 |
25 |
10 |
|
9.14 |
9.16 |
|
6.44 |
6.48 |
|
7 |
1.0 |
30 |
4 |
|
9.78 |
9.79 |
|
5.65 |
5.69 |
|
8 |
1.2 |
25 |
10 |
|
8.82 |
8.86 |
|
6.95 |
6.90 |
|
9 |
1.0 |
25 |
7 |
|
9.78 |
9.75 |
|
5.64 |
5.69 |
|
10 |
1.2 |
30 |
7 |
|
8.92 |
8.92 |
|
6.76 |
6.76 |
|
11 |
1.0 |
25 |
7 |
|
9.68 |
9.75 |
|
5.76 |
5.69 |
|
12 |
1.2 |
25 |
4 |
|
8.82 |
8.81 |
|
6.88 |
6.84 |
|
13 |
0.8 |
25 |
4 |
|
9.57 |
9.53 |
|
6.06 |
6.11 |
|
14 |
1.2 |
20 |
7 |
|
8.82 |
8.79 |
|
6.87 |
6.95 |
|
15 |
1.0 |
30 |
10 |
|
9.25 |
9.21 |
|
6.26 |
6.31 |
Note: X1: NaOH concentration (N); X2: treatment time (h); X3: ratio of NaOH solution to fish skin (v/w)
The significance of the coefficients of the quadratic polynomial models was determined using t ratio and P-value (significance level) and is listed in Table 3. The larger absolute t ratio and smaller P-value would indicate a more significant effect on the dependent variables (Amin and Anggoro, 2004). It could be seen that the most independent variables had a significant effect on Y1 and Y2, except for interaction term of X1 and X2 (for responses Y1 and Y1) and interaction term of X1 and X3.
Table 3. Regression coefficients of the fitted quadratic equation for dependent variables of Y1 (%) and Y2 (%).
|
Regression coefficient |
The percentage of hydroxyproline/protein (Y1, %) |
The percentage of remaining lipid/dry matter (Y2, %) |
||
|
|
Regression coefficient |
t value |
Regression coefficient |
t value |
ao |
9.747 |
|
5.690 |
|
|
Linear |
|
|
|
|
|
a1 |
-0.255*** |
-12.84 |
0.290*** |
9.67 |
|
a2 |
0.093** |
4.66 |
-0.104* |
-3.46 |
|
a3 |
-0.080* |
-4.03 |
0.109* |
3.63 |
|
Quadratic |
|
|
|
|
|
a11 |
-0.477*** |
-16.33 |
0.680*** |
15.40 |
|
a22 |
-0.157** |
-5.38 |
0.198** |
4.47 |
|
a33 |
-0.182** |
-6.23 |
0.213** |
4.81 |
|
Interaction |
|
|
|
|
|
a12 |
-0.028 |
-0.98 |
0.008 |
0.18 |
|
a13 |
0.108* |
3.83 |
-0.078 |
-1.83 |
|
a23 |
-0.213*** |
-7.57 |
0.200** |
4.72 |
|
R2 |
0.99 |
|
0.99 |
|
|
P-value of lack of fit |
0.56 |
|
0.31 |
|
Note: *P < 0.05; **P < 0.01; ***P < 0.001; ao is a constant, ai, aii and aij are the linear, quadratic and interactive coefficients of the second-order polynomial equation, respectively.
Response surface analysis
The optimal levels of the independent variables for Y1 and Y2, can be determined using the 3D surface and 2D contour plots. The response surface plot expresses the relationship between the independent variables and the responses, while the contour plot helps to visualize the shape of a response surface. Therefore, it is useful to use the plots to evaluate the fits of model. The effects of NaOH concentration (X1), treatment time (X2), and the ratio of NaOH solution/ fish skin (X3) on the percentage of hydroxyproline to protein (Y1) and the percentage of remaining lipid to dry matter (Y2) are presented in Table 3 by the coefficients of quadratic model. The response surface and contour plots based on these coefficients are shown in Figures 1 and 2. In general, all regression coefficients of the model statistically impacted on the Y1 and Y2, except for the interactive term of X1X2 and interactive term of X1X3 (only for Y2). Therefore, the coded regression equations of the response Y1 and Y2 were established as follows:
Y1 = 9.747 – 0.255X1 + 0.093X2 – 0.080X3 + 0.108X1X3 – 0.213X2X3 – 0.477X12 – 0.157X22 – 0.182X32 (Eq. 1)
Y2 = 5.690 + 0.290X1 – 0.104X2 + 0.109X3 + 0.200X2X3 + 0.680X12 + 0.198X22 + 0.213X32 (Eq. 2)
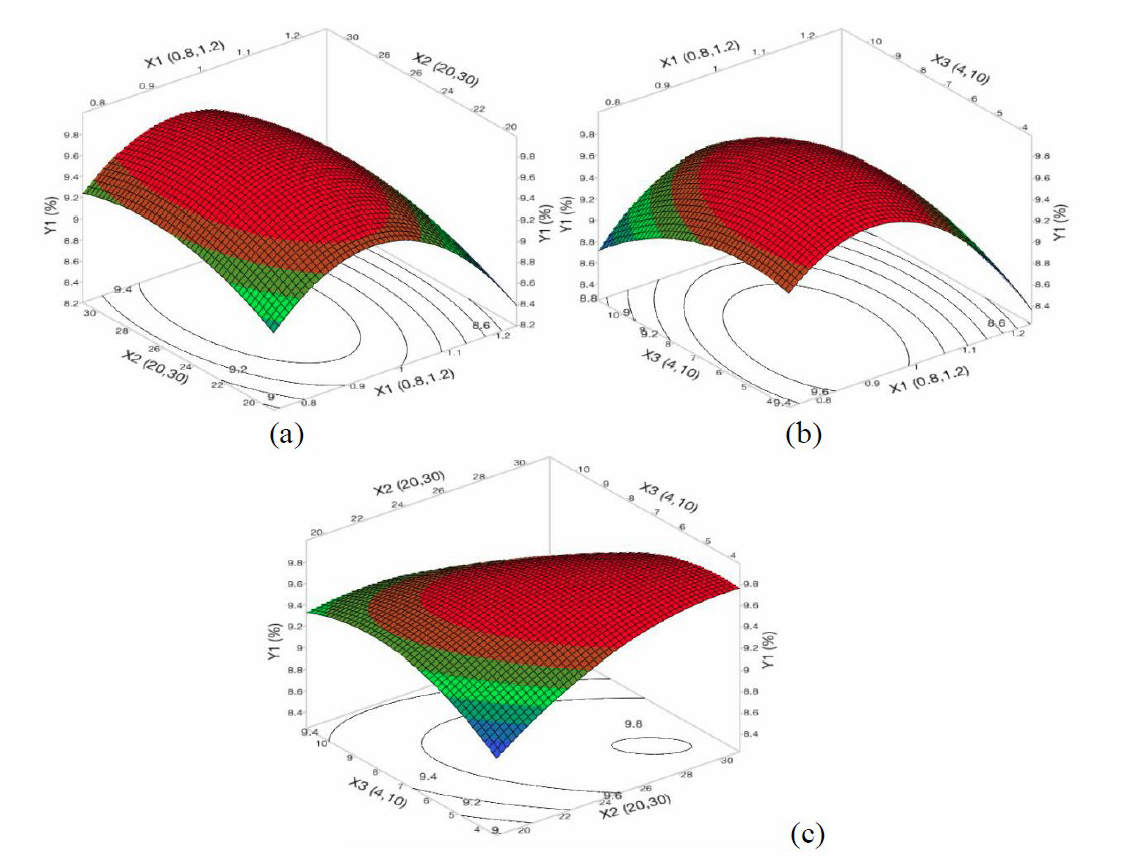
Figure 1. The 3D response surface and 2D contour plots of the percentage of hydroxyproline to protein (Y1) affected NaOH concentration (X1), treatment time (X2), and ratio of NaOH solution/ fish skin (X3).
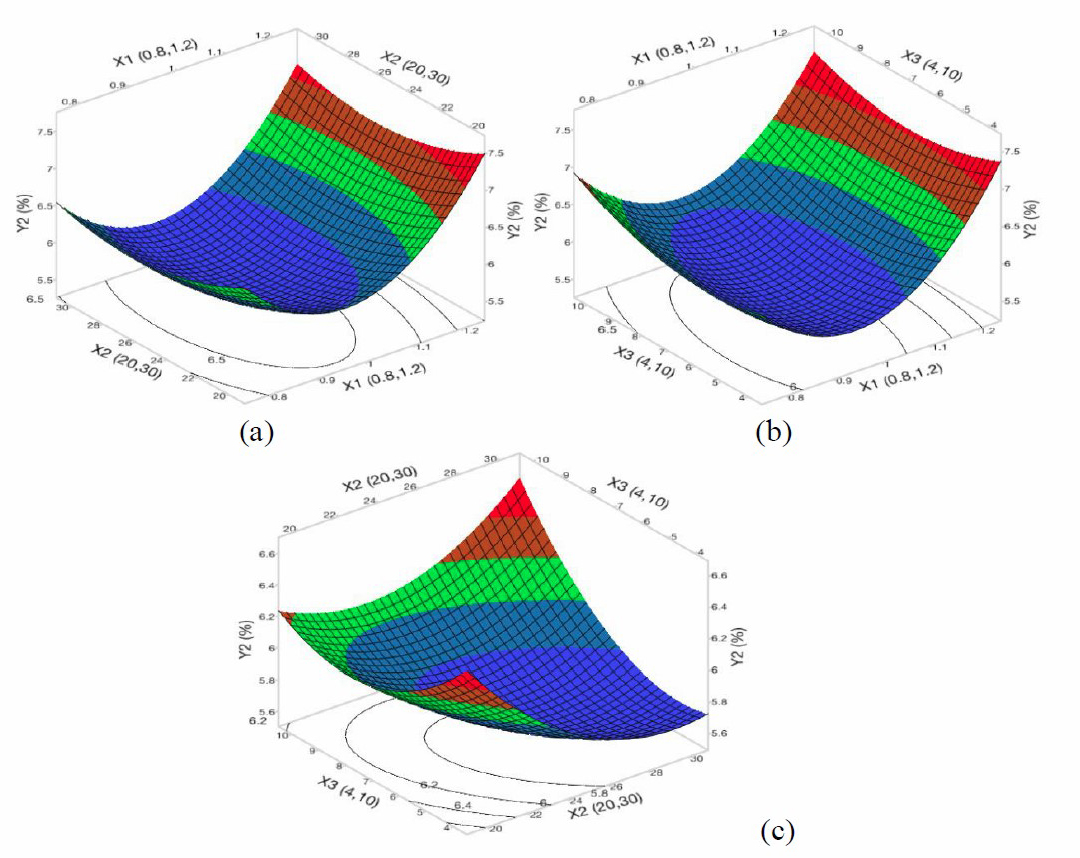
Figure 2. The 3D response surface and 2D contour plots of the percentage of remaining lipid to dry matter (Y2) affected NaOH concentration (X1), treatment time (X2), and ratio of NaOH solution/ fish skin (X3).
Overall optimal treatment conditions and model validation
This study aimed to determine the treatment conditions for non-collagen removal from yellowfin tuna skin, and a graphical optimization (Figure 3) was therefore performed using JMP package. The most important criterion was to obtain the highest percentage of hydroxyproline to protein (Y1) and the lowest percentage of remaining lipid in the fish skin (Y2). According to Figure 3, the theoretical maximum value of Y1 and minimum value of Y2 could be obtained by combining NaOH concentration, treatment time and ratio of NaOH solution/ fish skin. Based on the prediction profiler, the mathematical model suggested the optimal theoretical values of Y1 and Y2 under the optimal conditions (NaOH concentration of 0.93N, treatment time of 28 hours, and the ratio of NaOH solution/ fish skin of 5:1, v/w) as shown in Table 4. In addition, the comparison between predicted and measured response values is a way for establishing how accurately the model describes the studied process. Therefore, an experiment (with three replicates) was performed at obtained optimal conditions. Statistical results indicated that there was insignificant difference between the predicted and measured responses of Y1 and Y2 (Table 4). It is evident that the measured values of the responses were found to be well suited to the predicted ones by the regression model. As a result, the suitability of the quadratic equation for predicting the optimal response values was validated under the optimal conditions.
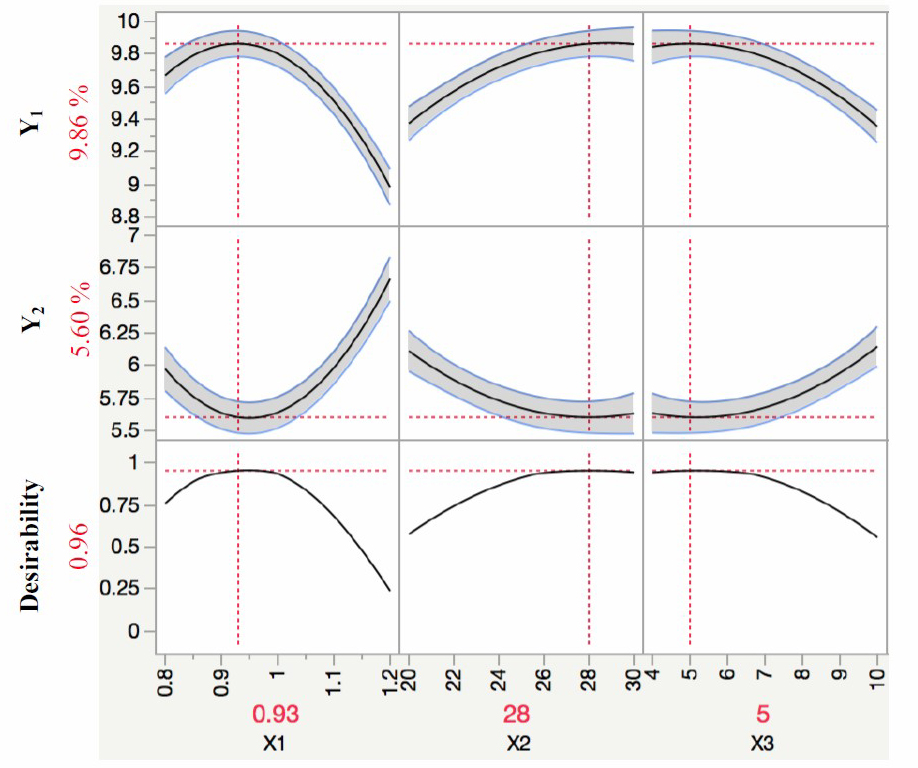
Figure 3. Prediction profilers of percentage of hydroxyproline to protein (Y1) and the lowest percentage of remaining lipid in the fish skin (Y2) as a function of NaOH concentration (X1), treatment time (X2), and ratio of NaOH solution/ fish skin (X3).
Table 4. Optimal treatment conditions for non-collagen removal.
|
Optimal conditions |
|
Y1 (%) |
|
Y2 (%) |
||||
|
X1 (N) |
X2 (h) |
X3 (v/w) |
|
Predicted |
Measured |
|
Predicted |
Measured |
|
0.93 |
28 |
5/1 |
|
9.86a |
9.94a |
|
5.60a |
5.50a |
Note: NaOH concentration (X1), treatment time (X2), and ratio of NaOH solution/ fish skin (X3); percentage of hydroxyproline to protein (Y1) and the lowest percentage of remaining lipid in the fish skin (Y2).
Chemical composition of yellowfin tuna skin after treatment for non-collagen removal
The results indicated that yellowfin tuna skin treated under optimal treatment conditions (NaOH concentration of 0.93 N, treatment time of 28 h, and the ratio of NaOH solution to the fish skin of 5:1, v/w) had the maximum percentage of hydroxyproline/protein and minimum percentrage of lipid content/dry matter. The amino acid composition of treated fish skin is presented in Table 5. Furthermore, the proximate composition of the starting fish skin and the treated fish skin was also analyzed and compared (Table 6). The results indicated that the content of protein and collagen and the removal of lipid in the optimally treated fish skin was significantly much higher than that of the starting one.
Table 5. Amino acid composition of yellowfin tuna skin after non-collagen removal treatment.
|
No |
Amino acids |
Content (g/100 g) |
|
1 |
Arginine |
1.6 |
|
2 |
Serine |
1.0 |
|
3 |
Aspartic acid |
1.7 |
|
4 |
Glutamic acid |
2.1 |
|
5 |
Hyroxyproline |
10.8 |
|
6 |
Glycine |
23.4 |
|
7 |
Threonine |
0.3 |
|
8 |
Alanine |
5.1 |
|
9 |
Aminobutyric acid |
0.5 |
|
10 |
Proline |
20.3 |
|
11 |
Methionine |
25.2 |
|
12 |
Tryptophane |
0.1 |
|
13 |
Valine |
0.1 |
|
14 |
Phenylalanine |
1.3 |
|
15 |
Cysteine |
0.9 |
|
16 |
Tyrosine |
2.7 |
|
17 |
Isoleucine |
0.5 |
|
18 |
Leucine |
2.2 |
|
19 |
Ornthine |
0.0 |
|
20 |
Lysine |
0.1 |
|
21 |
Histidine |
0.2 |
Table 6. Proximate composition of yellowfin tuna skin before and after treatment.
| Treatment | Moisture(%) |
Crude protein (%, d.m.) |
Collagen(%, d.m.) |
Crude lipid (%, d.m.) |
Ash (%, d.m.) |
|
Before |
63.59a ± 0.78 |
87.94a ± 0.12 |
69.68a ± 0.07 |
11.07a ± 0.05 |
0.99a ± 0.02 |
|
After |
77.69b ± 0.02 |
92.54b ± 0.03 |
85.58b ± 0.06 |
5.50b ± 0.02 |
1.6b ± 0.07 |
Note: Data are means ± SD; the values in the same column followed by different superscripts (a–b) were significantly different (P < 0.05)
DISCUSSION
Response surface optimization of non-collagen removal
Figure 1 shows that the effect of the concentration of NaOH, the treatment time and the ratio of NaOH solution to the fish skin on the percentage of hydroxyproline to protein. It can be generally seen in Figures 1a and 1b that an increase in NaOH concentration (from 0.8 N to 0.93 N) resulted in an increase in the ratio hydroxyproline to protein. It indicates that the higher NaOH concentration was more effective in removing of non-collagen substances. However, when the NaOH concentration increased from 0.93 N to 1.2 N, the ratio of Hydroxyproline to protein decreased. It could be explained by the fact that there was the hydrolysis of collagen, leading to a decrease of hydroxyproline to protein ratio (Liu et al., 2015). The loss of collagen also resulted in a decrease of dry matter, as a result, the ratio between lipid and dry matter increased. A similar trend is also found in the study of Woo et al. (2008) for non-collagen treatment from yellowfin tuna (Thunnus albacares) dorsal skin.
Since the treatment time increased from 20 to 28 h (Figures 1b and 1c), the ratio of hydroxyproline to protein also increased, indicating the effectiveness in removing non-collagen from fish skin of the alkaline treatment over the period of time. However, the effectiveness remained unchanges as the treatment time increased from 28 to 30 h. This could be explained that when a concentration of NaOH and the ratio of NaOH concentration to the fish skin were fixed, the content of the solute in solution would reach a maximum level and stopped spreading into solvents. According to Woo et al. (2008), the non-collagen treatment time was about 24 h but the soaking temperature was 9 °C. Similarly, another study showed that the treatment condition for yellowfin tuna skin including temperature, NaOH concentration and time were 10 °C, 1.89% and 2.87 days, respectively (Cho, et al., 2005). However, those studies did not indicate how removal rate of non-collageneous proteins was, only the properties of the obtained collagen were reported. As such, it is desirable that determination of the purity of the obtained collagen should be performed. In the current study, the treatment conditions of removing non-collagen and lipid was successfully optimized.
Although treatment time depended on the treatment temperature and NaOH concentration, most studies showed that good quality of the resultant collagen could only be obtained when treated with NaOH at the temperature less than 10 °C due to the protein nature of collagen. In the study, therefore, the treatment temperature of 4 °C was fixed in the optimization process.
The ratio of NaOH solution to the fish skin also affected the removal of non-collagen in the yellowfin tuna skin. As increasing the ratio of solution NaOH to the fish skin (v/w) from 4:1 to 5:1, the removal of non-collagent was significantly increased. On the contrary, a decrease in the removal was found as the ratio of NaOH solution to the fish skin was increased. This increase results in a small amount of collagen partly dissolved into the solvent, leading to decreasing the effectiveness of non-collagen removal. According to Woo et al. (2008), the ratio of NaOH to the fish skin solution should be fixed at 5:1 (v/w), whereas Cho, et al., (2005) recommened the ratio should be 8:1 (v/w). It could be due to different treatment conditions such as temperature and concentration of NaOH.
Response surface optimization of lipid removal
According to Figure 2, the effect of the concentration of NaOH, the treatment time and the ratio of NaOH solution to the fish skin on the percentage of lipid removal. It can be seen that an increase in NaOH concentration (from 0.8 N to 0.93 N) resulted in decreasing the remaining lipid content in the fish skin or increasing the lipid removal. As above-mentioned, the increase in the remaining lipid content was found as the concentration of NaOH increased from 0.9 to 1.2 N. This is due to the loss of collagen at higher NaOH concentration, resulting in decrease of dry matter. Furthermore, the remaining lipid content was found to be higher as increasing the ratio of NaOH solution to the fish skin, in which the ratio was higher 5:1 (v/w). This could be because the lipid solubility was less affected by the ratio of NaOH/fish skin(v/w), only depended on the concentration of NaOH. In contrast, as increasing the ratio of NaOH to the fish skin, the dry matter was decreaed due to the the loss of soluble proteins. Therefore, the rate of remaining lipids increased. In addition, due to the natural structure of lipid being insoluble at higher alkaline concentration, higher concentration of NaOH should not recommended.
As increasing the soaking time of NaOH from 20 to 28h, the decrease in the remaining lipid content was found (Figures 2a and 2c), indicating the effectiveness of lipid removal from fish skin by alkaline treatments over time. However, the effectiveness remained unchanged as the treatment time increased from 28 to 30 h. This could be explained that when the skin was soaked in NaOH solution, the lipid in the fish skin would dissolve into the NaOH solution. As such, the difference in lipid concentration in the NaOH solution and in the fish skin decreased with increasing soaking time. Afterward, the mass transfer of lipid from the fish skin to the solution reached to equilibrium state.
Overall optimal treatment conditions
As shown in this study, the response surface optimization methodology for the treatment conditions of non-collagen removal from the fish skin was found to be of practical value. It is general agreed that, the treatment before further processing steps can have effects on the chemical composition of the treated fish skin. The comparison of before and after treatments was also performed and the results showed that a significant improvement in the optimal treated fish skin, in terms of the removal of non-collagen and lipid, was found to be higher than that of the untreated one. In general, the conversion factor from hydroxyproline to collagen can be determined from the hydroxyproline component. From Table 5, it can be found that the content of hydroxyproline accounts for 10.8% of total amino acids. Thus, the conversion factor of hydroxyproline to collagen (k) would be of 9.3. This factor could be used to calculate the collagen content from the hydroxyproline content in the yellowfin tuna fish skin.
CONCLUSIONS
Overall, the study established that the quadratic polynomial model was sufficient to describe and predict the optimized treatment conditions for removal of non-collagen and lipid from the yellofin tuna skin. The data could adequately fit two second-order polynomial models for the percentages of hydroxyproline to protein and remaining lipid to dry matter with high value of R2 (0.99). The graphical optimization was adopted and it predicted the optimal treatment parameters within the experimental ranges including NaOH concentration of 0.93 N, treatment time of 28 h, and the ratio of NaOH solution to the fish skin of 5:1 (v/w). Under such conditions, the the percentages of hydroxyproline to protein and remaining lipid to dry matter achieved were predicted and confirmed as 9.94% and 5.5%, respectively. In addition, the coversion factor between hydroxyproline and collagen of the yellowfin tuna was found to be 9.3. Therefore, it can be concluded that the high content of collagen in the treated yellowfin tuna skin was successfully obtained by alkaline treatment. This is one of the most important treatment steps to produce high quality collagen and its derivatives from the yellowfin tuna fish skin.
REFERENCES
Amin, N.A.S., and Anggoro, D.D. 2004. Optimization of direct conversion of methane to liquid fuels over Cu loaded W/ZSM-5 catalyst. Fuel. 83(4-5): 487-494. https://doi.org/10.1016/j.fuel.2003.09.013
AOAC.2000. Official method 950.46. Moisture in raw and processed meats. In: Official methods of analysis of AOAC international. AOAC International.
Boran, G., and Regenstein, J.M. 2009. Optimization of gelatin extraction from silver carp skin. Journal of Food Science. 74(8): 432-441. https://doi.org/10.1111/j.1750-3841.2009.01328.x
Buehler, M.J. 2006. Nature designs tough collagen: Explaining the nanostructure of collagen fibrils. Proceedings of the National Academy of Sciences of the United States of America. 103(33): 12285-12290. https://doi.org/10.1073/pnas.0603216103
Cho, S.M., Gu, Y.S., and Kim, S.B. 2005. Extracting optimization and physical properties of yellowfin tuna (Thunnus albacares) skin gelatin compared to mammalian gelatins. Food Hydrocolloids. 19(2): 221-229. https://doi.org/10.1016/j.foodhyd.2004.05.005
Di Lullo, G.A., Sweeney, S.M., Körkkö, J., Ala-Kokko, L., and San Antonio, J.D. 2002. Mapping the ligand-binding sites and disease-associated mutations on the most abundant protein in the human, type I collagen. Journal of Biological Chemistry. 277(6): 4223-4231. https://doi.org/10.1074/jbc.M110709200
Hulmes, D.J.S. 2008. Collagen diversity, synthesis and assembly: in Peter Fratzl. Collagen: Structure and Mechanics. New York, USA: Spinger. 15-41.
Jenkins, C.L., and Raines, R.T. 2002. Insights on the conformational stability of collagen. Natural Product Reports. 19(1): 49-59. https://doi.org/10.1039/A903001H
Liu, D., Wei, G., Li T., Hu, J., Lu, N., Regenstein, J.M., and Zhou, P. 2015. Effects of alkaline pretreatments and acid extraction conditions on the acid-soluble collagen from grass carp (Ctenopharyngodon idella) skin. Food Chemistry. 172: 836-843. https://doi.org/10.1016/j.foodchem.2014.09.147
Silvipriya, K.S., Krishna Kumar, K., Bhat, A.R., Dinesh Kumar, B., John, A., and Lakshmanan, P. 2015. Collagen: animal sources and biomedical application. Journal of Applied Pharmaceutical Science. 5(3): 123-127. https://doi.org/10.7324/JAPS.2015.50322
Stocchi, V., Palma, F., Piccoli, G., Biagiarelli, B., Magnani, M., Masat, L., and Cucchiarini, L. 1992. Analysis of amino acids as DABS-derivatives with a sensitivity to the femtomole level using RP-HPLC narrow-bore columns. Amino Acids. 3(3): 303-309. https://doi.org/10.1007/BF00806005
Woo, J.W., Yu, S.J., Cho, S.M., Lee, Y.B., and Kim, S.B. 2008. Extraction optimization and properties of collagen from yellowfin tuna (Thunnus albacares) dorsal skin. Food Hydrocolloids. 22(5): 879-887. https://doi. Org/10.1016/j.foodhyd.2007.04.015
Zylberberg, L., and Laurin, M. 2011. Analysis of fossil bone organic matrix by transmission electron microscopy. Comptes Rendus - Palevol. 10(5-6): 357-366. https://doi.org/10.1016/j.crpv.2011.04.004
Binh Cong Nguyen1,2, Hong Minh Xuan Nguyen1, Kha Hoang Nam Nguyen3, and Tuyen Chan Kha1*
1Faculty of Food Science and Technology, Nong Lam University, Viet Nam
2Faculty of Fisheries, Ho Chi Minh City University of Food Industry, Viet Nam
3Faculty of Fisheries, Nong Lam University, Viet Nam
*Corresponding author. E-mail: khachantuyen@hcmuaf.edu.vn
Total Article Views
Article history:
Received: December 26, 2019
Revised: February 21, 2020
Accepted: March 19, 2020